Spring 2020 Issue
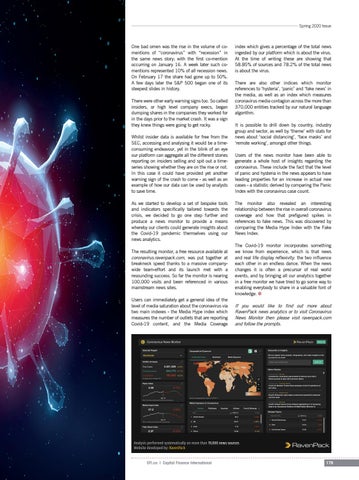
One bad omen was the rise in the volume of comentions of “coronavirus” with “recession” in the same news story; with the first co-mention occurring on January 16. A week later such comentions represented 10% of all recession news. On February 17 the share had gone up to 50%. A few days later the S&P 500 began one of its steepest slides in history. There were other early warning signs too. So called insiders, or high level company execs, began dumping shares in the companies they worked for in the days prior to the market crash. It was a sign they knew things were going to get rocky. Whilst insider data is available for free from the SEC, accessing and analysing it would be a timeconsuming endeavour, yet in the blink of an eye our platform can aggregate all the different stories reporting on insiders selling and spit out a timeseries showing whether they are on the rise or not. In this case it could have provided yet another warning sign of the crash to come - as well as an example of how our data can be used by analysts to save time. As we started to develop a set of bespoke tools and indicators specifically tailored towards the crisis, we decided to go one step further and produce a news monitor to provide a means whereby our clients could generate insights about the Covid-19 pandemic themselves using our news analytics. The resulting monitor, a free resource available at coronavirus.ravenpack.com, was put together at breakneck speed thanks to a massive companywide team-effort and its launch met with a resounding success. So far the monitor is nearing 100,000 visits and been referenced in various mainstream news sites. Users can immediately get a general idea of the level of media saturation about the coronavirus via two main indexes - the Media Hype index which measures the number of outlets that are reporting Covid-19 content, and the Media Coverage
CFI.co | Capital Finance International
index which gives a percentage of the total news ingested by our platform which is about the virus. At the time of writing these are showing that 58.85% of sources and 78.2% of the total news is about the virus. There are also other indices which monitor references to ‘hysteria’, ‘panic’ and ‘fake news’ in the media, as well as an index which measures coronavirus media contagion across the more than 370,000 entities tracked by our natural language algorithm. It is possible to drill down by country, industry group and sector, as well by ‘theme’ with stats for news about ‘social distancing’, ‘face masks’ and ‘remote working’, amongst other things. Users of the news monitor have been able to generate a whole host of insights regarding the coronavirus. These include the fact that the level of panic and hysteria in the news appears to have leading properties for an increase in actual new cases - a statistic derived by comparing the Panic Index with the coronavirus case count. The monitor also revealed an interesting relationship between the rise in overall coronavirus coverage and how that prefigured spikes in references to fake news. This was discovered by comparing the Media Hype Index with the Fake News Index. The Covid-19 monitor incorporates something we know from experience, which is that news and real life display reflexivity: the two influence each other in an endless dance. When the news changes it is often a precursor of real world events, and by bringing all our analytics together in a free monitor we have tried to go some way to enabling everybody to share in a valuable font of knowledge. i
If you would like to find out more about RavenPack news analytics or to visit Coronavirus News Monitor then please visit ravenpack.com and follow the prompts.
179