financial outcomes compared to clients with wage income. For example, people without wage income were 57.1% less likely to open bank accounts, 41.3% less likely to make positive improvements in their credit score than those with wage income, 28.7% less likely to reduce debt, and 40.6% less likely to increase their savings than those with wages. When clients without wage income were able to achieve outcomes, they were often related to debt: of these clients, 15% (or 111 clients) achieved 160 outcomes; almost half of the outcomes that they achieved were reducing debt.
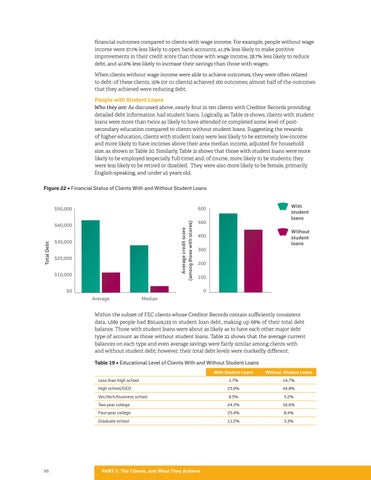
People with Student Loans Who they are: As discussed above, nearly four in ten clients with Creditor Records providing detailed debt information had student loans. Logically, as Table 19 shows, clients with student loans were more than twice as likely to have attended or completed some level of postsecondary education compared to clients without student loans. Suggesting the rewards of higher education, clients with student loans were less likely to be extremely low-income and more likely to have incomes above their area median income, adjusted for household size, as shown in Table 20. Similarly, Table 21 shows that those with student loans were more likely to be employed (especially full-time) and, of course, more likely to be students; they were less likely to be retired or disabled. They were also more likely to be female, primarily English-speaking, and under 45 years old. Figure 22 • Financial Status of Clients With and Without Student Loans
Average credit score (among those with scores)
$40,000
Total Debt
With student loans
600
$50,000
$30,000 $20,000 $10,000
500
Without student loans
400 300 200 100 0
$0
Average
Median
Within the subset of FEC clients whose Creditor Records contain sufficiently consistent data, 1,689 people had $50,419,133 in student loan debt, making up 68% of their total debt balance. Those with student loans were about as likely as to have each other major debt type of account as those without student loans. Table 22 shows that the average current balances on each type and even average savings were fairly similar among clients with and without student debt; however, their total debt levels were markedly different. Table 19 • Educational Level of Clients With and Without Student Loans
96
With Student Loans
Without Student Loans
Less than high school
1.7%
14.7%
High school/GED
25.0%
44.8%
Voc/tech/business school
8.5%
5.2%
Two-year college
24.3%
16.6%
Four-year college
25.4%
8.4%
Graduate school
11.2%
3.3%
PART 2: The Clients, and What They Achieve