

2 Confidential & Proprietary © 2023 CBRE, Inc. • MACRO • OFFICE
• RETAIL
• INDUSTRIAL
MARKET
MARKET
MARKET AGENDA


3 Macro CBRE Vietnam Commercial and Industrial Forum 2023
VIETNAM MACRO UPDATE
Vietnam expects a 5.3% growth in 2023 amidst weak global demand
4 Confidential & Proprietary © 2023 CBRE, Inc.
5.30% 6.20% 0% 2% 4% 6% 8% 10% 2021 2022 2023F 2024F 2021 2022 2023F 2024F 2021 2022 2023F 2024F 2021 2022 2023F 2024F 2021 2022 2023F 2024F 2021 2022 2023F 2024F 2021 2022 2023F 2024F US China Japan South Korea Malaysia Philippines Vietnam 6.2%, the highest in SEA
3.32% 4.14% 5.30% 0% 2% 4% 6% 8% 10% 2013 2014 2015 2016 2017 2018 2019 2020 2021 2022 Q1 2023 Q2 2023 2023F
Source: Worldbank Oxford Economics, CBRE Research, forecast of May 2023.
Key economic indicators are behind


Soft global demand coupled with domestic credit crunch dampened this year's growth

5 Confidential & Proprietary © 2023 CBRE, Inc. VIETNAM MACRO UPDATE
Source + 3.7% GDP - 12.1 % Exports - 7.6% VN Index + 3.29% Consumer Price Index - 18.2% Imports + 0.4% Industrial Production
expectations + 9.3% Retail Sales of Goods -o-y change - 4.3% Foreign Direct Investment
Performance of major assets, H1 2023, % y-o-y change
Performance of Major Assets Appears to be Stabilizing
(*) Rental yield for selected high-end and mid-end condominiums, average of Hanoi and HCMC.

Source: SBV, VNDirect, SJC, VCB, Nymex, World Bank.

Calculated by CBRE Research


6 Confidential & Proprietary © 2023 CBRE, Inc. -33.0% -40% -20% 0% 20% 40% 60% 31/12/2019 31/12/2021 30/6/2023
VIETNAM MACRO UPDATE
4.9% 0% 1% 2% 3% 4% 5% 6% 31/12/2019 31/12/2021 30/6/2023 VN-Index Bank Deposit Rate Condo Rental Yield (*) Local Gold Domestic Petrol (RON95) -7.6% -40% -20% 0% 20% 40% 31/12/2019 31/12/2021 30/6/2023 -3.6% -10% 0% 10% 20% 30% 40% 31/12/2019 31/12/2021 30/6/2023 7.2% 0% 2% 4% 6% 8% 10% 31/12/2019 31/12/2021 30/6/2023
1.6% -2% -1% 0% 1% 2% 3% 4% 31/12/2019 31/12/2021 30/6/2023 USD/VND
The global yield compression cycle has ended
7 Confidential & Proprietary © 2023 CBRE, Inc. VIETNAM MACRO UPDATE
Composite yields by property type, % Top market average in each region, end of period quarterly. 5.19 4.49 2 3 4 5 6 7 8 9 10 11 1990 1991 1992 1993 1994 1995 1996 1997 1998 1999 2000 2001 2002 2003 2004 2005 2006 2007 2008 2009 2010 2011 2012 2013 2014 2015 2016 2017 2018 2019 2020 2021 2022 2023 Global Office Yield Global Retail Yield Global Industrial Yield Source: CBRE Research, Q1 2023.
APAC yield face the least upward pressure
Cap rate is based on stock in each market. The Vietnam cap rate is derived from asking deals in the market. Source: CBRE Research, Q1 2023.
8 Confidential & Proprietary © 2023 CBRE, Inc. VIETNAM MACRO UPDATE
Cap rate by sector, % 2% 4% 6% 8% 10% Office Retail Logistics Vietnam Vietnam Vietnam Vietnam As of Q2 2023 Yield derived from asking deals in the market (range) Office CBD 6.0 - 7.5% Retail - CBD 6.0 - 7.5% Logistics Tier 1 7.0 8.0%
Active Capital Market in Real Estate Sector

Total real estate transaction value of over US$ 460 million completed in H1 2023.
H1 2023 recorded second largest deal transacted during 2022-2023.
Notable transactions in the first half of 2023 with major deals coming from foreign investors
Sector Property / Project Location Seller Buyer Deal value (estimated)
Residential 49% stake in Emeria Thu Duc & Clarita Khang Dien HCMC Khang Dien Group Keppel Land (Singapore) US$ 227 mn
Industrial Land plot in Quang Chau IP Bac Giang Province
SaigonBacgiang Industrial Park Corporation
Hon Hai Precision US$ 63 mn
June 14, 2023
Foxconn acquires more land in Vietnam to add another $100 mln in Vietnam as its efforts to shift more production away from mainland China May 11, 2023
NovaGroup to sell 7% stake in Novaland June 15, 2023
Daewoo subsidiary transfers CMC Creative Space Project to CMC Technology Corporation June 19, 2023

Frasers Property enters into partnership with Gelex Group for expansion of industrial footprint across North Vietnam March 01, 2023


Hospitality
Ibis Saigon South & Capri by Frasers HCMC Strategic Hospitality Holdings Limited

Everland Opportunities IX Limited (Hong Kong) US$ 36 mn

Industrial Land plot in WHA Industrial Zone 1 Nghe An Province WHA Hon Hai Precision US$ 22 mn
Commercial B2CC3 land plot in Starlake township Hanoi T.H.T Development CMC Group (Vietnam) Undisclosed

Source: Q2 2023.
Exclusive: Singapore's CapitaLand in talks to buy Vietnam property assets from Vinhomes March 20, 2023
Keppel Land and Khang Dien Group collaborate on sustainable urban developments Feb 13, 2023
Central Retail poised to acquire big Vietnamese retailers Mar 14, 2023
9 Confidential & Proprietary © 2023 CBRE, Inc.
Persisting challenges in the local corporate bond market


10 Confidential & Proprietary © 2023 CBRE, Inc.
Source: Vietnam Bond Market Association (VBMA), CBRE Research, Q2 2023. Corporate Bond Issuing Value Corporate Bond Issuing Value 5M 2023 30% Consumer goods 57% Real estate 8% Materials 2% Construction 3% Others VND 34,358 billion 5M 2023 Corporate bond issuance : ▼ - 70% y-o-y Of which, Real estate bond issuance : ▼- 48% y-o-y 0 100 200 300 400 500 600 700 800 2019 2020 2021 2022 5M 2023 VND Trillion Real estate Others
The Proposed Amended Land Law

HCMC to remove challenges facing 116 property projects
2022 Feb 2023


MONRE released 1st and 2nd drafts of the Amended Land Law for public consultation, to be ratified during late 2023
Focus
Policy basis (Resolution No. 18/NQ-TW)
Higher taxes for owners of multiple land areas, preventing speculation and abandoning land
11 Confidential & Proprietary © 2023 CBRE, Inc. VIETNAM MACRO UPDATE
land prices based on market prices
Setting
on land auctions
bidding/ tendering
grant land
and project
to
VIETNAM RESIDENTIAL MARKET
Residential Sales Sector Sees New Supply Volume Take a Hit
H1 2023 recorded lowest new launch within the last 5 years.
Increase in high-end units launched this quarter leading to a slight rise in primary price in Q2 2023
Primary prices decreased due to the aggressive sales policy of developers
12 Confidential & Proprietary © 2023 CBRE, Inc. 0 5,000 10,000 15,000 20,000 25,000 H1 H2 H1 H2 H1 H2 H1 H2 H1 2019 2020 2021 2022 2023 Units New launch Sold units New supply Q2 2023 +1,818 units (2 new launches, 7 follow-on launches) 0 5,000 10,000 15,000 20,000 25,000 H1 H2 H1 H2 H1 H2 H1 H2 H1 2019 2020 2021 2022 2023 Units 20 30 40 50 60 70 80 H1 H2 H1 H2 H1 H2 H1 H2 H1 2019 2020 2021 2022 2023 VND mn psm 20 30 40 50 60 70 80 H1 H2 H1 H2 H1 H2 H1 H2 H1 2019 2020 2021 2022 2023 VND mn psm
HANOI CONDO H2 2022 vs H1 2022
▲+7.9% HCMC CONDO Avg.
as of Q2
VND
-5.4% q-o-q +2.4% y-o-y New supply Q2 2023 +1,254 units (3 follow-on launches)
:
primary price
2023
58.2 mn psm
of Q2
VND
psm +1.6% q-o-q +9.5% y-o-y H1 2023 vs H2 2022 ▼-4.5%
Source: CBRE Research, Q2 2023. Avg. primary price as
2023
47.5 mn
VIETNAM RESIDENTIAL MARKET
New launch and sold units in H1 2023 were only one-fifth of what was recorded in H1 2022.
Average secondary price as of Q2 2023 decreased by 13% from its peak in Q3 2022
Lowest new supply over the last 10 years
Average primary price levelled off since its peak in 2022
primary
13 Confidential & Proprietary © 2023 CBRE, Inc. 0 100 200 300 H1 H2 H1 H2 H1 H2 H1 H2 H1 2019 2020 2021 2022 2023 VND mn psm 0 100 200 300 H1 H2 H1 H2 H1 H2 H1 H2 H1 2019 2020 2021 2022 2023 VND mn psm 0 2,000 4,000 6,000 8,000 10,000 12,000 H1 H2 H1 H2 H1 H2 H1 H2 H1 2019 2020 2021 2022 2023 Units New launch Sold units
CBRE Research, Q2 2023. Q3 2022 vs Q3 2021: ▲+29% Q2 2023 vs Q3 2022: ▼-13%
Source:
psm +1% q-o-q +26% y-o-y
Avg.
price as of Q2 2023 VND 252 mn
HANOI LANDED HCMC 0 400 800 1,200 1,600 H1 H2 H1 H2 H1 H2 H1 H2 H1 2019 2020 2021 2022 2023 Units Q1 2022 vs Q2 2023: ▲+84% New supply in Q2 2023 +15 units (1 new launch) New supply in Q2 2023 +152 units (2 new launches)
LANDED
Q2
psm -1.6% q-o-q -12% y-o-y
Avg. secondary price as of
2023 VND 154 mn
VIETNAM MACRO UPDATE to stabilize the market
SBV continuously adjusted interest rates down during H1 2023
Market
Current rates (*) YTD changes Central bank actions and market expectation of rate pauses
Inter - Bank Interest Rate, VNIBOR VND, 2019 - June 2023 (%)
4 rounds of interest cuts since March 2023
Korea (Base rate)
3.50% +25 bps Paused since February
Japan (Key policy rate) -0.10% Flat Kept low rates and yield curve control in May
China (1Y loan prime rate)
3.65% Flat Cut bank reserve ratio in March
Singapore (3M SIBOR) 4.09% -16 bps Halted policy tightening in April
Vietnam (Rediscount rate) 3.00% -150 bps
SBV cut interest rates 4 times in H1 2023
Source: Worldbank, SBV, CBRE Research, forecast of May 2023.
14 Confidential & Proprietary © 2023 CBRE, Inc.
0 1 2 3 4 5 6 7 8 9 1/3/2023 1/23/2023 2/12/2023 3/4/2023 3/24/2023 4/13/2023 5/3/2023 5/23/2023 6/12/2023
VNIBOR
6M
ON 1w 1m 1st time: March 15 0.5 1 % 3rd time: May 25 0.5% 4th time: June 19 0.25 0.5 % 2nd time: April 3 0.5% 0 1 2 3 4 5 6 7 8 9 Jan-19 Jun-19 Nov-19 Apr-20 Sep-20 Feb-21 Jul-21 Dec-21 May-22 Oct-22 Mar-23
Inter - Bank Interest Rate,
VND,
2023 (%)
ON 1w 1m
(*) Vietnam: as of June 2023, other markets: as of May 2023
Commitment in Bettering Infrastructure Across the Country


15 Confidential & Proprietary © 2023 CBRE, Inc. VIETNAM MACRO UPDATE
Nha Trang Cam Lam
Phan Thiet Dau Giay Ben Luc My Thuan Can Tho Trung Luong
Expressway East Completed
completed by 2025
Vinh Hao
North-South
To be
Office Market

16
CBRE Vietnam Commercial and Industrial Forum 2023
VIETNAM OFFICE MARKET
The Big Picture
Net Absorption fell across all regions, but remains positive in APAC Hanoi and HCMC expect no remarkable change in rental levels in 2023
Global Office, Net absorption (million sf), Q1 2023
Change in Grade A net effective rent in 2023F compared to 2019 (pre-pandemic level)
Rents lower than pre-pandemic level
Source: CBRE Research, APAC, Q2 2023
2020-2022
17 Confidential & Proprietary © 2023 CBRE, Inc. -40% -30% -20% -10% 0% 10% 20% 30% Seoul Taipei Hanoi Perth BangaloreORR Singapore Brisbane HCMC Auckland MumbaiBKC Kuala Lumpur GurgaonCore ManilaMakati Guangzhou Bangkok Beijing Shanghai Sydney Melbourne Jakarta Tokyo Shenzhen Hong Kong
2023F
-60 -40 -20 0 20 40 60 80 100 Q1 2016 Q2 2016 Q3 2016 Q4 2016 Q1 2017 Q2 2017 Q3 2017 Q4 2017 Q1 2018 Q2 2018 Q3 2018 Q4 2018 Q1 2019 Q2 2019 Q3 2019 Q4 2019 Q1 2020 Q2 2020 Q3 2020 Q4 2020 Q1 2021 Q2 2021 Q3 2021 Q4 2021 Q1 2022 Q2 2022 Q3 2022 Q4 2022 Q1 2023
US Europe APAC
VIETNAM OFFICE MARKET
Net absorption lags in H1, but expects to improve in H2
OFFICE NET ABSORPTION OFFICE
SUPPLY
Hanoi: 1.7mn sqm, NLA
H1 2023: +57,000 sqm (2 new projects)
HCMC: 1.5mn sqm, NLA
H1 2023: +14,800 sqm (1 new project)
OFFICE PERFORMANCE
Note: The rents in Hanoi does not include TechnoPark Tower Source: CBRE Research, Q2 2023.

18 Confidential & Proprietary © 2023 CBRE, Inc.
(40,000) (20,000)20,000 40,000 60,000 80,000 100,000 120,000 2019 2020 2021 2022 H1 2023 H2 2023F Hanoi - Net Absorption HCMC - Net Absorption Expected Absorption: 70,000 sqm
$29.4 $14.7 0% 10% 20% 30% $$20 $40 $60 2019 2020 2021 2022 Q2 2023 USD/sqm/month $45.4 $25.6 0% 10% 20% 30% $0 $20 $40 $60 2019 2020 2021 2022 Q2 2023 USD/sqm/month Q2 2023 Rental movements Grade A: ▲2.3% y-o-y Grade B: ▲2.7% y-o-y Q2 2023 Rental movements Grade A: ▼ - 1.1% y-o-y Grade B: ▼- 0.8% y-o-y HANOI HCMC
OFFICE MARKET
19 Confidential & Proprietary © 2023 CBRE, Inc.
leasing
HCMC HANOI Notable transactions by Industry Notable transactions by Purpose 0% 20% 40% 60% 80% 100% 2019 2020 2021 2022 H1 2023 Expansion New lease Relocation Renewal Contraction 0% 10% 20% 30% 40% 50% Others Flexible Workspace Manufacturing Life Sciences Information Technology Retail/Trade/E-commerce Professional Services Banking/Finance/Insurance HCMC
CBRE Research, Q2 2023.
Based on CBRE 0% 20% 40% 60% 80% 100% 2019 2020 2021 2022 H1 2023 Expansion New lease Relocation Renewal Contraction 0% 10% 20% 30% 40% Others Pharmaceuticals Securities Banking/Finance/Insurance Manufacturing Flexible Workspace Information Technology
VIETNAM
Expansion continues to be a major theme in Hanoi, while Relocation is the main
purpose in
Source:
Note:
The
20 Confidential & Proprietary © 2023 CBRE, Inc. 22% 19% 12% 8% 6% 6% 6% 22% 25% 45% 44% 48% 33% 33% 0% 10% 20% 30% 40% 50% 60% 0% 5% 10% 15% 20% 25% Shenzhen Guangzhou Shanghai Beijing Hong Kong SAR HCMC Hanoi Leasing space Rental Premium (LHS) Green Building Adoption (RHS)
VIETNAM OFFICE MARKET
Survey on the rental of Grade A Office, APAC Source: CBRE Research, Q2 2023. Rental premium for green certified buildings over uncertified buildings
Green Building Premium: Does It Exist?
Etown 6 The Hallmark The Mett
New Supply (NLA) by 2025 in HCMC CBD: Non-CBD: sqm 174,000 sqm


Source: CBRE Research, Q2 2023. Images are taken from the Internet.

21 Confidential & Proprietary © 2023 CBRE, Inc.
-to-
VIETNAM OFFICE MARKET
becoming the next norm
142,400 OFFICE
UOA Tower 2
CMC Creative Space B
Office Mix-used Green Building WELL Certificate
The Nexus
The Sun Lotus SSG VPBank Saigon
The Waterfront Saigon


Confidential & Proprietary © 2023 CBRE, Inc. VIETNAM OFFICE MARKET CBD -tois becoming the next norm Office Mixed-use Source CBRE Research, Q2 2023. Images are taken from the Internet. New Supply (NLA) by 2025 in Hanoi CBD: Non-CBD: 11,900 sqm 198,500 sqm
Taisei Hanoi Office Diamond Park Plaza OFFICE 27 Ly Thai To Heritage West
Green buildings
Lotte Mall West Lake Hanoi
Lake 36 Cat Linh
How will the market perform?
Note: Asking rents are exclusive of VAT and service charge. Source: CBRE Research, Q2 2023.
23 Confidential & Proprietary © 2023 CBRE, Inc.
VIETNAM OFFICE MARKET
US$/sqm/month Vacancy Rate US$/sqm/month Vacancy Rate 0% 5% 10% 15% 20% 25% 30% $$15 $30 $45 $60 $75 $90 2019 2020 2021 2022 2023F 2024F Grade A - Rent Grade A CBD - Rent Grade B - Rent Grade A - Vacancy rate Grade A CBD - Vacancy rate Grade B - Vacancy rate HANOI HCMC 0% 5% 10% 15% 20% 25% 30% $0 $15 $30 $45 $60 $75 $90 2019 2020 2021 2022 2023F 2024F

24
CBRE Vietnam Commercial and Industrial Forum 2023
Retail Market
Limited new supply helps sustain occupancy
Domestically, retailers pursue expansion cautiously Meanwhile, foreign retailers continue to show interest in the market
25 Confidential & Proprietary © 2023 CBRE, Inc.
RETAIL
VIETNAM
MARKET
Source: CBRE Research, Q2 2023. 0% 4% 8% 12% 16% 20% -120,000 -60,000 0 60,000 120,000 180,000 2019 2020 2021 2022 6M 2023 Vacancy rate Net absorption (sqm) Net absorption - HCMC Net absorption - Hanoi Ave. vacancy rate - HCMC Ave. vacancy rate - Hanoi
2023: 6,630 sqm from 1 new project (Lancaster Luminaire) H1
No new supply
H1
2023:
0 40 80 120 160 200 2015 2016 2017 2018 2019 2020 2021 2022H1 2023 Index of new retail brand entries Vietnam market 2015 is based year (=100) HANOI HCMC200 400 600 800 1,000 1,200 2019 2020 2021 2022 H1 2023 Existing supply - HCMC New supply - HCMC 0 200 400 600 800 1,000 1,200 2019 2020 2021 2022 H1 2023 Existing supply - Hanoi New supply - Hanoi
New Entrants/


New concept


New Entrants, Expansion in H1 2023


Expansion


Potential Entrants & Upcoming Brands


26 Confidential & Proprietary © 2023 CBRE, Inc. Fashion & Accessories Beauty/Healthcare F&B Others
VIETNAM RETAIL MARKET
VIETNAM RETAIL MARKET
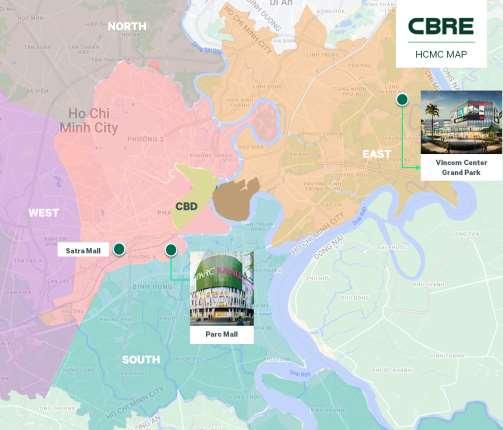
Retail developers and operators show commitment through upcoming major developments


72,000 sqm

32,000
43,000 sqm
40,000
100,000
Shopping Mall in Starlake
NLA: 93,000 sqm (2 phases)


Vietnam's central region in Thua Thien-Hue with a total investment of nearly VND4,000 billion


Source: CBRE Research and developers, Q2 2023. NLA data is estimated and subject to change
Central Retail will Invest US$1.45 billion in Vietnam and double the number of stores to 600 in 57 of Vietnam's 63 provinces. Central Pattana has been scouting for acquisitions in Vietnam.
27 Confidential & Proprietary © 2023 CBRE, Inc.
Lotte Mall West Lake Hanoi NLA:
Lotte Eco Smart City Thu Thiem NLA:
sqm
Mall Management of Tien Bo Plaza NLA:
2023 2026 2026 2025 2023 - 2027 2025 onward
Saigon Centre (P3) NLA:
sqm Empire City Shopping Mall NLA:
sqm
VIETNAM RETAIL MARKET
Asking rents, Retail in CBD
Asking rents, Retail in non CBD
New retail leasing space by 2025
CBD: Non-CBD: 3,300 215,132
HANOI sqm sqm
HCMC
CBD: Non-CBD: 0 sqm 96,000 sqm
Note: Asking rents for ground and first floor, exclusive of VAT and service charge Source:
28 Confidential & Proprietary © 2023 CBRE, Inc.
CBD remains the most sought after with limited available space
0 100 200 300 2020 2021 2022 Q2 2023 US$/sqm/month
rent CBD - Hanoi Asking rent CBD - HCMC 0 10 20 30 40 50 2020 2021 2022 Q2 2023 US$/sqm/month
rent Non CBD - Hanoi Asking rent Non CBD - HCMC
CBRE Research, Q2 2023.
Asking
Asking
How will the market perform?

Note: Asking rents for ground and first floor, exclusive of VAT and service charge
Source: CBRE Research, Q2 2023.
29 Confidential & Proprietary © 2023 CBRE, Inc.
VIETNAM
RETAIL MARKET
US$/sqm/month Vacancy Rate US$/sqm/month Vacancy Rate 0% 4% 8% 12% 16% 20% 0 50 100 150 200 250 2019 2020 2021 2022 2023F 2024F 0% 4% 8% 12% 16% 20%50 100 150 200 250 2019 2020 2021 2022 2023F 2024F HANOI HCMC
Industrial Market
CBRE Vietnam Commercial and Industrial Forum 2023
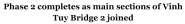
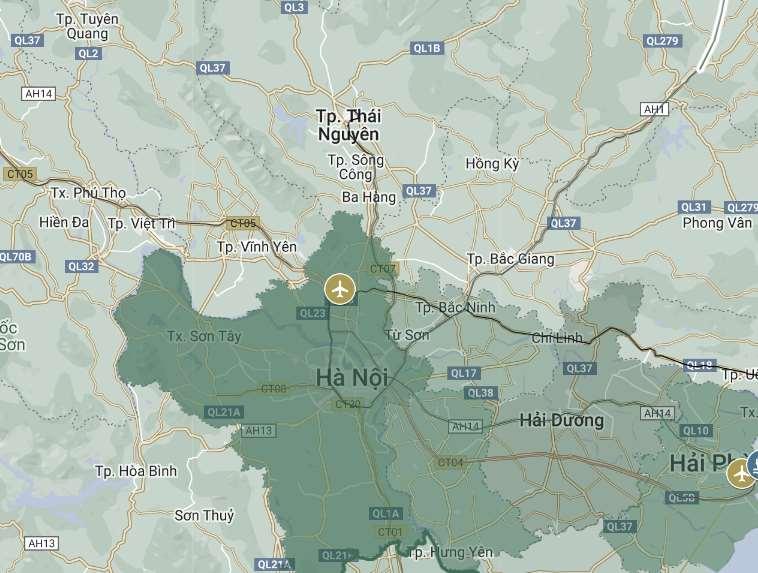
Tier 1 market
North: Hanoi, Hai Phong, Bac Ninh, Hai Duong, Hung Yen
South: HCMC, Dong Nai, Binh Duong, Long An
30
VIETNAM INDUSTRIAL
Exclusive: Chinese energy storage, battery firms consider big investments in Vietnam
June 7, 2023
Chinese automaker BYD to make EVs in Vietnam
May 8, 2023
Goertek licensed to build new electronic factory in northern Vietnam


May 10, 2023
Foxconn leases new site in Vietnam as Apple contractor continues to diversify production away from China Feb 15, 2023

Korean investors to invest $1.5 billion in Haiphong
June 13, 2023
Suntory PepsiCo plans $39 million factory expansion in southern Vietnam
Feb 24, 2023
Foxconn gains projects worth $246 million in Quang Ninh
Jul 01, 2023
Chinese conglomerates express strong interest in expanding investments in Vietnam
June 29, 2023
Top S. Korean chaebols to lead biz delegation for Yoon's Vietnam visit
June 14, 2023

31 Confidential & Proprietary © 2023 CBRE, Inc.
VIETNAM INDUSTRIAL
Industrial Land
Limited supply ready to handover
Source: CBRE Research, Q2 2023
Notes: Include both Tier-1 and Tier-2 markets
North: Tier 1 Hanoi, Hai Phong, Bac Ninh, Hai Duong, Hung Yen
North: Tier 2 Thai Nguyen, Bac Giang, Vinh Phuc, Ha Nam, Quang Ninh
South: Tier 1 HCMC, Dong Nai, Binh Duong, Long An
South: Tier 2 Tay Ninh, Binh Phuoc, BR-VT, Binh Thuan
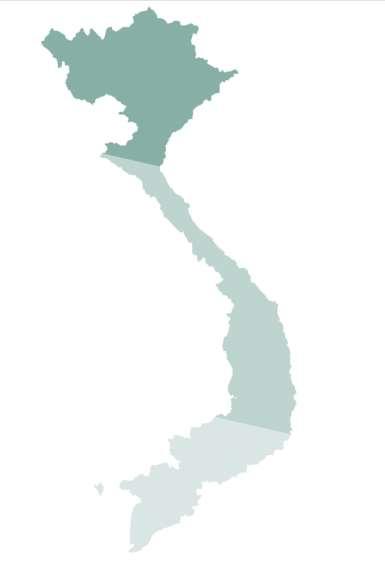
North South
NORTH Q2 2023
• Accumulated supply: 19,522 ha
• Est. available land ready to handover in H2 2023: 500 600 ha
SOUTH Q2 2023
• Accumulated supply: 32,664 ha
• Est. available land ready to handover in H2 2023: ~3,000 ha
• But only 15% with good connectivity, including
✓ Tier-1: ~400 ha
✓ Tier-2: ~200 ha
32 Confidential & Proprietary © 2023 CBRE, Inc.
Hoang Sa archipelago
Truong Sa archipelago
Industrial land: Healthy absorption across North, South
33 Confidential & Proprietary © 2023 CBRE, Inc.
VIETNAM INDUSTRIAL 40% 60% 80% 100%400 800 1,200 2019 2020 2021 2022 H1 2023 Occupancy rate Net absorption (ha) Net absorption Occupancy rates Industrial Land, Net absorption and Occupancy rates NORTH SOUTH 40% 60% 80% 100% 0 400 800 1,200 2019 2020 2021 2022 H1 2023 Occupancy rate Net absorption (ha) • H1 2023 = 1.6 x H1 2022 • Average net absorption (2019 - H2 2023): 118 ha/quarter
CBRE
2023 • H1 2023 = 1.2 x H1 2022 • Average net absorption (2019 - H2 2023): 230 ha/quarter
Source:
Research, Q2
34 Confidential & Proprietary © 2023 CBRE, Inc. 50 100 150 200 250 300 Bac Ninh Hai Phong Hung Yen Hai Duong Binh Duong Dong Nai Long An USD/sqm/ remaining terms Min Rent Max Rent 50 100 150 200 250 300 2019 2020 2021 2022 Q2 2023 US$/sqm/ remaining terms Tier 1 - North Tier 1 - South Industrial land: Robust growth of land rentals, especially in the South VIETNAM INDUSTRIAL Industrial Land, Primary Price Source: CBRE Research, Q2 2023 NORTH US$ 127/sqm/remaining terms CAGR (2019 Q2 2023): 7% SOUTH US$ 187/sqm/remaining terms CAGR (2019 Q2 2023): 13% NORTH SOUTH
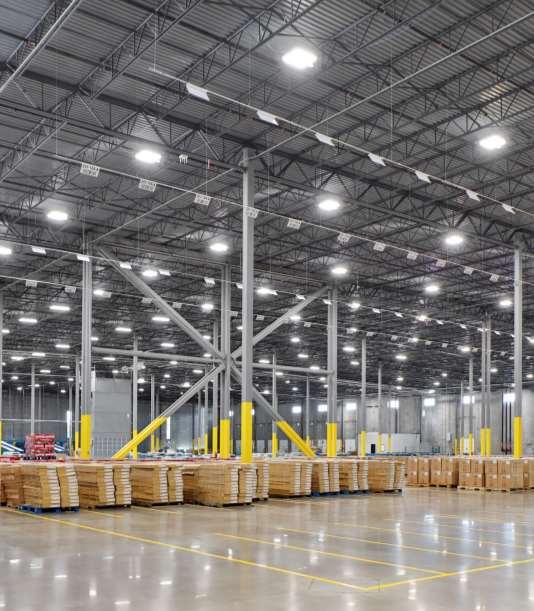
35 Confidential & Proprietary © 2023 CBRE, Inc. 0% 25% 50% 75% 100% 0 200 400 600 800 2019 2020 2021 2022 H1 2023 ‘000 sqm RBF - Net absorption RBW - Net absorption RBF - Occupancy rates RBW - Occupancy rates VIETNAM INDUSTRIAL Ready-built Warehouse (RBW) and Factory (RBF), Net absorption and Occupancy rates NORTH SOUTH RBF/RBW: Strong absorption thanks to the expansion of Chinese manufacturers, especially in the North (*) Excluding service warehouse Source: CBRE Research, Q2 2023 0% 25% 50% 75% 100%200 400 600 800 2019 2020 2021 2022 H1 2023 ‘000 sqm H1 2023: ~ 250,000 sqm H1 2023: ~ 320,000 sqm
RBF/RBW: Supply growth is at the peak, expects
down by 2024
36 Confidential & Proprietary © 2023 CBRE, Inc.
to
INDUSTRIAL RBF/RBW, New Supply RBF RBW (*) Accumulated supply 1.2 mn sqm 2.1 mn sqm RBF RBW (*) 1.7 mn sqm 3.9 mn sqm (*) Excluding service warehouses Source: CBRE Research, Q2 2023 0 200 400 600 800 1,000 2019 2020 2021 2022 H1 2023200 400 600 800 1,000 2019 2020 2021 2022 H1 2023 '000 sqm RBF - New supply RBW(*) - New supply NORTH SOUTH CAGR (2019 Q2 2023) 23% 22% 18% 49%
slow
VIETNAM
Stronger
demand
from

Chinese tenants after show interest

37 Confidential & Proprietary © 2023 CBRE, Inc.
VIETNAM INDUSTRIAL 33% 17% 15% 10% 10% 7% 8% China EU Vietnam US Hong Kong Taiwan Others Northern Region 9% 19% 20% Southern Region Source: CBRE Research, 2023 16% 12% 12% 10% 10% 8% 6% 6% 20% US China Japan Vietnam Germany Singapore Hong Kong Korea Others 17% 5% 2% 29% Vs. 2022
Major Transactions
38 Confidential & Proprietary © 2023 CBRE, Inc.
VIETNAM INDUSTRIAL Province/ City Nationality Industry Type Size Bac Ninh China Electronics Industrial land 62.7ha Nghe An China Electronics Industrial land 48.0ha Bac Giang Taiwan Electronics Industrial land 45.0ha Hai Duong China Electronics Industrial land 22.6ha Nam Dinh Taiwan Electronics Industrial land 22.5ha Thai Nguyen China Flooring RBF 37,000 sqm Hai Phong China Plastics/ Flooring RBF 35,000 sqm Ha Nam China Electronics RBF 28,000 sqm Thai Nguyen China Flooring RBF 18,000 sqm Hai Phong China Electronics RBF 14,000 sqm Bac Ninh China E-Bike RBF 13,000 sqm Bac Ninh Singapore E-commerce RBW 60,000 sqm Hai Phong Vietnam Automobile RBW 20,000 sqm Bac Ninh Vietnam Pharma RBW 10,000 sqm Bac Ninh Japan 3PL RBW 10,000 sqm Province/ City Nationality Industry Type Size Binh Phuoc China Automotive components Industrial land 46.0 ha Long An Vietnam Garment Industrial land 36.0 ha BR-VT Japan Chemical Industrial land 15.0 ha BR-VT Germany Packaging Industrial land 10.0 ha BR-VT Japan Semiconductor Industrial land 5.0 ha Long An Korea Pharmaceutical RBF 10,000 sqm Binh Duong China Magnetic components RBF 6,000 sqm Dong Nai China Electronics RBF 5,000 sqm Dong Nai Hong Kong Garment RBF 3,000 sqm Long An Vietnam Logistics RBW 30,000 sqm HCMC Vietnam Logistics RBW 26,000 sqm Long An Vietnam Manufacturers RBW 13,000 sqm Binh Duong Vietnam Retail RBW 12,700 sqm Binh Duong France 3PL RBW 6,000 sqm Binh Duong Taiwan Garment RBW 4,000 sqm
NORTH & CENTRAL SOUTH
VIETNAM INDUSTRIAL RBF/RBW, New Supply and Asking rents
RBF/RBW:
strong competition
(*) Excluding service warehouse
Source: CBRE Research, Q2 2023
RBF - New supply RBW (*) - New supply RBF - Rents RBW (*) - Rents
39 Confidential & Proprietary © 2023 CBRE, Inc.
Rental growth is driven by newer facilities, but limited by
CAGR (2019 Q2 2023) RBF RBW (*) 3.0% 2.3% RBF RBW (*) 2.5% 3.1% 0 1 2 3 4 5 6 0 200 400 600 800 1,000 1,200 2019 2020 2021 2022 H1 2023 Rents (US$/sqm/month) New Supply
0 1 2 3 4 5 6200 400 600 800 1,000 1,200 2019 2020 2021 2022 H1 2023 Rents (US$/sqm/month) New supply('000 sqm) NORTH SOUTH
Selected LEED certified and registered industrial projects. Source: GBIG

Emergent Cold (Bac Ninh)

FM Logistics (Bac Ninh)

Tetra Pak (Binh Duong)
BWID Phu Nghia (Hanoi)
Lego breaks ground on $1bn carbonneutral factory in Vietnam
Source: Nikkei Asia
SLP Yen Phong (Bac Ninh)
CP Paper (HCMC)
Eco Logistics Centre (Binh Duong)
Core5 (Hai Phong)
Logos (Bac Ninh)
Horizon Park (Bac Ninh)
Phu Tan IP - RBW (Binh Duong)
Xuyen A IP RBW (Long An)

Vinamilk Announces "Pathways to Dairy Net Zero 2050" and the First Carbon-Neutral Factory and Farm in Vietnam
Source: VnEconomy

Sembcorp Deepens Strategic Partnership with Becamex
The two sides will co-establish five Vietnam Singapore
Industrial Parks (VSIPs) in Vietnam valued at approximately US$1 billion. Featuring decarbonization solutions such as rooftop solar systems, solar farms (where feasible), and green-certified buildings, the VSIPs are envisioned to be smart and sustainable industrial parks with low carbon footprints.

Confidential & Proprietary © 2023 CBRE, Inc. 40
Sustainability is set to become a mandatory trend among industrial developers and logistics operators
Source CBRE Research, 2023. Images are taken from the Internet.
VIETNAM
Forecast: Rental growth expects to remain positive, but will slow down across industrial asset types
41 Confidential & Proprietary © 2023 CBRE, Inc.
INDUSTRIAL
: CBRE Research, Q2 2023 RBF/RBW, Accumulated supply and Rental rates 0 100 200 30010,000 20,000 30,000 2021 2022 2023F 2024F US$/sqm/ remaining term Industrial land (ha) Tier 1 - Accumulated Supply Tier 1 - Average asking rents 0 1 2 3 4 5 6 0 1 2 3 4 5 6 2021 2022 2023F 2024F US$/sqm/month Milion sqm RBF - Accumulated supply RBW - Accumulated supply RBF - Rents RBW - Rents 0 100 200 300 0 10,000 20,000 30,000 2021 2022 2023F 2024F US$/sqm/ remaining term Industrial land (ha) Industrial Land, Accumulated supply and Rental rates 0 1 2 3 4 5 6 0 1 2 3 4 5 6 2021 2022 2023F 2024F US$/sqm/month Million sqm NORTH SOUTH NORTH SOUTH Accumulated Supply Average asking rents
Source
Taking the long view
42
CBRE Vietnam Commercial and Industrial Forum 2023


43 Confidential & Proprietary © 2023 CBRE, Inc. Indicators 6 month change YTD 6 month outlook 12 month outlook Supply ▲1-4% ▲ ▲ Rent ▼1 - 2% ▼ ▼ Absorption ▼95-125% ▲ ▲ Capital Value ▼ ▼ ▶ Supply ▲1-3% ▲ ▲ Rent ▲7-8% ▶ ▶ Absorption Flat ▶ ▲ Capital Value ▼ ▼ ▶ Supply ▲2 - 3% ▲ ▲ Rent ▲6 - 7% ▶ ▲ Absorption ▲ 20% 60% ▶ ▲ Supply ▲16 - 20% ▲ ▲ Rent Flat ▶ ▲ Absorption Flat ▶ ▲ Capital Value ▼ ▶ ▲
Source: CBRE Research, Q2 2023 6-month change: compare H1 2023 to H2 2022 | 6-month outlook: forecast change of H2 2023 to H1 2023 | 12-month outlook: forecast change of H1 2024 to H1 2023 OFFICE RETAIL INDUSTRIAL LAND RBW/RBF
Where are we heading?
CBRE COMMERCIAL AND INDUSTRIAL FORUM
Key Takeaways
OFFICE: GROWTH FUNDAMENTALS REMAIN SOLID
Office occupancy may fluctuate in the short term due to cyclical reasons and strong supply growth, but not structural reasons. Tenants' contraction, if any, is only temporary, as growth fundamentals remain solid.
INDUSTRIAL SECTOR TO SEE FURTHER GROWTH
Industrial properties will continue to attract attention, especially as Vietnam moves up the supply chain. Rents will continue to grow, albeit slower, as competition becomes more intensive.
RETAIL REAL ESTATE BENEFITING FROM LIMITED NEW SUPPLY
Retail space in the CBD will continue to enjoy tight vacancy, while rental growth will slow down after two years surge. Meanwhile, retailers still favour welldesigned spaces operated by professional developers in non-CBD.
ESG FEATURES: FUTURE-PROOFING PROPERTIES OF ANY TYPE
More investment will be required as ESG becomes the norm a critical approach proven in major markets to future-proof properties of any type.
FOREIGN INVESTORS ARE HERE TO STAY
Foreign investors are here to stay, especially while many local firms seek funding and portfolio restructuring.
44 Confidential & Proprietary © 2023 CBRE, Inc.
01. 02. 03. 04.
05.
Thank You
For more information regarding this presentation please contact: CBRE Vietnam Co.,
T: +84 28 3824 6125 | +84 24 6288 6379
Disclaimer All materials presented in this report, unless specifically indicated otherwise, is under copyright and proprietary to CBRE Information contained herein, including projections, has been obtained from materials and sources believed to be reliable at the date of publication While we do not doubt its accuracy, we have not verified it and make no guarantee, warranty or representation about it Readers are responsible for independently assessing the relevance, accuracy, completeness and currency of the information of this publication This report is presented for information purposes only, exclusively for CBRE clients and professionals, and is not to be used or considered as an offer or the solicitation of an offer to sell or buy or subscribe for securities or other financial instruments All rights to the material are reserved and none of the material, nor its content, nor any copy of it, may be altered in any way, transmitted to, copied or distributed to any other party without prior express written permission of CBRE Any unauthorised publication or redistribution of CBRE research reports is prohibited. CBRE will not be liable for any loss, damage, cost or expense incurred or arising by reason of any person using or relying on information in this publication.
45 Confidential & Proprietary © 2023 CBRE, Inc.
Ltd. Research & Consulting
E: research.Vietnam@cbre.com

