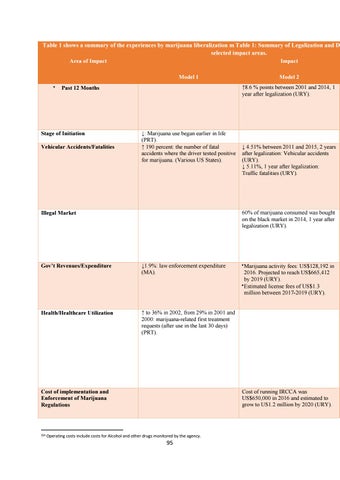
Table 1 shows a summary of the experiences by marijuana liberalization m Table 1: Summary of Legalization and D selected impact areas. Area of Impact
Impact Model 1
↑8.6 % points between 2001 and 2014, 1 year after legalization (URY).
Past 12 Months
Stage of Initiation Vehicular Accidents/Fatalities
↓: Marijuana use began earlier in life (PRT). ↑ 190 percent: the number of fatal accidents where the driver tested positive for marijuana. (Various US States).
↓ 4.51% between 2011 and 2015, 2 years after legalization: Vehicular accidents (URY). ↓ 5.11%, 1 year after legalization: Traffic fatalities (URY).
60% of marijuana consumed was bought on the black market in 2014, 1 year after legalization (URY).
Illegal Market
Gov’t Revenues/Expenditure
↓1.9%: law enforcement expenditure (MA).
Health/Healthcare Utilization
↑ to 36% in 2002, from 29% in 2001 and 2000: marijuana-related first treatment requests (after use in the last 30 days) (PRT).
Marijuana activity fees: US$128,192 in 2016. Projected to reach US$665,412 by 2019 (URY). Estimated license fees of US$1.3 million between 2017-2019 (URY).
Cost of running IRCCA was US$650,000 in 2016 and estimated to grow to US1.2 million by 2020 (URY).
Cost of implementation and Enforcement of Marijuana Regulations
254
Model 2
Operating costs include costs for Alcohol and other drugs monitored by the agency.
95