amounted to US$34 million, US$42 million in 2016 and 2017 respectively, this represents 18% and 13% of the total marijuana revenues collected in 2016 and 2017 respectively [39]. 6. Summary of Legalization and Decriminalization Experiences
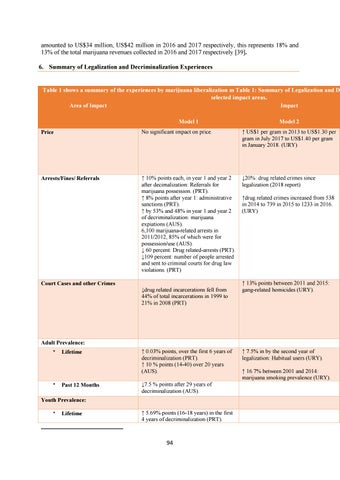
Table 1 shows a summary of the experiences by marijuana liberalization m Table 1: Summary of Legalization and D selected impact areas. Area of Impact
Impact Model 1
Model 2
Price
No significant impact on price.
↑ US$1 per gram in 2013 to US$1.30 per gram in July 2017 to US$1.40 per gram in January 2018. (URY)
Arrests/Fines/ Referrals
↑ 10% points each, in year 1 and year 2 after decimalization: Referrals for marijuana possession. (PRT). ↑ 8% points after year 1: administrative sanctions (PRT). ↑ by 53% and 48% in year 1 and year 2 of decriminalization: marijuana expiations (AUS). 6,100 marijuana-related arrests in 2011/2012, 85% of which were for possession/use (AUS). ↓ 60 percent: Drug related-arrests (PRT). ↓109 percent: number of people arrested and sent to criminal courts for drug law violations. (PRT)
↓20%: drug related crimes since legalization (2018 report)
Court Cases and other Crimes ↓drug related incarcerations fell from 44% of total incarcerations in 1999 to 21% in 2008 (PRT)
↑drug related crimes increased from 538 in 2014 to 739 in 2015 to 1233 in 2016. (URY)
↑ 13% points between 2011 and 2015: gang-related homicides (URY).
Adult Prevalence:
Lifetime
Past 12 Months
↑ 0.03% points, over the first 6 years of decriminalization (PRT). ↑ 10 % points (14-40) over 20 years (AUS). ↓7.5 % points after 29 years of decriminalization (AUS).
Youth Prevalence:
Lifetime
↑ 5.69% points (16-18 years) in the first 4 years of decriminalization (PRT).
94
↑ 7.5% in by the second year of legalization: Habitual users (URY). ↑ 16.7% between 2001 and 2014: marijuana smoking prevalence (URY).