4
01. theCentral Cape Town TheIntroducing State of the CityCentral ReportCity 2014
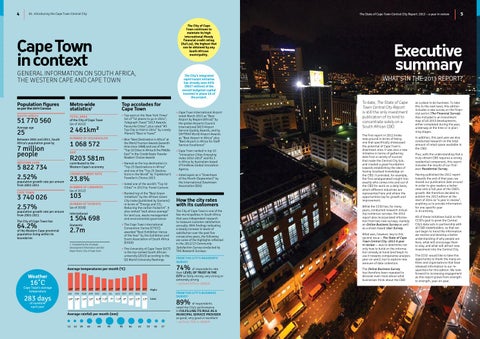
The State of Cape Town Central City Report: 2013 – a year in review The City of Cape Town continues to maintain its high international Moody financial credit rating (Aa3.za), the highest that can be obtained by any South African municipality.
Cape Town in context General Information ON SOUTH AFRICA, The Western Cape and Cape Town
Population figures as per the 2011 Census
Metro-wide statistics1
South Africa
Total area
51 770 560
Top accolades for Cape Town + Top spot on the New York Times’ list of “52 places to go in 2014”; Telegraph Travel “2013 Awards: Favourite Cities”; plus rated “#3 Top City to Visit in 2014” by Lonely Planet’s “Best in Travel”
of the City of Cape Town (as of 2012)
Average age
2 461km²
Between 2001 and 2011, South Africa’s population grew by
Number of households
25
7 million people Western Cape
+W on “Best Destination in Africa” at the World Tourism Awards (seventh time since 1998) and one of the “Top 10 Cities in Africa & the Middle East” in the Condé Naste Traveler Readers’ Choice Awards
1 068 572 GDP
R203 581m contributed to the
+ Named as the top destination in “Top 25 Destinations in Africa” and one of the “Top 25 Destinations in the World” by TripAdvisor’s Traveller’s Choice 2013
Western Cape’s economy 5 822 734 2.52% 23.8% population growth rate per annum Unemployment Rate
from 2001-2011 Cape Town
+ Voted one of the world’s “Top 10 Cities” in 2013 by Travel+Leisure
Number of libraries
(as of 2012)
103 3 740 026 (as of 2010) 2.57% population growth rate per annum
+ Ranked top of the “Best Green Initiatives” by the African Green City Index (published by Siemens) in terms of “Energy and CO2: Reducing the carbon footprint”. It also ranked “well above average” for land use, waste management and environmental governance
Number of tourists
from 2001-2011
The City of Cape Town has
64.2% of the Western Cape provincial population living within its boundaries
The City’s integrated rapid transit initiative has already seen 92% (R827 million) of the overall budgeted capital invested in phase 1A of the project.
International
1 504 698
+ The Cape Town International Convention Centre (CTICC) awarded “Best Exhibition Venue of the Year” by the Exhibition and Event Association of South Africa (EXSA)
Domestic
2.7m 1. Compiled by the Strategic Development Information and GIS Department, City of Cape Town
+ The University of Cape Town (UCT) is the top-ranked South African university (2013) according to the QS World University Rankings
Weather
+ Voted again as a “Downtown of the Month (September)” by the International Downtown Association (IDA)
How the city rates with its customers The City of Cape Town is one of the few municipalities in South Africa that uses independent research to measure customer satisfaction annually. With findings indicating a steady increase in levels of satisfaction over the past five consecutive years, the following are some of the highlights reflected in the 2012/13 Community Satisfaction Survey conducted by TNS Research Surveys: From the CITY’s Residents’ Survey
City as fairly strong, very strong or extremely strong – up from 61% in 2008/9
16˚C
283 days of sunshine
+ Cape Town ranked in top 10 “Innovation Cities Emerging Index 2012-2013” and No 1 in Africa by Australian-based 2ThinkNow Global Innovation Agency
74% of respondents rate their Level of trust in the
Average temperatures per month (°C)
Cape Town’s average temperature
+ Cape Town International Airport voted March 2013 as “Best Airport by Region (Africa)” by the global Airports Council International (ACI) Airport Service Quality Awards, and by SKYTRAX World Airport Awards as “Best Airport in Africa” plus “Best Airport in Africa for Staff Service Excellence”
26° 27° 25° 23° 20° Jan
Feb
16° 16°
Mar Apr May
14° 12°
18° 17° 18° 19° 21° 23° 25° Jun Jul
9,5° 7,5°
7°
Aug Sep
Oct Nov Dec
7,5° 9°
11° 13°
15°
Highs
From the CITY’S Business Survey
Lows
89% of respondents rated the City’s performance
each year
in Fulfilling Its Role as a Municipal Service Provider as good, very good or excellent – up from 75% in 2008/9
Average rainfall per month (mm) 11
12
19
46
66
95
93
64
43
33
16
17
5
Executive summary what’s in the 2013 report?
To date, The State of Cape Town Central City Report is still the only investment publication of its kind to concentrate solely on a South African CBD. The first report in 2012 broke new ground in terms of being one that specifically showcased the potential of Cape Town’s downtown area. It was also a new initiative in terms of gathering data from a variety of sources that make the Central City tick, and created a great foundation towards establishing the idea of having localised knowledge on the CBD. It provided, for example, the first amalgamated insight into exactly who comes into and out of the CBD for work on a daily basis, which different industries are represented here and where the opportunities lay for growth and improvement. While the CCID has, for many years, conducted research including numerous surveys, the 2012 report also incorporated information from two new surveys, namely: an Online Business Survey as well as a street-based User Survey. What was, however, key to this second issue – The State of Cape Town Central City: 2013 A year in review — was to determine not only how to build on the information already at hand (and begin to use it towards comparative analysis year-on-year), but to explore new avenues of data collection. The Online Business Survey has therefore been repeated to discover even more about what businesses think about the CBD
as a place to do business. To take this to the next level, this edition includes a new survey on the financial sector (The Financial Survey). Also included is an investment map of all 2013 developments, either completed during the year, underway at the time or in planning stages. In addition, this past year we also conducted research on the total amount of retail space available in the CBD. Plus, with the understanding that a truly vibrant CBD requires a strong residential component, this report includes the results of our firstever Residential Survey. Having published the 2012 report towards the end of that year, we moved our publication date around in order to give readers a better view onto a full year of the CBD’s growth. We therefore decided to publish the 2013 edition at the start of 2014 as “a year in review”, enabling us to provide information for one specific year in its entirety. All of these initiatives build on the CCID’s goal to grow the Central City’s data sets in partnership with all CBD stakeholders, so that we can begin to trend the information we receive and develop a better understanding of why people are here, what will encourage them to stay, and what will attract new investment into the Central City. The CCID would like to take this opportunity to thank the many entities and organisations that have released information to our researchers for this edition. We look forward to increasing engagement as this report grows from strength to strength, year-on-year.