ESSENTIAL MATHEMATICS FOR THE WA CURRICULUM Chapter 8 Statistics and probability
8D Column graphs and dot plots LEARNING INTENTIONS • To understand that graphs should include titles and labelled axes, with any numerical values drawn to scale • To know what an outlier is • To be able to construct and interpret a column graph • To be able to construct and interpret a dot plot
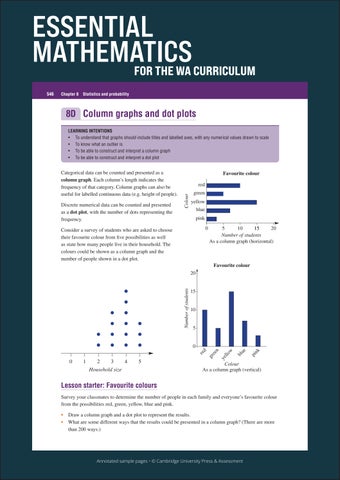
Discrete numerical data can be counted and presented as a dot plot, with the number of dots representing the frequency.
Favourite colour red Colour
Categorical data can be counted and presented as a column graph. Each column’s length indicates the frequency of that category. Column graphs can also be useful for labelled continuous data (e.g. height of people).
green yellow blue pink 0
Consider a survey of students who are asked to choose their favourite colour from five possibilities as well as state how many people live in their household. The colours could be shown as a column graph and the number of people shown in a dot plot.
5 10 15 20 Number of students As a column graph (horizontal)
Favourite colour 20 Number of students
15 10 5
0
1
2 3 4 Household size
5
pi nk
bl ue
n
w llo ye
gr
ee
d
0 re
546
Colour As a column graph (vertical)
Lesson starter: Favourite colours Survey your classmates to determine the number of people in each family and everyone’s favourite colour from the possibilities red, green, yellow, blue and pink. • •
Draw a column graph and a dot plot to represent the results. What are some different ways that the results could be presented in a column graph? (There are more than 200 ways.)
Annotated sample pages • © Cambridge University Press & Assessment