12.0mm
12.0mm
12.0mm
Research
19.0mm
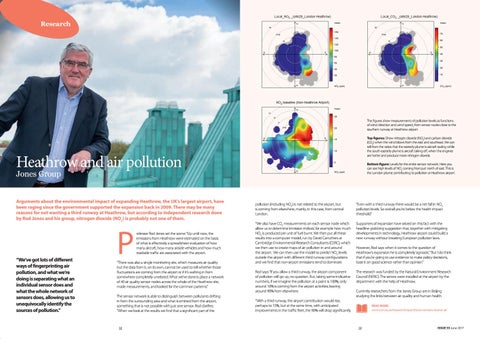
The figures show measurements of pollution levels as functions of wind direction and wind speed, from sensor nodes close to the southern runway at Heathrow airport.
4.03mm
Bottom figure: Levels for the entire sensor network. Here you can see high levels of NO2 coming from just north of east. This is the London plume contributing to pollution at Heathrow airport.
210.0 x 297.0mm
Jones Group
4.7mm Arguments about the environmental impact of expanding Heathrow, the UK’s largest airport, have been raging since the government supported the expansion back in 2009. There may be many reasons for not wanting a third runway at Heathrow, but according to independent research done by Rod Jones and his group, nitrogen dioxide (NO2) is probably not one of them.
12.0mm
“We’ve got lots of different ways of fingerprinting air pollution, and what we’re doing is separating what an individual sensor does and what the whole network of sensors does, allowing us to unequivocally identify the sources of pollution.”
P
rofessor Rod Jones set the scene: “Up until now, the emissions from Heathrow were estimated on the basis of what is effectively a spreadsheet evaluation of how many aircraft, how many airside vehicles and how much roadside traffic are associated with the airport.
“There was also a single monitoring site, which measures air quality but the data from it, on its own, cannot be used to tell whether those fluctuations are coming from the airport or if it’s wafting in from somewhere completely unrelated. What we’ve done is place a network of 40 air quality sensor nodes across the whole of the Heathrow site, made measurements, and looked for the common patterns.” The sensor network is able to distinguish between pollutants drifting in from the surrounding area and what is emitted from the airport, something that is not possible with just one sensor. Rod clarifies: “When we look at the results we find that a significant part of the
18
2.35mm
pollution (including NO2) is not related to the airport, but is coming from elsewhere, mainly, in this case, from central London.
“Even with a third runway there would be a net fall in NO2 pollution levels. So overall you’re below the health impact threshold.”
“We also have CO2 measurements on each sensor node which allow us to determine ‘emission indices’, for example how much NO2 is produced per unit of fuel burnt. We then put all these results into a computer model, run by David Carruthers at Cambridge Environmental Research Consultants (CERC), which we then use to create maps of air pollution in and around the airport. We can then use the model to predict NO2 levels outside the airport with different third runway configurations and we find that non-airport emissions tend to dominate.
Supporters of expansion have seized on this fact with the headline grabbing suggestion that, together with mitigating developments in technology, Heathrow airport could build a new runway without breaking European pollution laws.
Rod says: “If you allow a third runway, the airport component of pollution will go up, no question. But, taking some indicative numbers, if we imagine the pollution at a point is 100%, only around 10% is coming from the airport activities; leaving around 90% from elsewhere.
The research was funded by the Natural Environment Research Council (NERC). The senors were installed at the airport by the department with the help of Heathrow.
However, Rod says when it comes to the question of Heathrow’s expansion he is completely ‘agnostic’. “But I do think that if you’re going to use evidence to make policy decisions, base it on good science rather than opinion.”
Currently researchers from the Jones Group are in Beijing studying the links between air quality and human health.
“With a third runway, the airport contribution would rise, perhaps to 15%, but at the same time, with anticipated improvements in the traffic fleet, the 90% will drop significantly.
12.0mm
2.02mm
Heathrow and air pollution 210.0 x 297.0mm
Top figures: Show nitrogen dioxide (NO2) and carbon dioxide (CO2) when the wind blows from the east and southeast. We can tell from the ratios that the easterly plume is aircraft taxiing while the south easterly plume is aircraft taking off, when the engines are hotter and produce more nitrogen dioxide.
READ MORE: www.cam.ac.uk/research/impact/better-sensors-cleaner-air
19
ISSUE 55 June 2017