$200M
GROW
500
1500
COLOR KEY:
Jan December Feb Mar Apr May June July Aug Sept Oct Nov Dec
December
Data not released at time of print
August
August
2021
July
July
BY THE NUMBERS
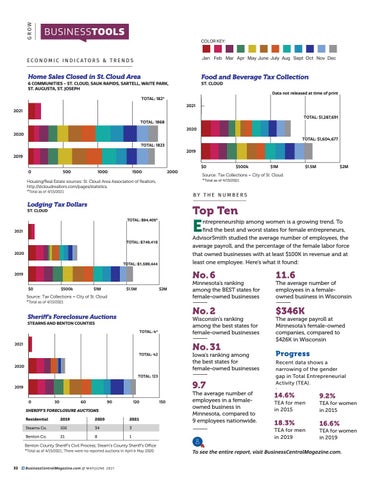
Top Ten
E
TOTAL: $1,599,444
–––––-
TOTAL: $1,604,677
2000
$2000000
No. 2
STEARNS AND BENTON COUNTIES
$0
$500k
TOTAL: 4* $1.5M
$1M
April
$2M
2020
2021
Stearns Co.
102
34
3
Benton Co.
21
8
1
Benton County Sheriff’s Civil Process; Stearn’s County Sheriff’s Office *Total as of 4/15/2021; There were no reported auctions in April & May 2020.
BusinessCentral Magazine.com // M AY/ J U N E 2 0 2 1
December
Residential 2019
November
SHERIFF’S FORECLOSURE AUCTIONS
150
October
120
September
90
August
60
Progress
July
30
June
0
May
9.7
2019
April
–––––-
TOTAL: 123
March
January
December
November
October
September
August
July
June
May
April
March
February
January
2020
February
Iowa’s ranking among the best states for female-owned businesses
–––––-
The average payroll at Minnesota’s female-owned companies, compared to $426K in Wisconsin
No. 31
TOTAL: 42
The average number of employees in a femaleowned business in Wisconsin
$346K
March
Wisconsin’s ranking February among the best states for January female-owned businesses –––––-
2021
11.6 TOTAL: 182*
$2M
Sheriff’s Foreclosure Auctions
2019
TOTAL: 1868
June
Minnesota’s ranking among the May BEST states for female-owned businesses
TOTAL: $1,287,691
2020 Source: Tax Collections – City of St. Cloud
*Total as of 4/15/2021
July
No. 6
$1.5M
$2M
December ntrepreneurship among women is a growing trend. To find November the best and worst states for female entrepreneurs, AdvisorSmith October studied the average number of employees, the average payroll, and the percentage of the female labor force September that owned businesses with at least $100K in revenue and at least oneAugust employee. Here’s what it found:
TOTAL: 1823
$1M
$1.5M
Source: Tax Collections – City of St. Cloud *Total as of 4/15/2021
1500
TOTAL: $1,287,691
TOTAL: $1,604,677
$1500000
$500k
$1M
1000
Data not released at time of print
$1000000
$0
$500k
January
Home Sales Closed in St. Cloud Area
2000
6 COMMUNITIES - ST. CLOUD, SAUK RAPIDS, SARTELL, WAITE PARK, ST. AUGUSTA, ST. JOSEPH
1500
Data not released at time of print
2019
2021
$0
TOTAL: $749,418 Food and Beverage Tax Collection
ST. CLOUD
March February
Feb
TOTAL: $94,405*
2021
TOTAL: $1,604,677
500
ST. CLOUD
0
$500000
Food and Beverage Tax Collection
ST. CLOUD
1000
2019
Mar
Jan $150M $200M Housing/Real Estate sources: St. Cloud Area Association of Realtors, http://stcloudrealtors.com/pages/statistics. *Total as of 4/15/2021
2021
2020
April
Lodging Tax Dollars
2020
2019
2021
2020
2019
$0
$100M
May
TOTAL: 1823
Apr
TOTAL: $178,724,272
500
2020
May
2019
0
TOTAL: $1,287,691
June
TOTAL: 1868
June
December
TOTAL: 182*
November
September
TOTAL: $137,532,948
October
September
ST. CLOUD
September
TOTAL: $12,581,424*
August
Food and Beverage Tax Collection October
ST. AUGUSTA, ST. JOSEPH UD, SAUK RAPIDS, SARTELL, WAITE PARK,
2021
July
June
November
May
April
March
February
January
December
November
October
September
August
July
June
May
Apr
Mar
Feb
Jan
November
Home Sales Closed in St. Cloud Area ing Permits 6 COMMUNITIES - ST. CLOUD, SAUK RAPIDS, SARTELL, October WAITE PARK,
2020
2000
BUSINESSTOOLS
ECO N O M I C I N D I C ATO R S & T R E N D S
32
1000
E PARK,
0
16,523*
January
621,465
885,721
$80M
$80M
$70M
E PARK,
$60M
1,424*
$50M
32,948
24,272
$40M
Recent data shows a narrowing of the gender gap in Total Entrepreneurial Activity (TEA). .
The average number of employees in a femaleowned business in Minnesota, compared to 9 employees nationwide.
14.6%
–––––-
TEA for men in 2019
TEA for men in 2015
18.3%
9.2% TEA for women in 2015
16.6% TEA for women in 2019
To see the entire report, visit BusinessCentralMagazine.com.