
4 minute read
TRAYCO, INC.


time. For example, the line levels off at 750,000 feet. There the company tends to become more efficient due to better utilization of resources. However, at about 1,670,000 feet, the line becomes steeper indicating a loss of efficiency due to such items as nerv help, expansion of overhead costs, increased inventory control, g'reater stock levels, etc. Tcr make this into a breakeven chart, performance figures are now needed.
Performance Figures
&"1.*ool. - bouglot 9i,Fin"
P.O. Box 508
Phone: CYpress ,-8O5, San Jose 27, Calif. Teletype SJ-54 being able to find the first point on the diagram.
(d) The values of the individual expense lines are then added together to give the total expense curve.
At this point it is possible to see graphically the relationship between expense and volume. Certain facts about the efficiencv of the oDeration become evident for the first
The profit for each month of past history rviti-r its associated volume is now needed. This is again tempered to reflect what it would be with current labor costs and so forth. The profit (loss) is then added (subtracted) from the basic expense line. This rvill give the gross line. This line may be determined by the average markup per thousand times the volume, and again using the scatter diagram technique determine the gross line.
This is the basic breakeven chart. Based upon the l-ristory of the company, it will make or lose money at any specific volume as indicated by this chart. On the chart shorvn, the yolume necessary to break even is 990,000 feet per month. At any volume greater than 1,340,000 feet per month, there will be no increased profits. (The larv of diminishing returns is set in motion.)
This chart has been found most useful where the operations have follor'r'ed the pattern of the past. But rvhere the operations suddenly change (doing individual homes to doing a tract or hotel), then the breakeven chart does not take into consideration the change of operation and u'i1l give a \vrong picture.
Reference No. I gives a method of computing breakeven point that follorvs the usual accounting methods.
The breakeven point rvill move u,ith changing conditions, and in moving it will give a u,arning to management of what action should be taken. It can move bv virtue of a factor rvhich r,vill increase the expenses, such as. a new union contract. In this case neu. charts should be prepared. But most often it lvill change bv a change of the volume- margin relationship. To see hon' the breaket'en point changes nnder these conditions, a markup breaker.en chart is constructed.
We already have the information necessary to construct this chart; the expense-volume relationship is used here.
Calculations are quite easy. Margin (average per thousand markup) times volume minus expenses are equal to zero at the breakeven point. Expressing this differently, expenses divided by volume is equal to margin, at the breakeven point. The markup breakeven chart points are determined by taking selected points along the expensevolume curve and dividing each expense by the associated volume to obtain the expenses per thousand at each r.olume. This r.vill give profit-loss area.
The company may have been doing business at one million, four hundred thousand feet u'ith a markup of $25.00 per thousand. If they are'planning to reduce tl.reir volume to one million feet per month, then they rvould have to have a markup of $23.00 to break even, and a markup of $27.00 to have the same profit as before.

I believe at this point I should point out that our use of one chart has been most successful in estimating of profit, loss, or breaking even for a month, but in using another chart at reduced volumes, due to competitive business, we have never found a r,vay to get the required markup for a very slow period.
With breakeven-point thinking, it is possible to compare the past rvith the present and to nse these to plan the future. This analytical tool presents a guide to manirgement thinking. It cannot cllre any of the ills of the in-
l/l/rsrrnN Luusrn
Direct Mlll Shipments by Truck or Rail
Douglas Fir Redwood Pine
Pacific lumher lloalors $upply Inc.
25914 President Ave., Hortor Gity, Collf. P. O. Box 667
Telephone DAvenport 6-6273 dustry or make up for poor management, but it certainly helps present the price-volume relationship in a convenient precise form.
The Breakeven Charts in Use
At the first of each month we hold an executive meeting of the department heads. At this meeting we consider the last month's business and plan for the current. After considering the past business, we then check our breakeven charts. From the first chart and anticipated demand, we find our desired volume for the month. If it is decided that we wish to do one and a half million feet business, our budget for expense from the one chart would be $28,500.@. Looking at the other chart we determine that our minimum average markup per thousand must be $22.50 if n'e are to break even.
This is then our operation plan for the mc,rnth. To follorv this through rve look at our backlog from the previous month and see that rve have one half million feet backlog. If we desire to have one cluarter of a million feet backlog at the end of the month, we then have a sales plan of selling one and a quarter million feet for the month and delivering one and a half million feet. To reach this desired goal lve prepare a "Daily Operations Chart."
On this chart, a solid line indicates the desired sales; a dashed line indicates our actual sales. Along the bottom are the working days of the month. At any time during the month the total sales to that day may be determined by just reading the volume associated rvith that day. Further, the estimated total sales for the month may be determined by laying a ruler from the beginning to the current day and reading the last day, this estimates that the remaining days of the month will show the same as the first days.
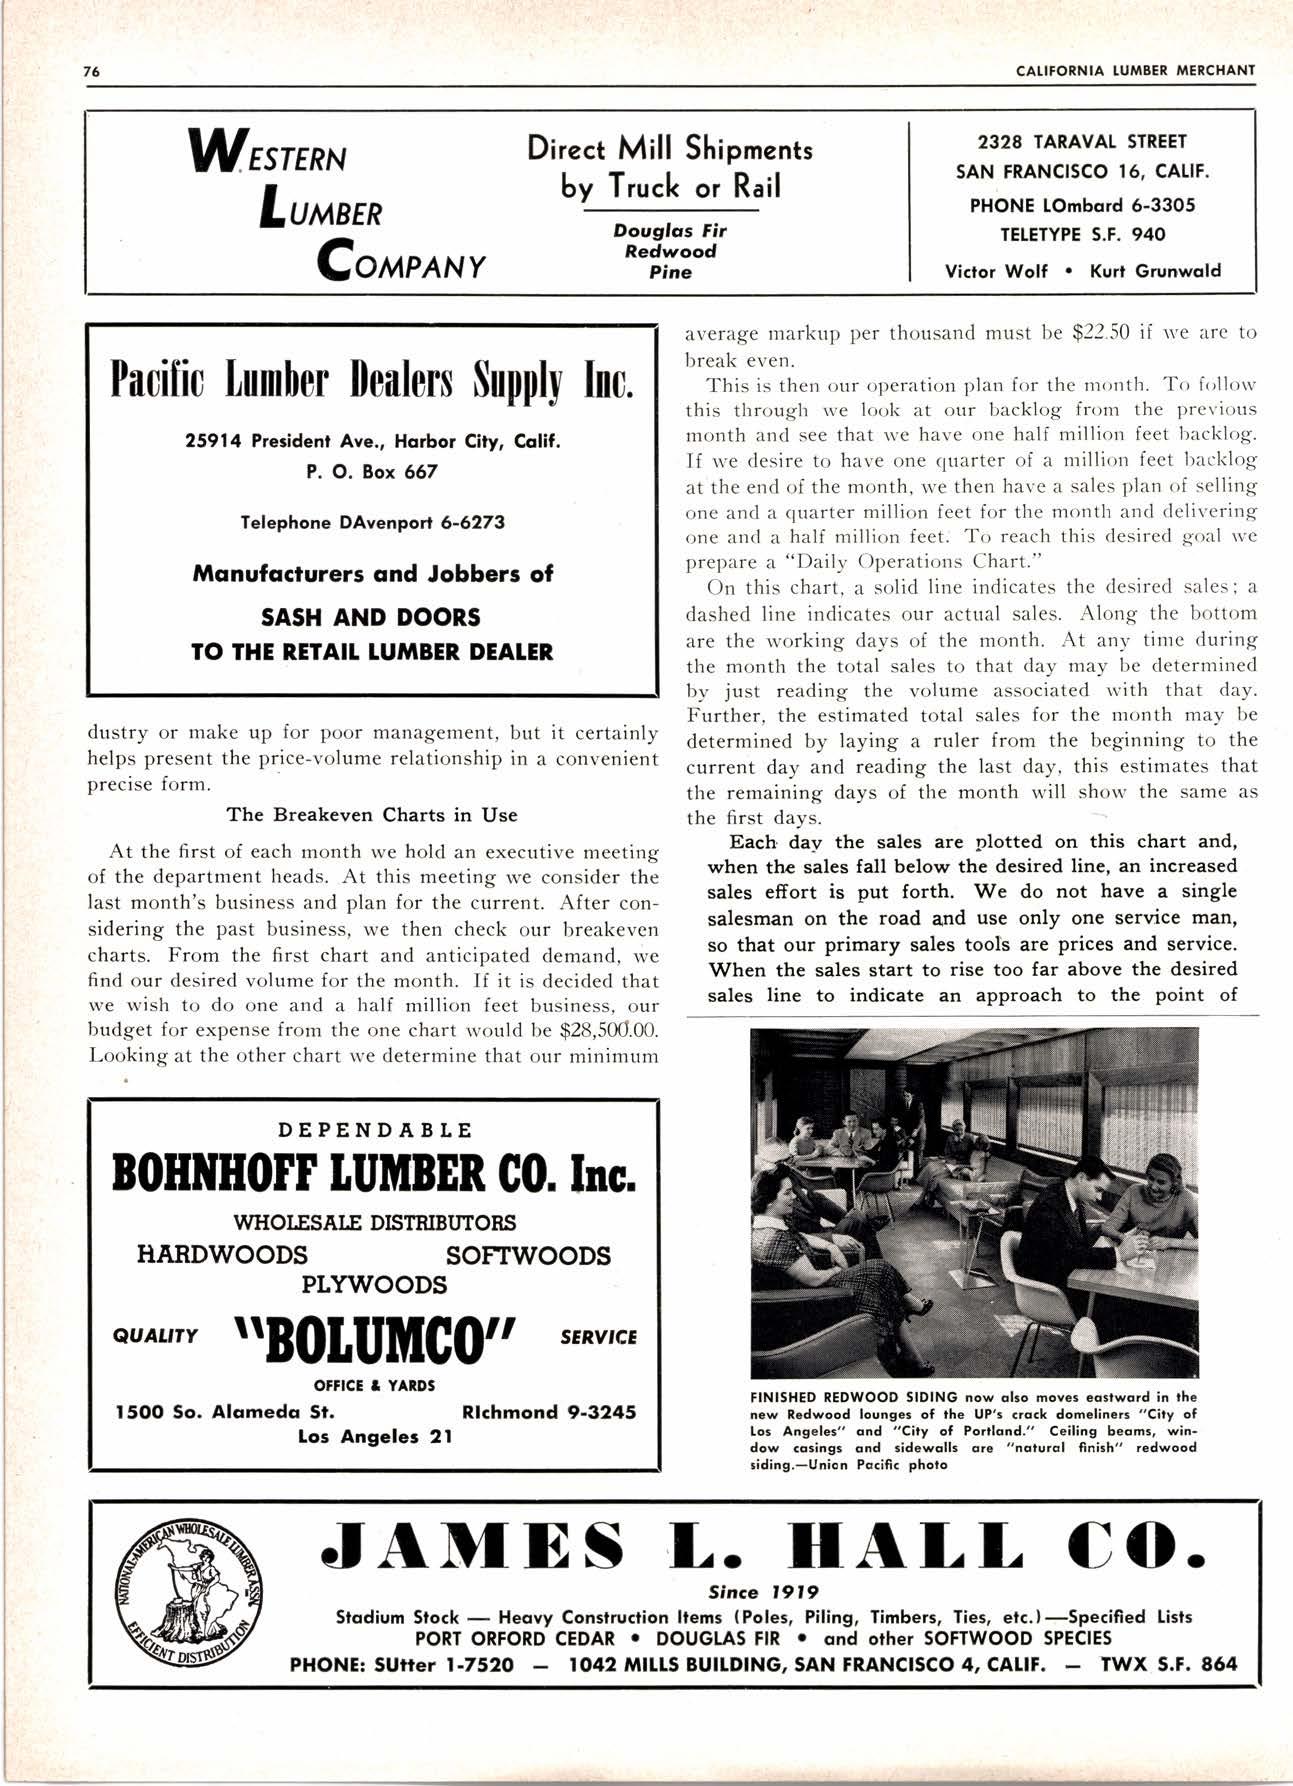
Each day the sales are plotted on this chart and, when the sales fall below the desired line, an increased sales effort is put forth. We do not have a single salesman on the road and use only one service man, so that our primary sales tools are prices and service. When the sales start to rise too far above the desired sales line to indicate an approach to the point of


