
Homeowners, designers, and architects have long desired for a way to better interact with the worlds that they inhabit, and create better environments for themselves and the people that depend on them. Unfortunately, as it true with most protected disciplines, the barrier to entry of many techniques is higher than most people will comfortably meet.
Rules of thumb - such as those elaborated upon in the Daylighting Pattern Guide - are very useful for allowing non-expert groups to create more holistically designed environments, and to incorporate technologies and techniques that they might not fully understand. Despite the relative ease that these rules can be incorporated into the average home, they often still require a higher base understanding of design than the mean person. This is where a parametric solution would excel.
Creating a tool that provides instant feedback as well as simple controls would allow for more people to quickly gain the knowledge necessary to use these established rules of thumb. This opportunity is the end-goal of Patterns for Health - to create a webtool and simple interface to allow normal people to diagnose issues with their existing spaces, and to suggest specifc and unique solutions to their unique problems.
Introduction
Established tools and techniques for daylighting Introduction of proposed tool types
Pipeline overview and explanation
Introduction to the case study home
Still Image Generation
Benefts of the grid approach
Overlay breakdown
Example cases
Clip Generation
Benefts of the animation
Overlay breakdown
Example cases
Viral degradation
Packaging & dissemination
Web page mockup
Author Information
All
Source: Daylighting Pattern Guide - Floor Plate Geometry https://patternguide.advancedbuildings.net/patterns.html
Established tools and techniques for daylighting Throughout history, it has often been the goal of civilizations to simplify, share, and democratize knowledge that benefts their people. This is one of the intentions behind the Daylighting Pattern Guide - one of many repositories containing generalized explanations of ‘patterns’ - a group of simple rules and known typologies that can be used to create expected outcomes.
The main issue with generalized patterns is exactly thatthey are generalized. Due to this, each pattern is only able to show a simplifed version of what a person could fnd in a real world situation. This approach is completely acceptable for an industry where the end-user of the guide has the knowledge and experience to elaborate upon the information that they are given, but isn’t as useful if the end-user is a non-professional. Without an ability to understand what aspects of a pattern are applicable to each specifc scenario, a more generalized and intuitive approach is necessary for most situations regarding non-professionals such as homeowners and property managers.
We must consider aspects of habitability that aren’t only related to daylight, and provide an intuitive environment for clients and customers.
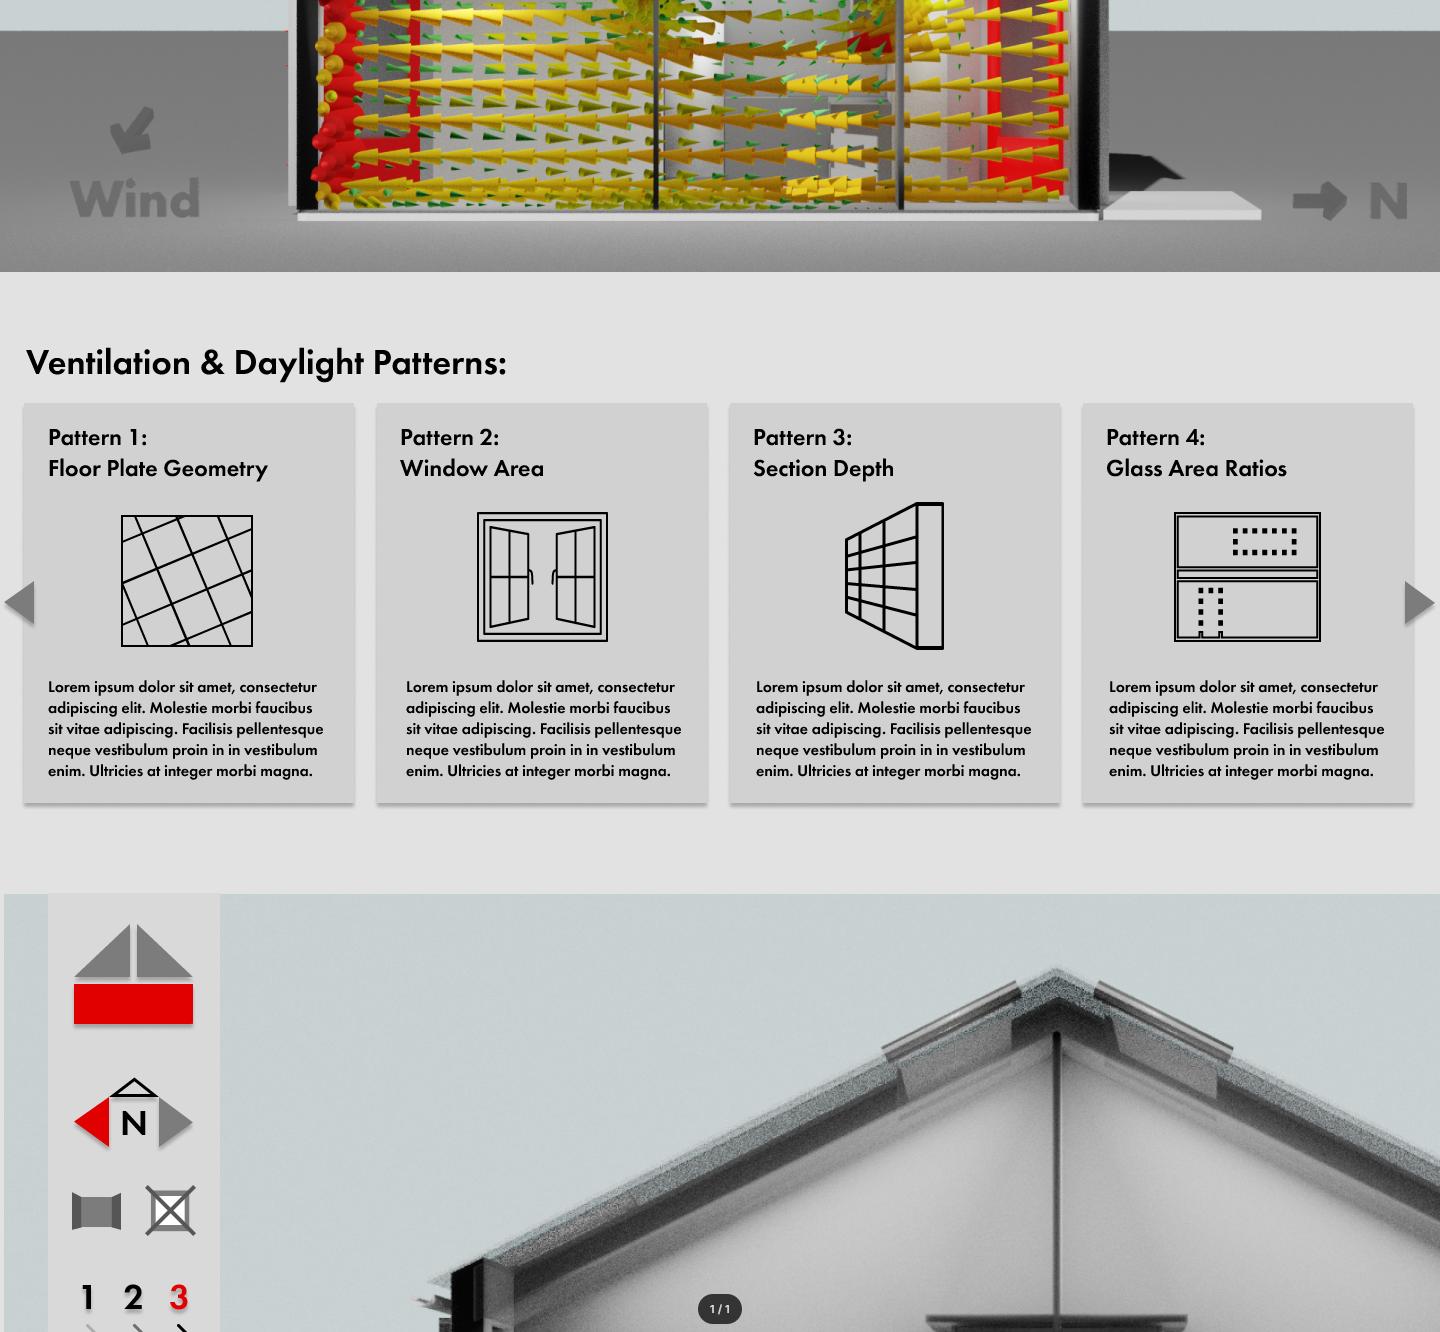
As the title suggests, the Daylighting Pattern Guide focuses entirely on how daylight interacts and exists within various diferent spaces; due to this, each of the patterns provided typically falls into three main categories: foor-plan related, aperture related, and shading related. Although these categories cover many of the typologies that one would expect to explore during design development, it minimizes the usefulness of the guide for existing structures, and even when used efectively can only apply to daylight - one small piece of the many considerations that contribute to health and happiness in the built environment.
The purpose of Patterns for Health is to expand upon the foundation that the Daylighting Pattern Guide has built. By considering aspects of habitability that aren’t only related to daylight, and providing a front-end environment for nonprofessionals to interpret and understand these aspects, we hope to create an intuitive system that will give the power of choice to our clients and customers.
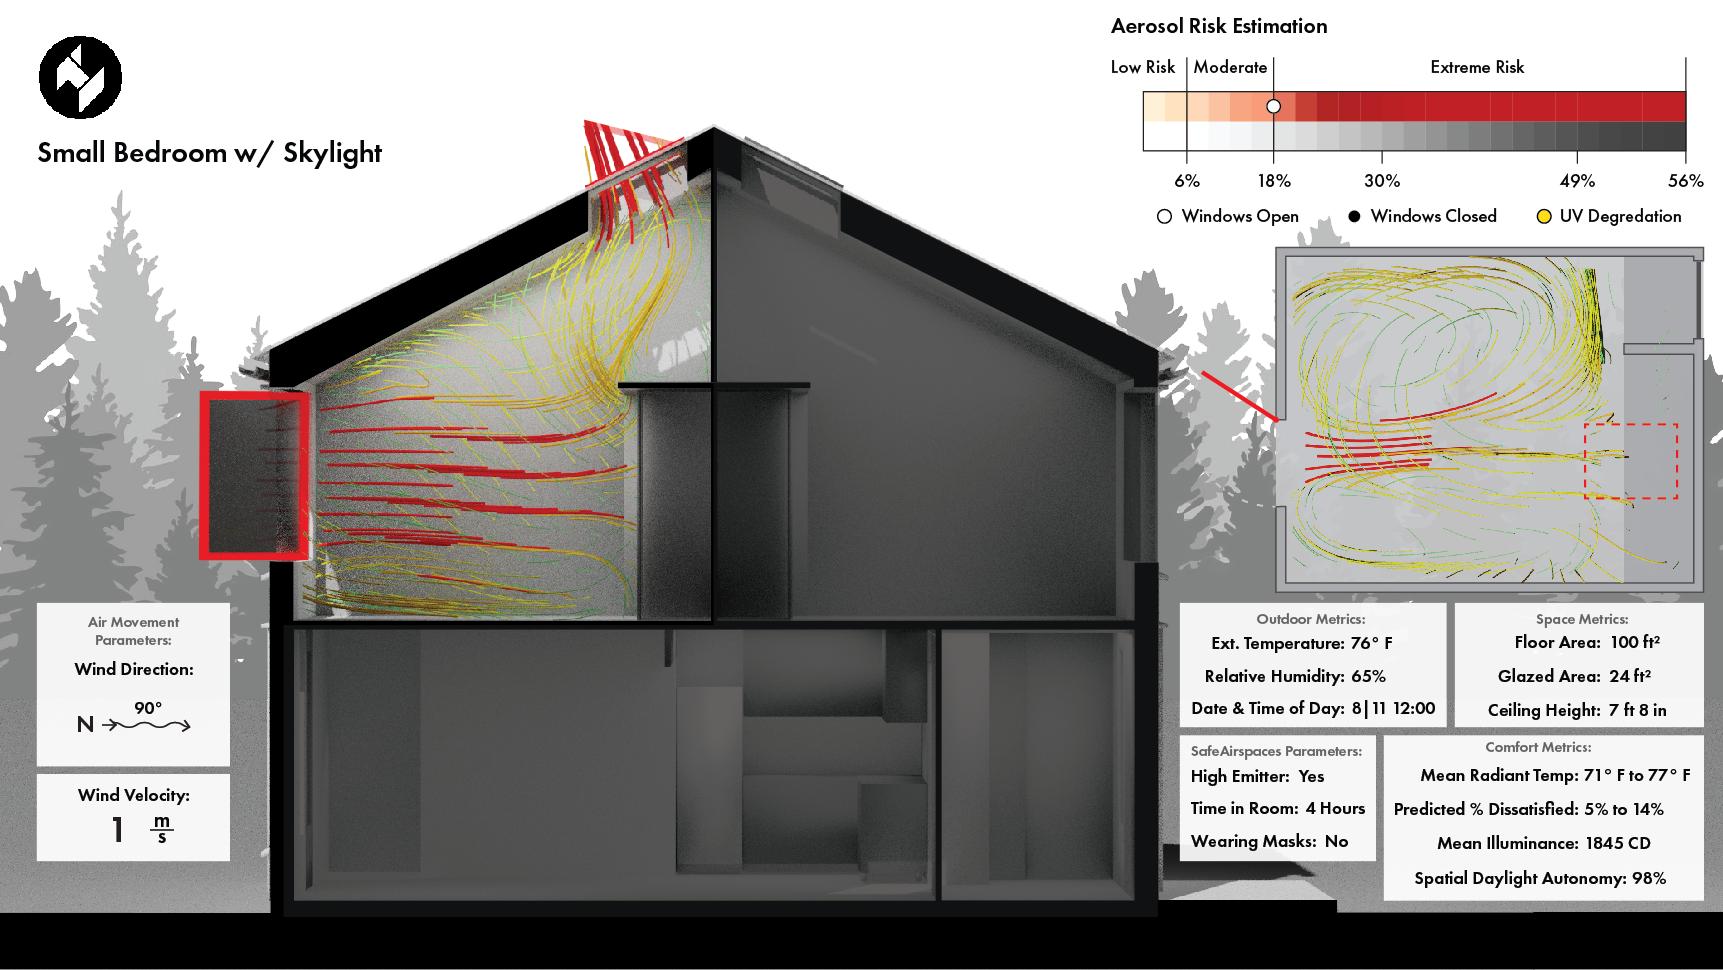
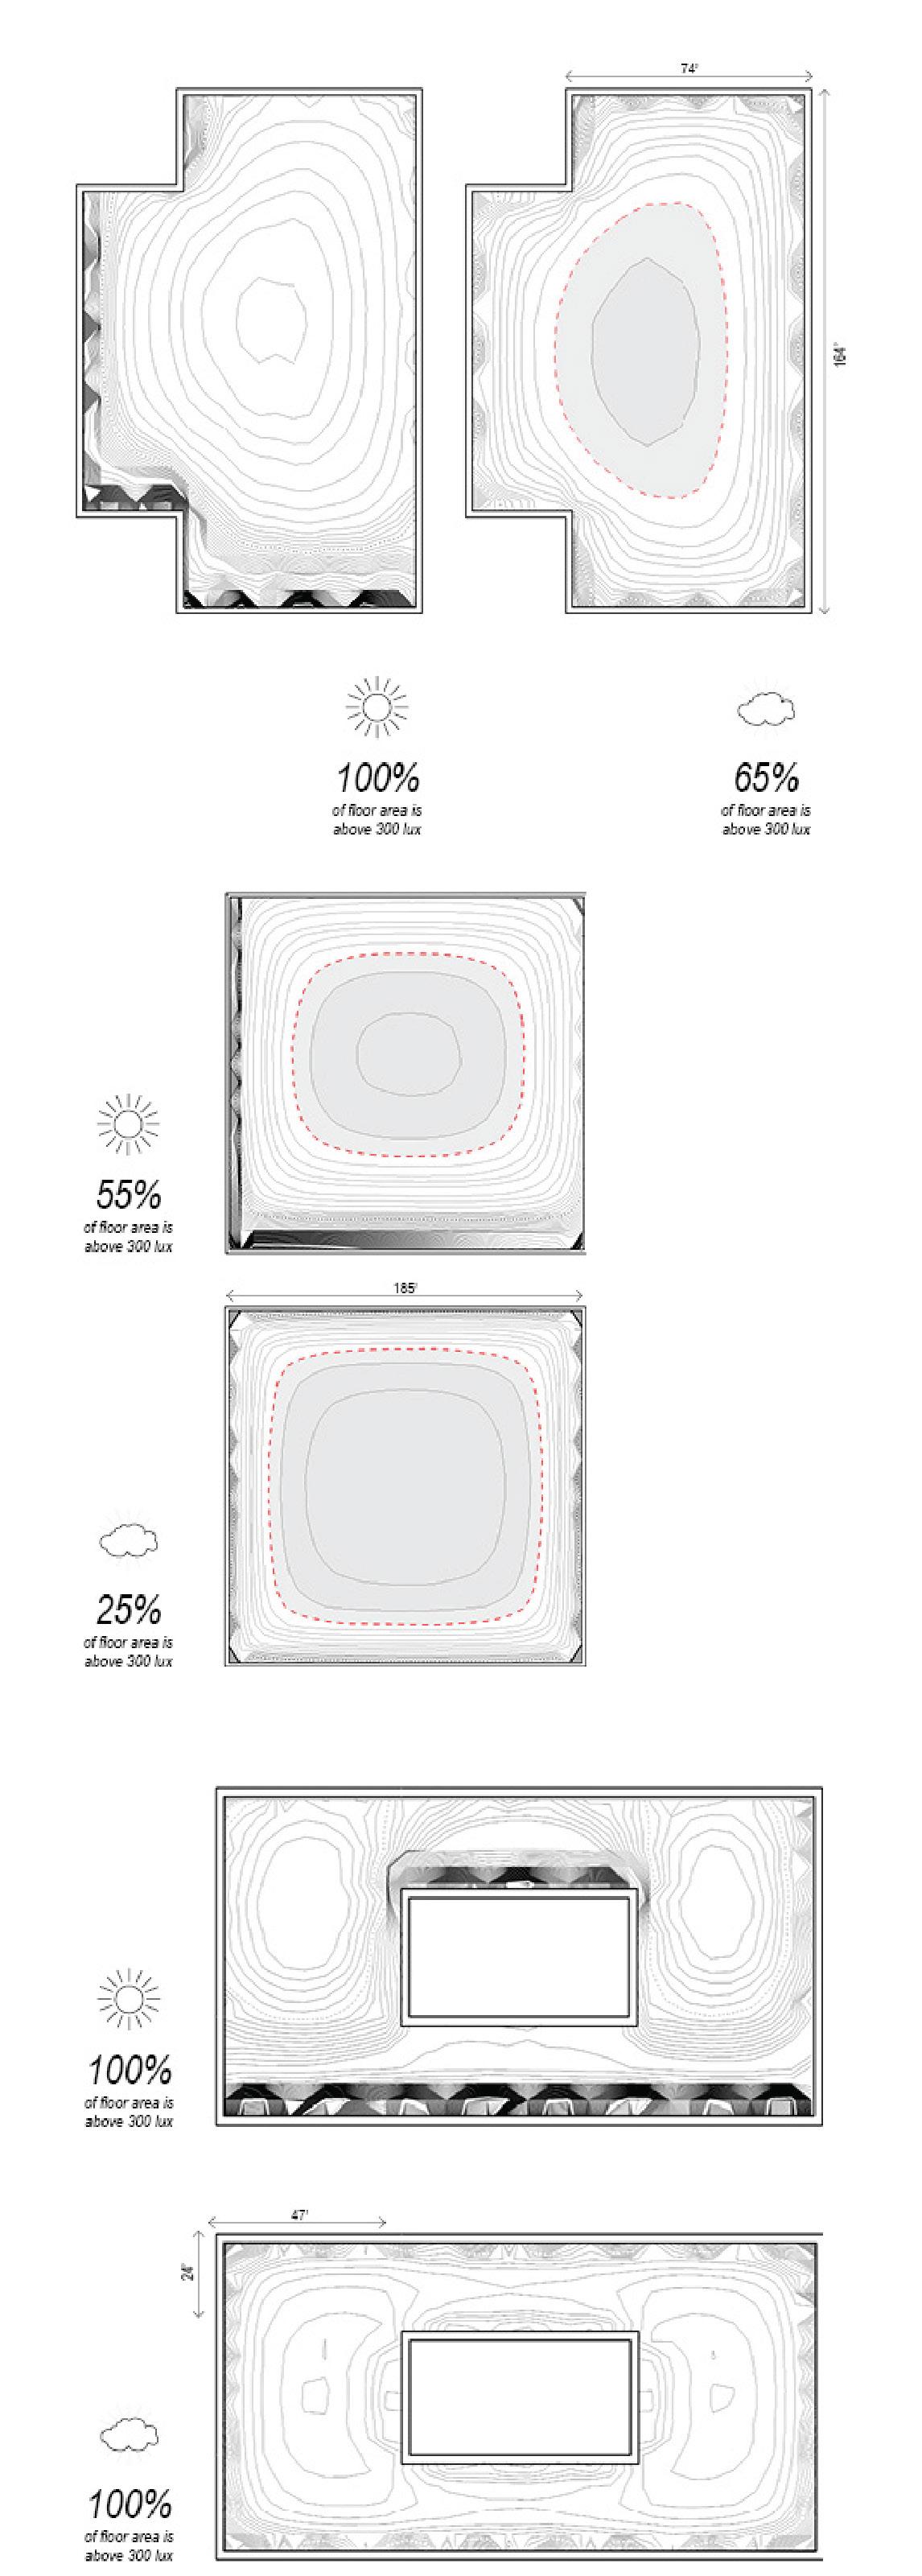
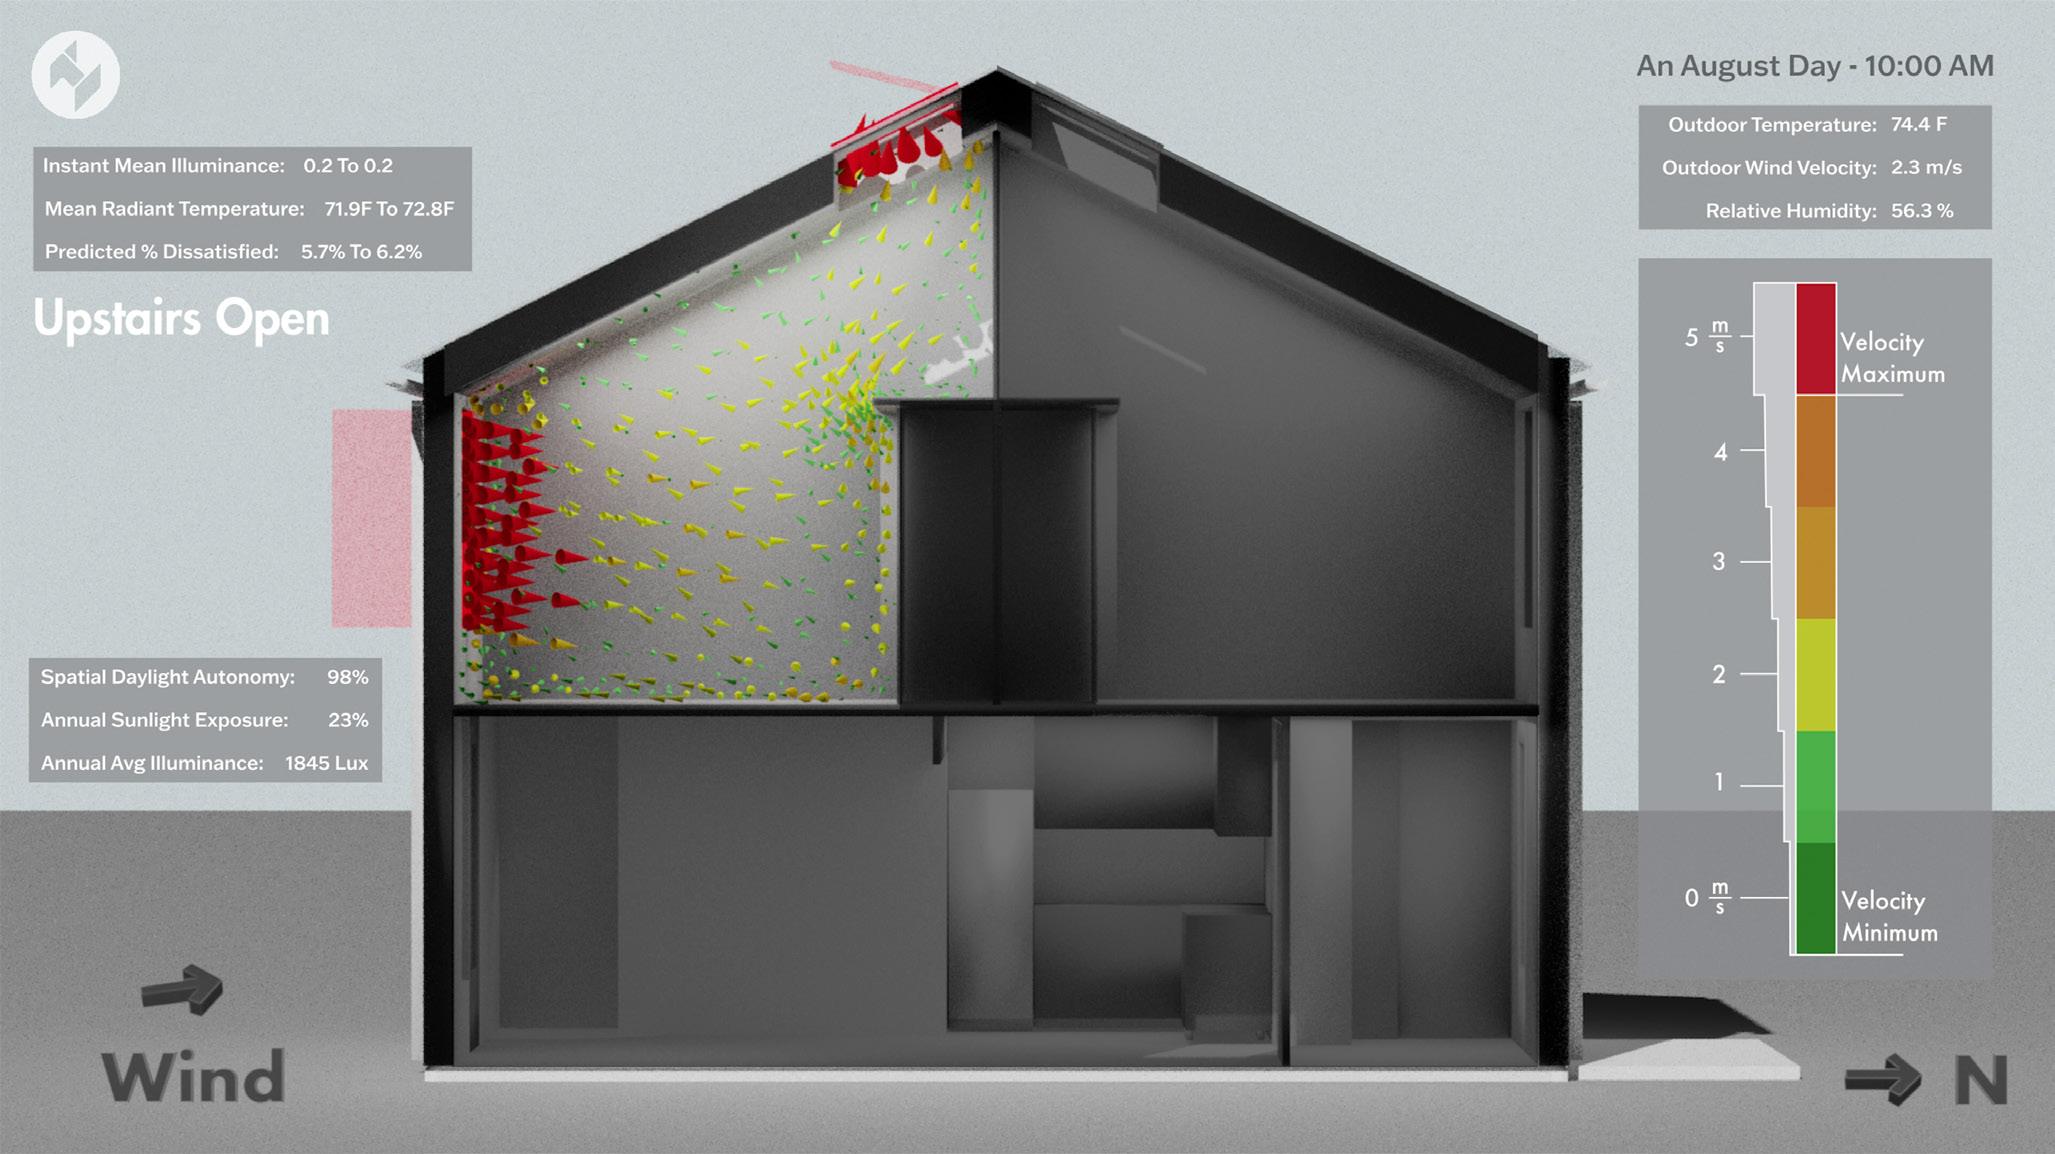
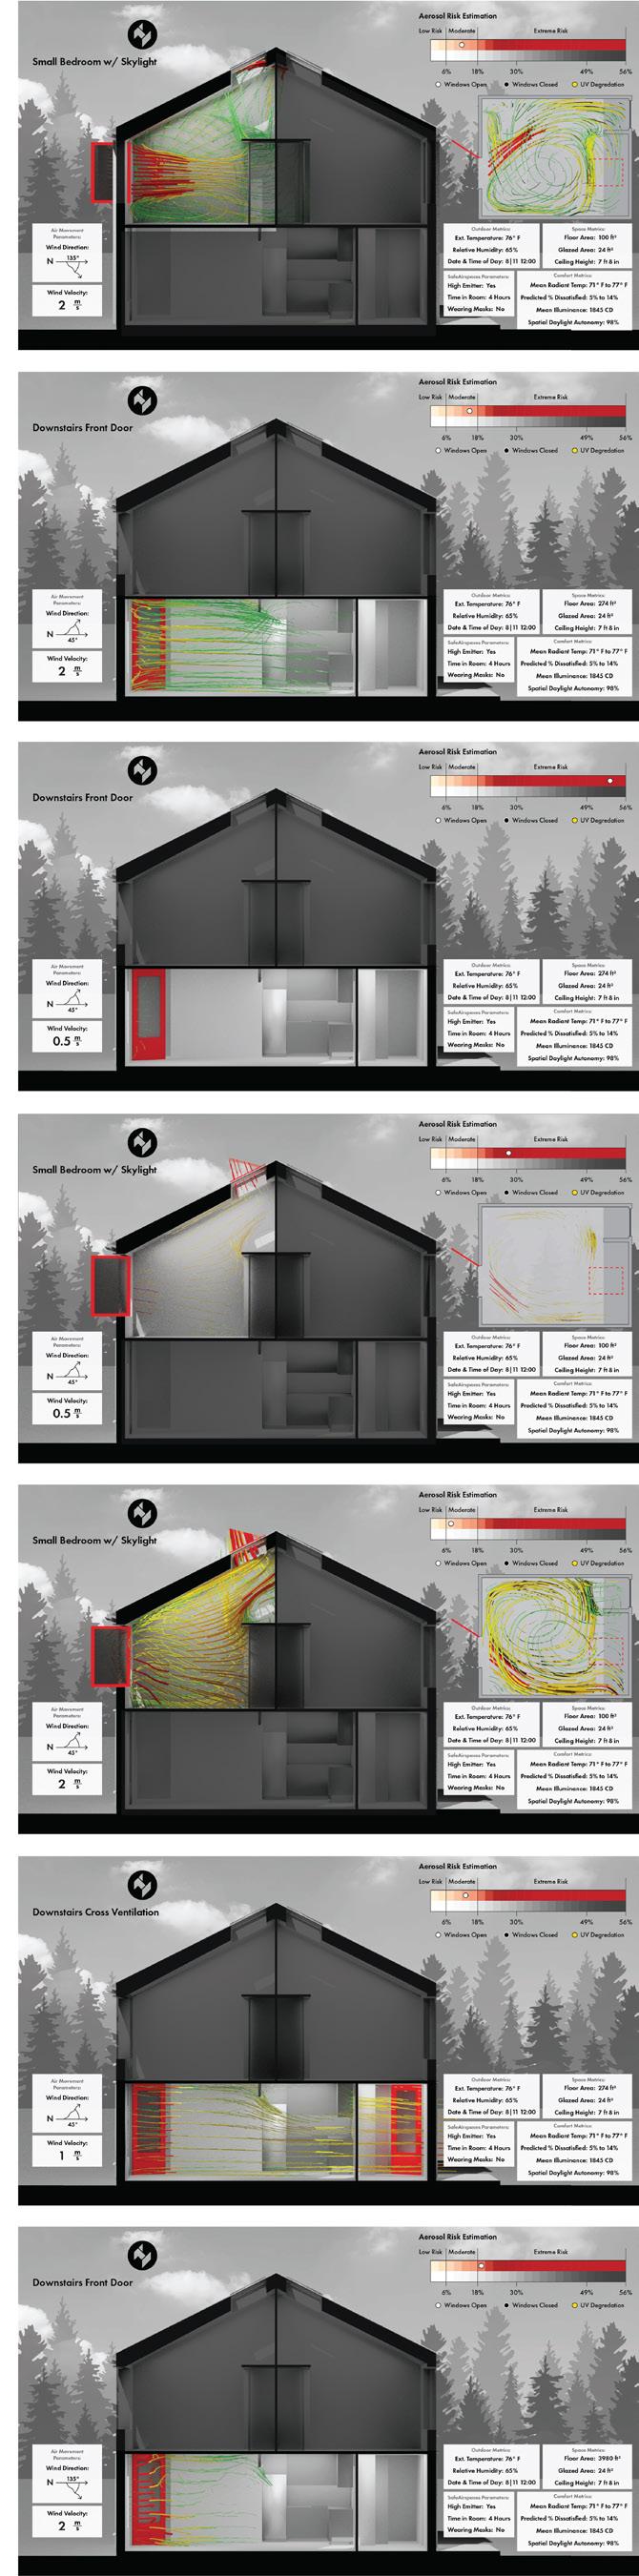
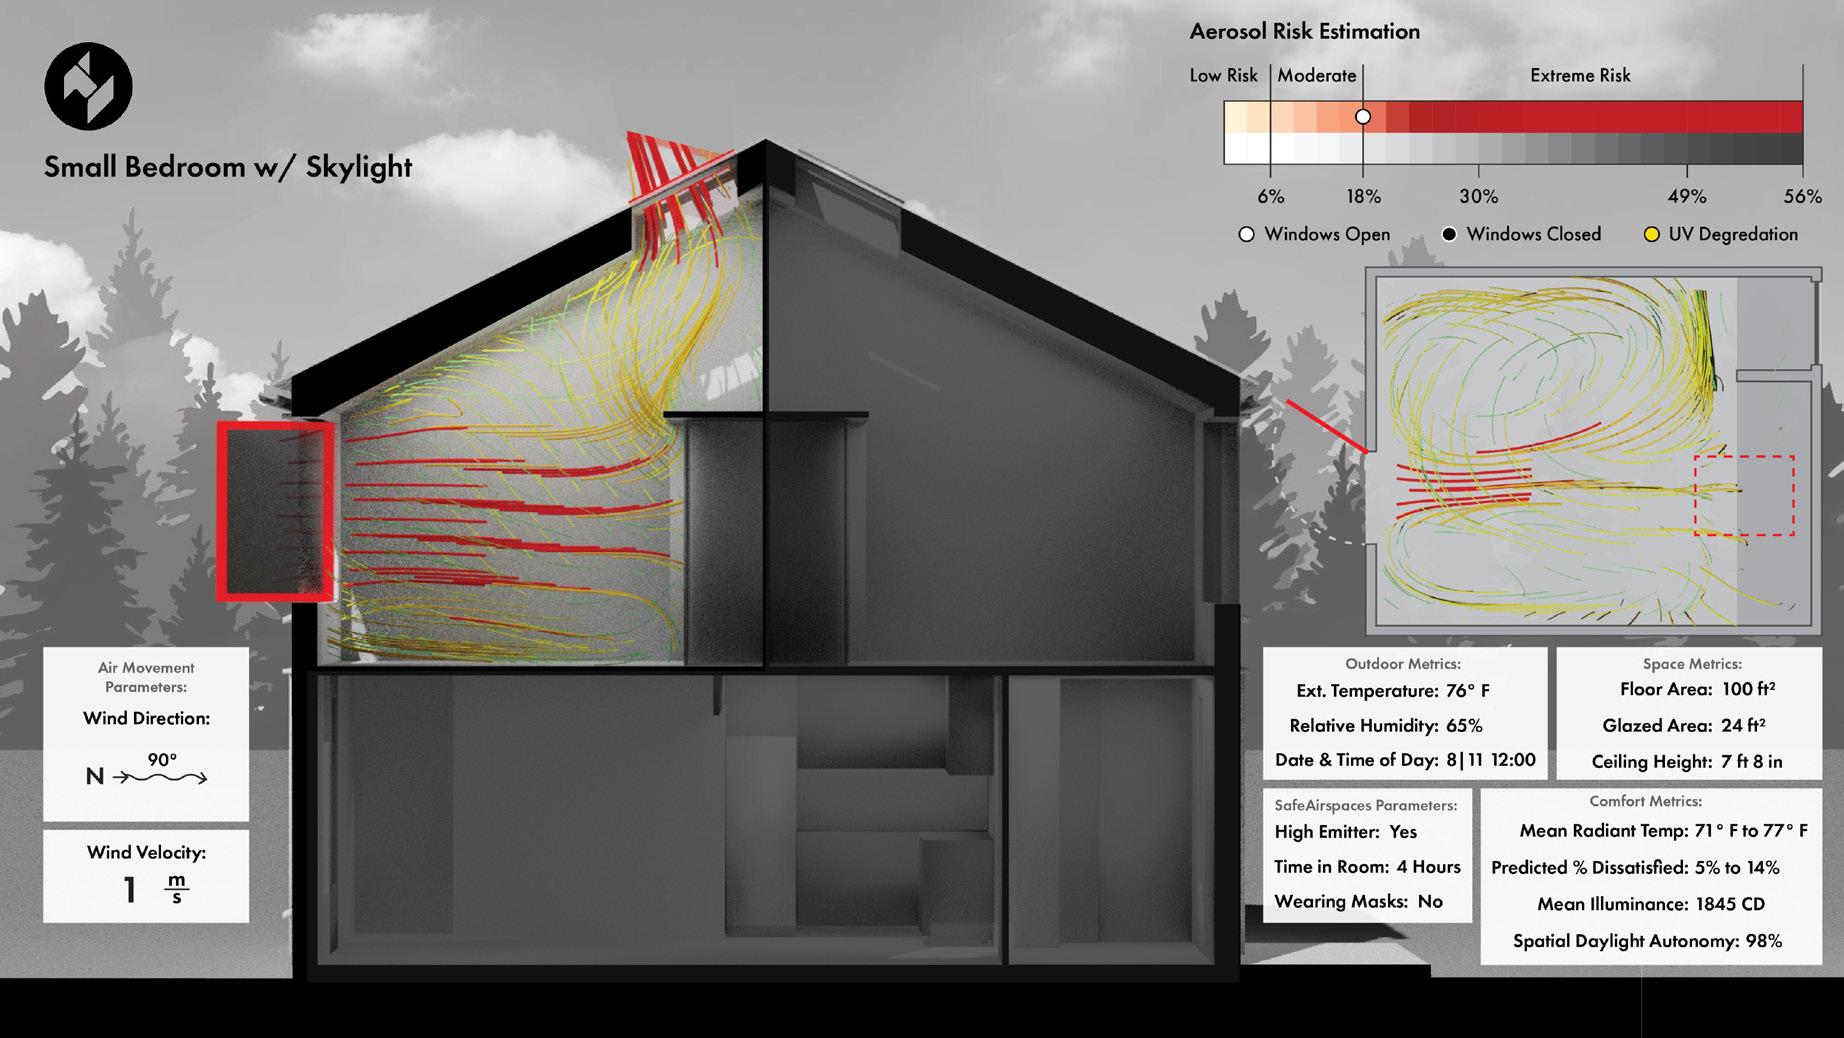
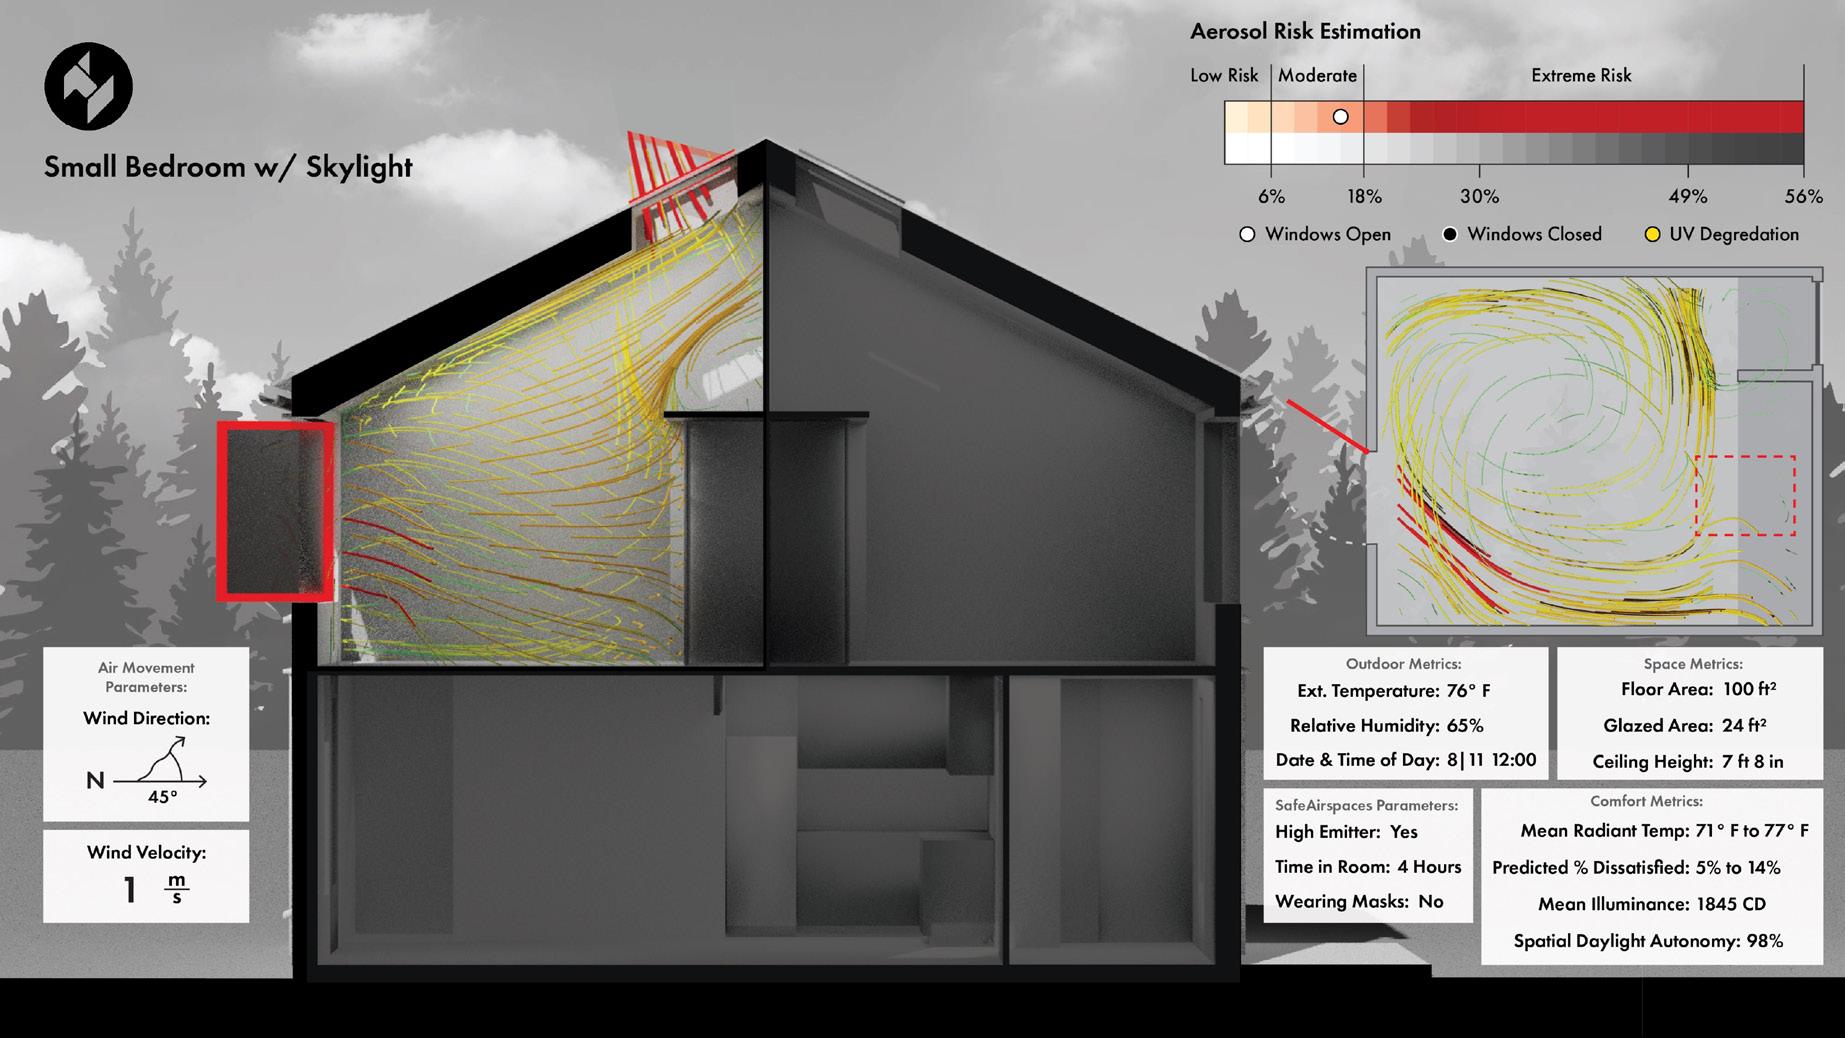
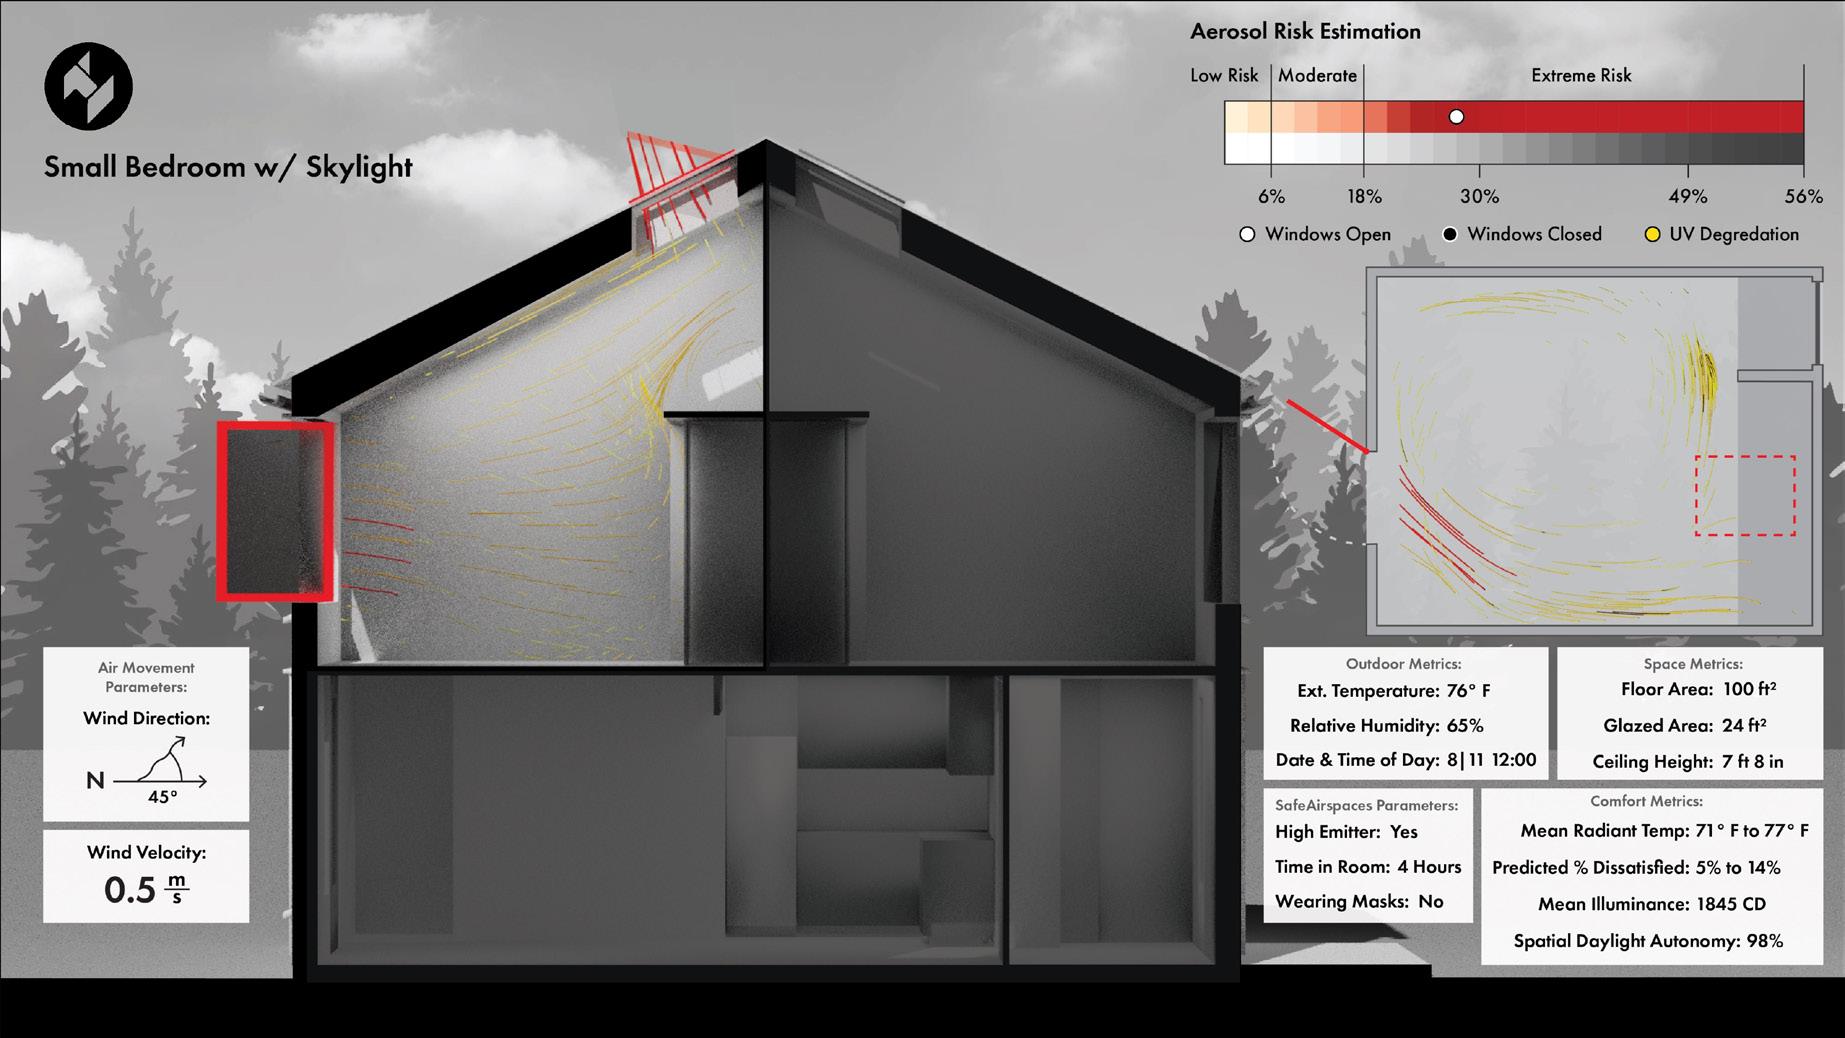
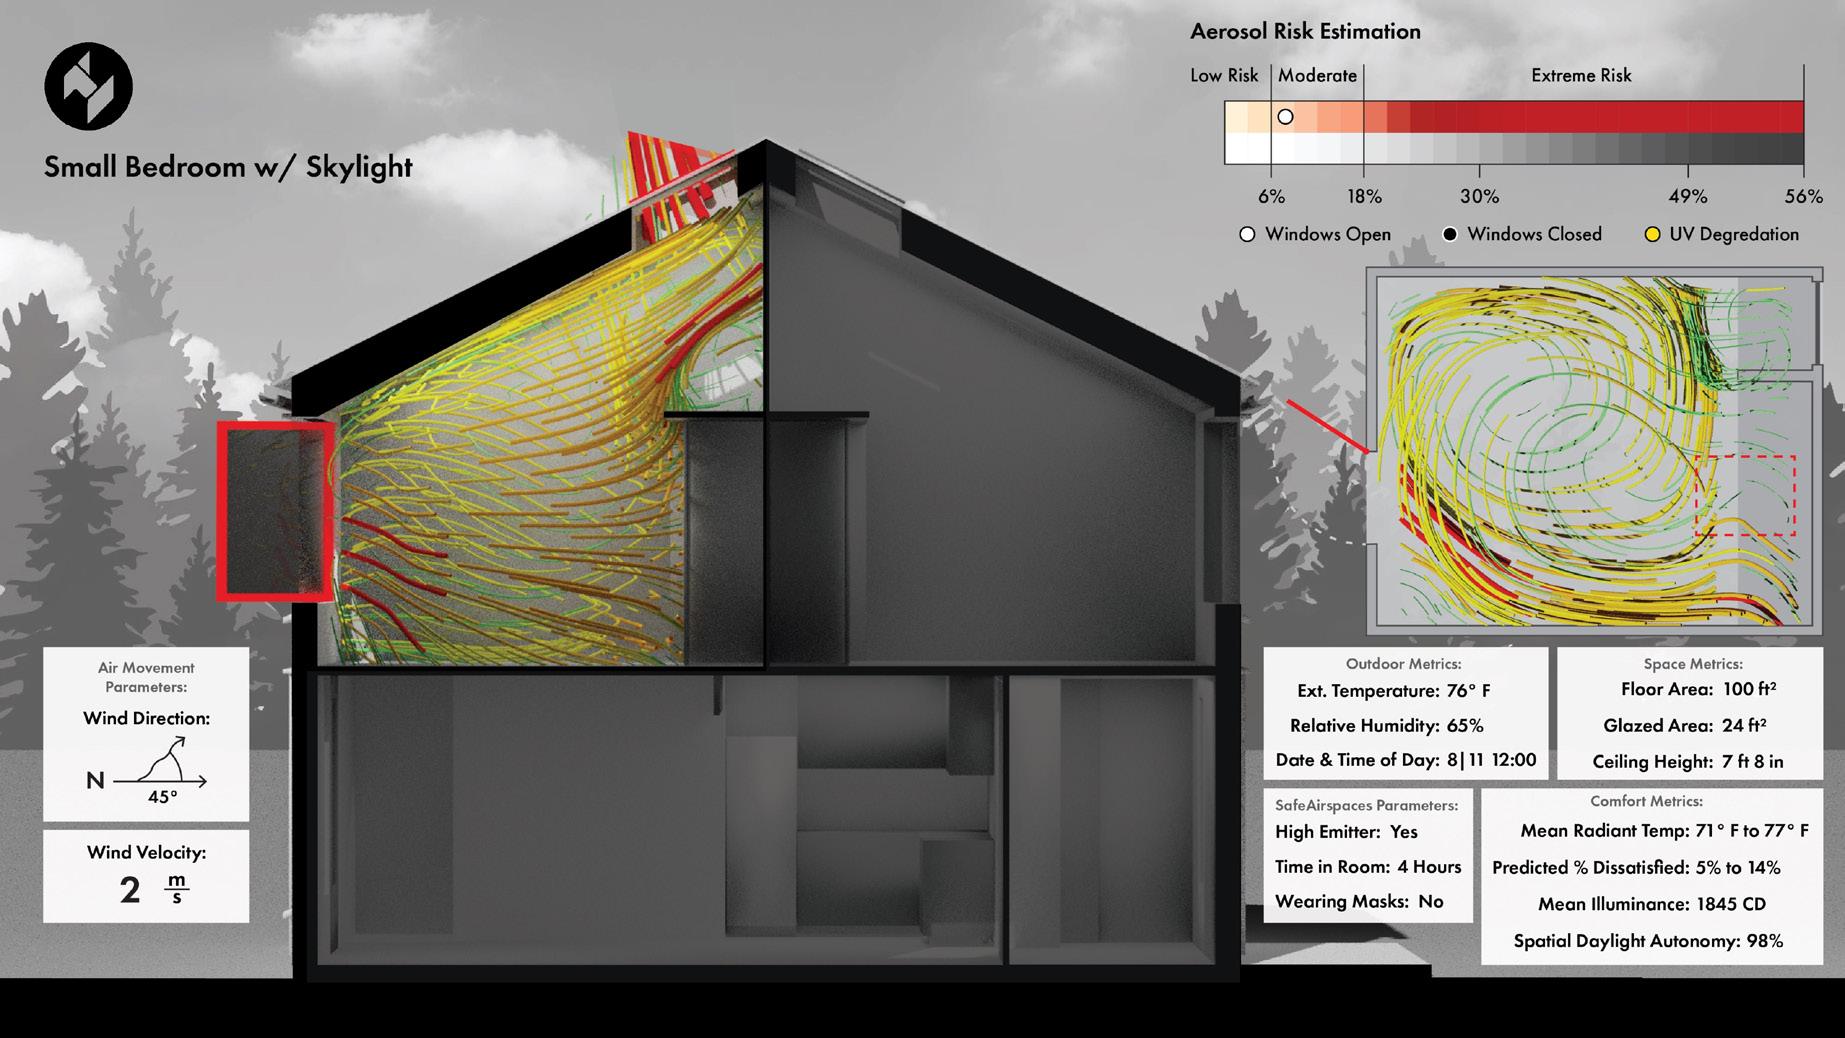
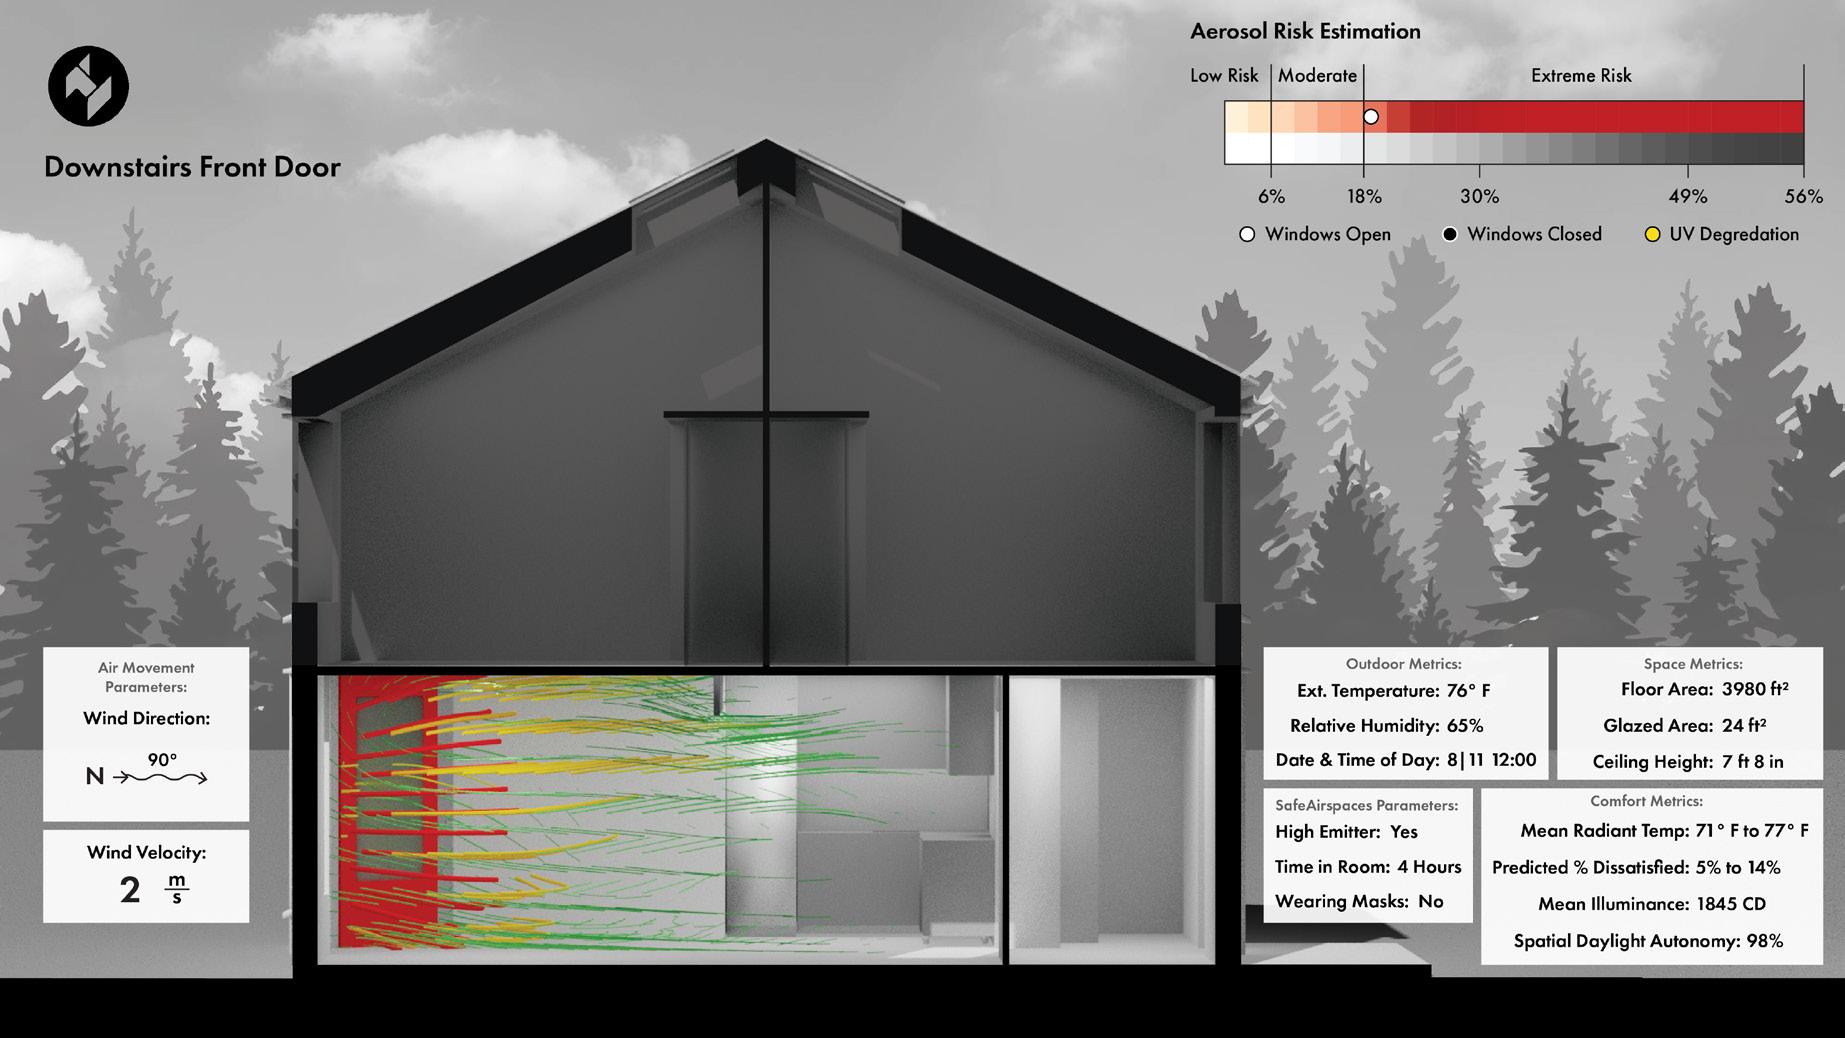
The beneft of having dozens of discrete calculations, hours of simulated activity, and simplifed metrics combined into a single data-dense graphic is an obvious one. This approach gives end-users a static and informative view of how their space functions when given a set of specifc inputs.
To generate the images shown, a simplifed 3D model is run through a series of diferent simulation tests based on location and averaged over a 4 hour period. This allows for interval based metrics such as SafeAirspaces and air-changes per hour to be calculated, as well as providing averaged and err0r-mitigated values for metrics such as mean illuminance and PPD thermal comfort.
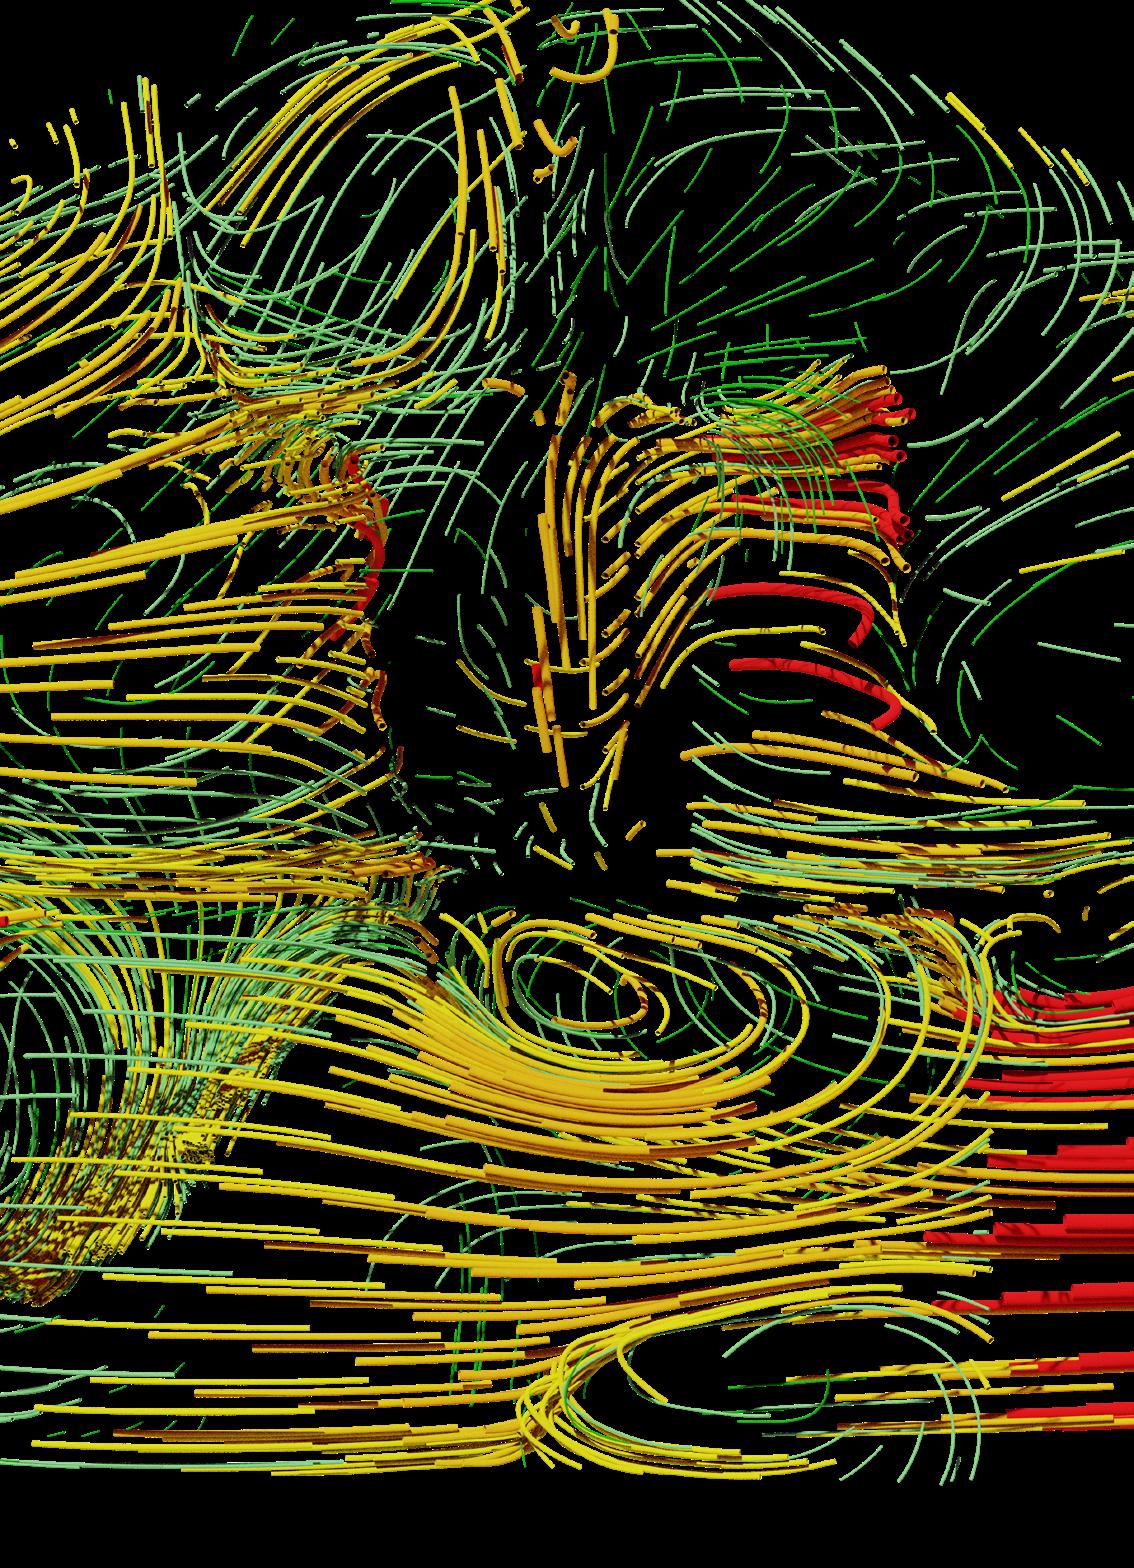
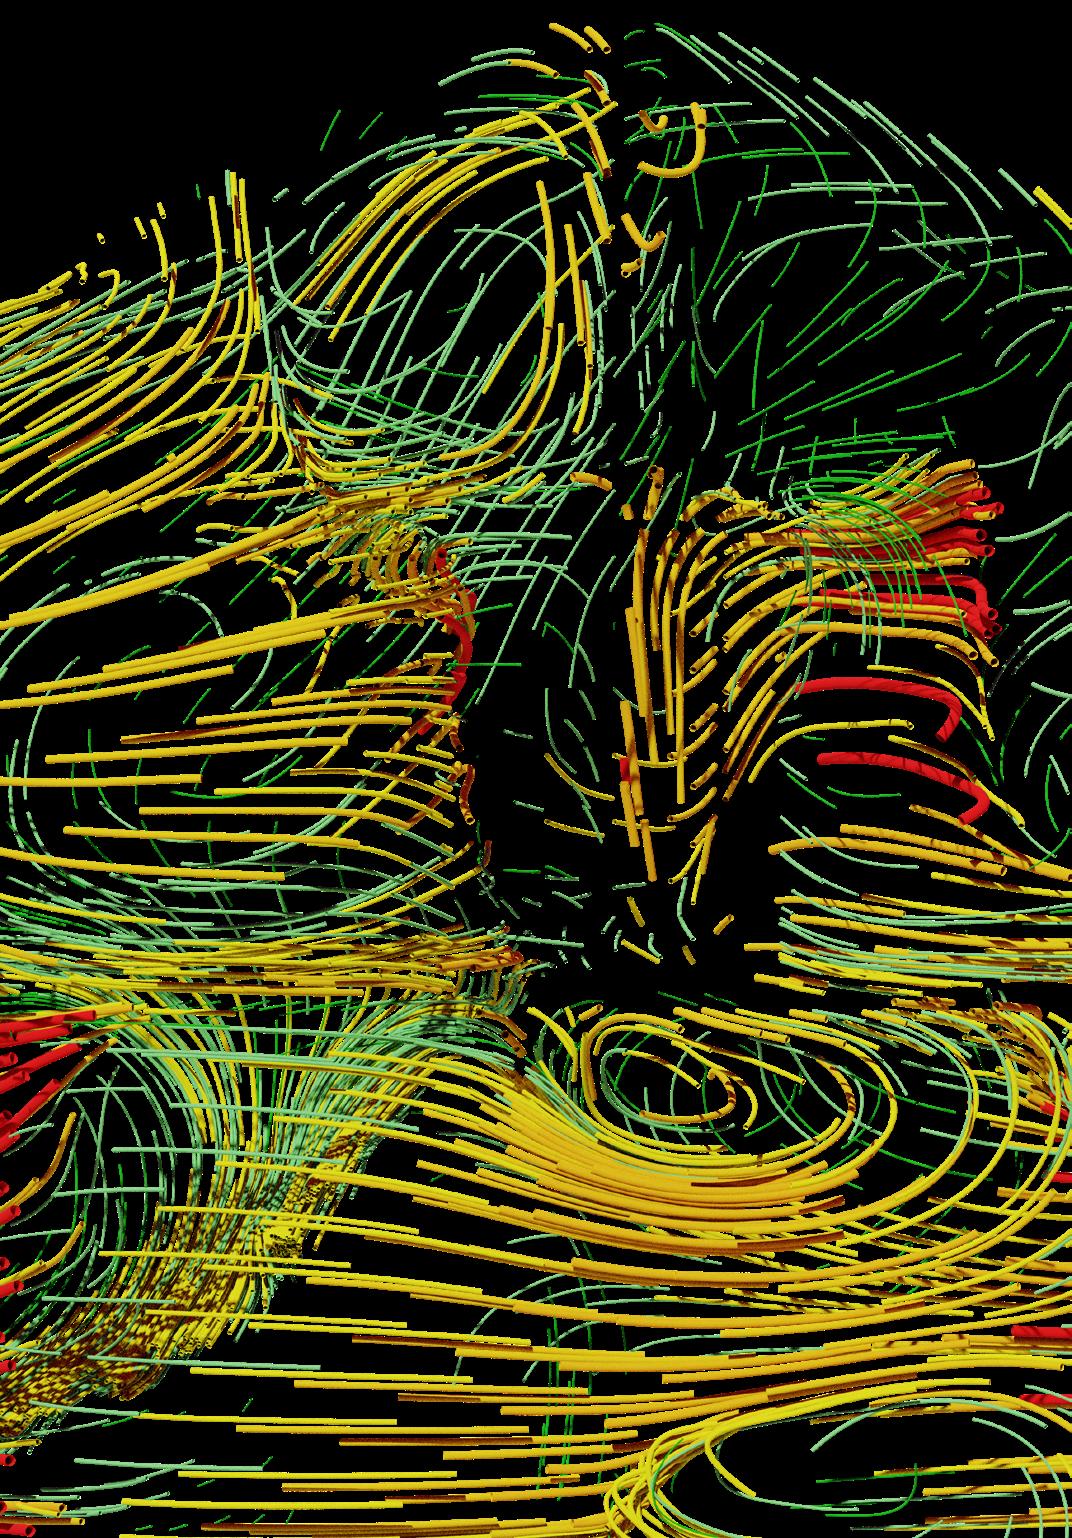
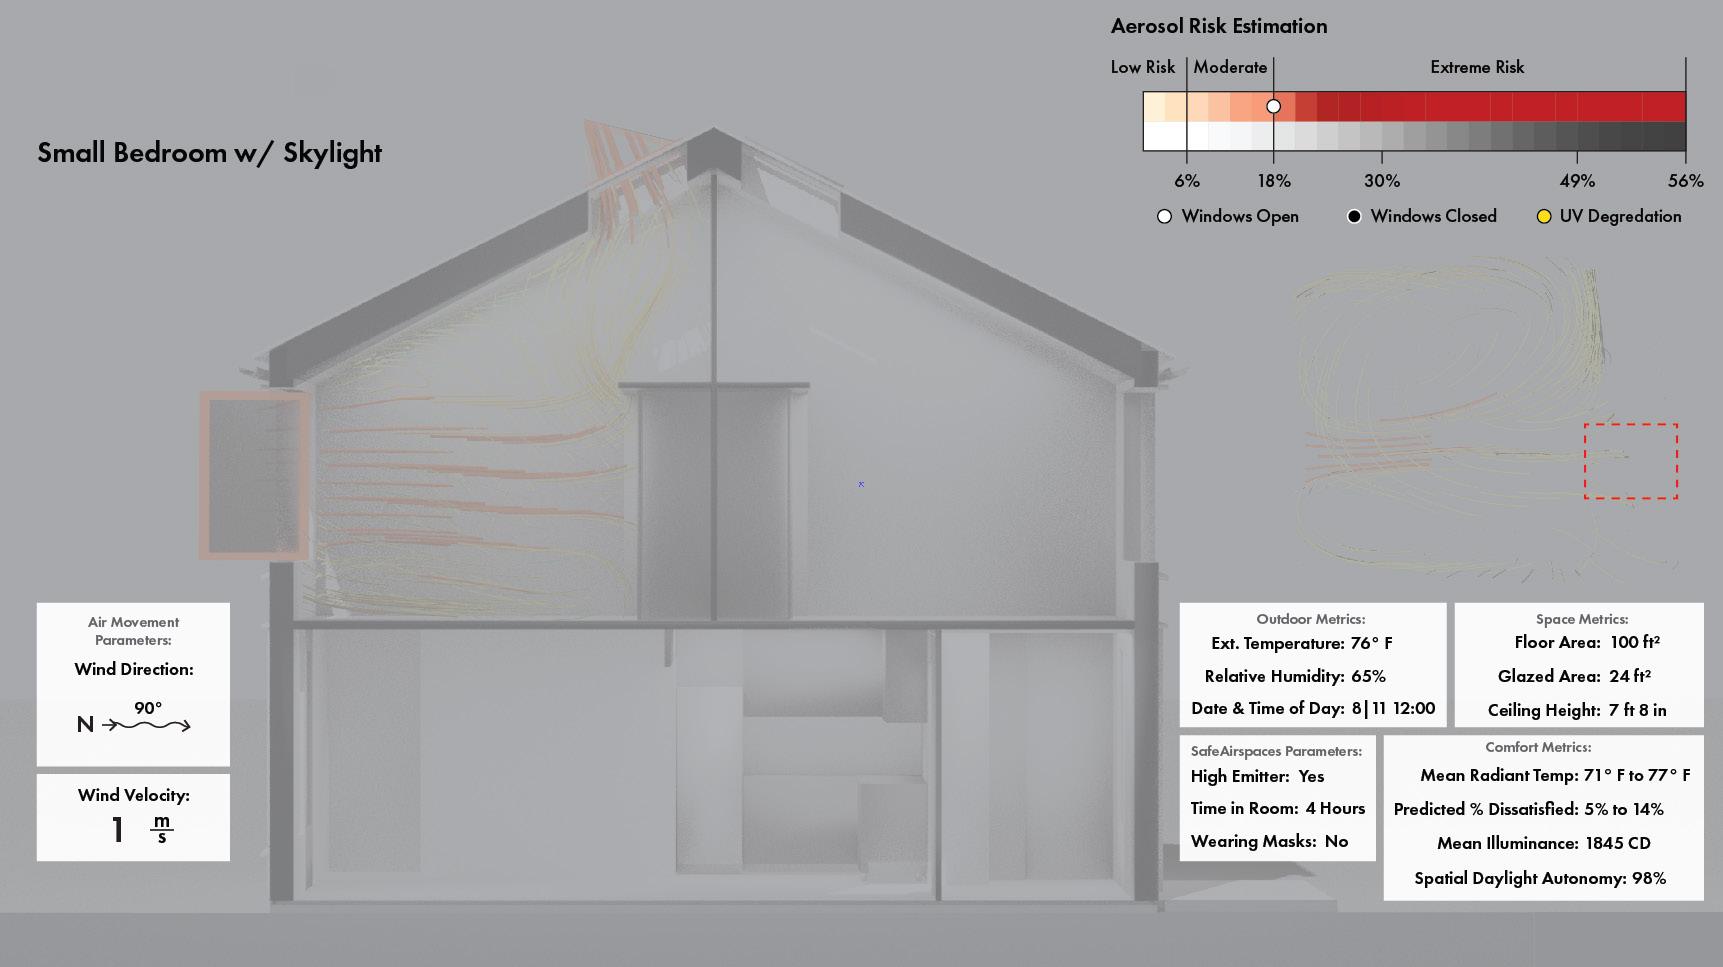
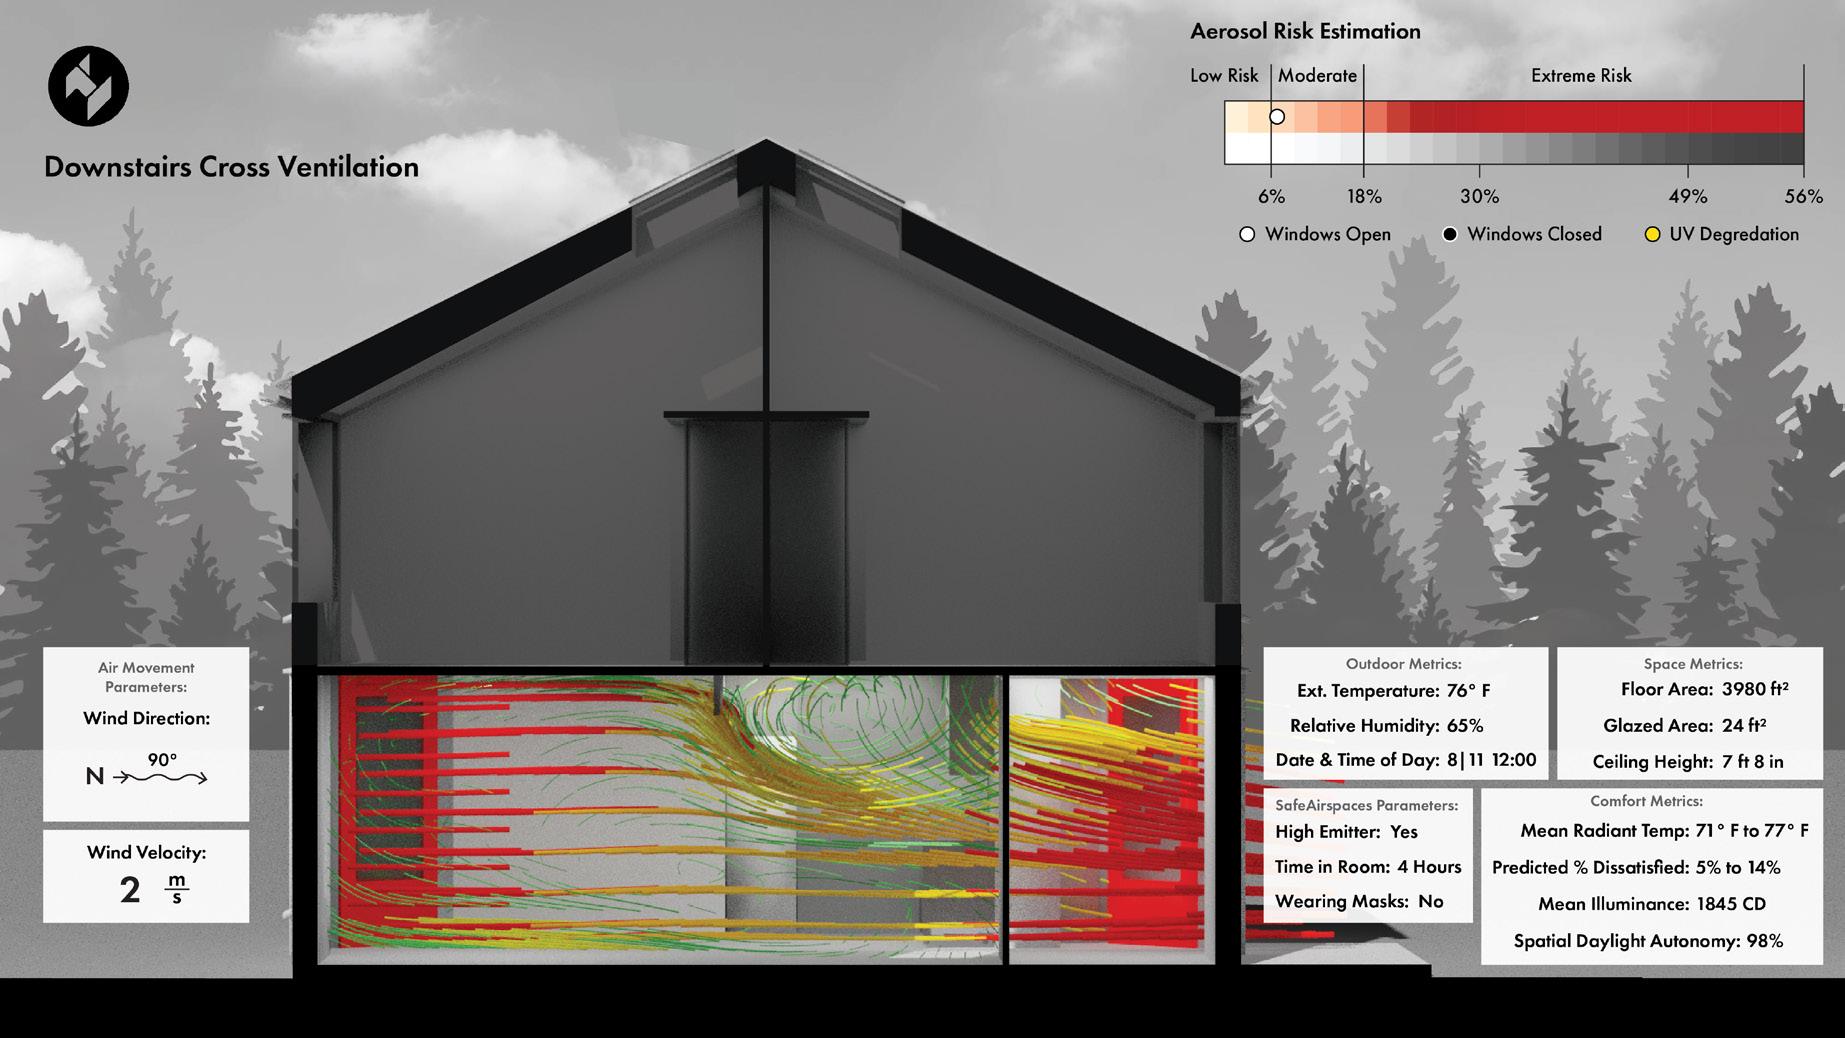
The CFD results shown in these images utilize a process known as vector-feld generation to create an intuitive fow-path visualization. This allows users to understand how air can move within the structure and where air fow issues such as eddies and the turbulence associated with them can form. When coupled with the ability to add and
remove apertures, these views are invaluable when providing a visual argument for the benefts of cross ventilation, stack ventilation, and variations involving combinations of natural ventilation techniques.
Developed in conjunction with the still image generation, this version of the scripted tool allows us to output video clips showing how an indoor environment adjusts to outdoor changes. This format also allows us to overlay hourly or sub-hourly data onto the video for metrics such as outdoor wind velocity, relative humidity, and temperature. For end-users this allows a clear understanding of fuctuations throughout a typical day. Results that are location based would be incredibly benefcial for home-buyers moving climates, recent transplants learning about their new home, and students that might not be familiar with the climate of an area that they are studying.
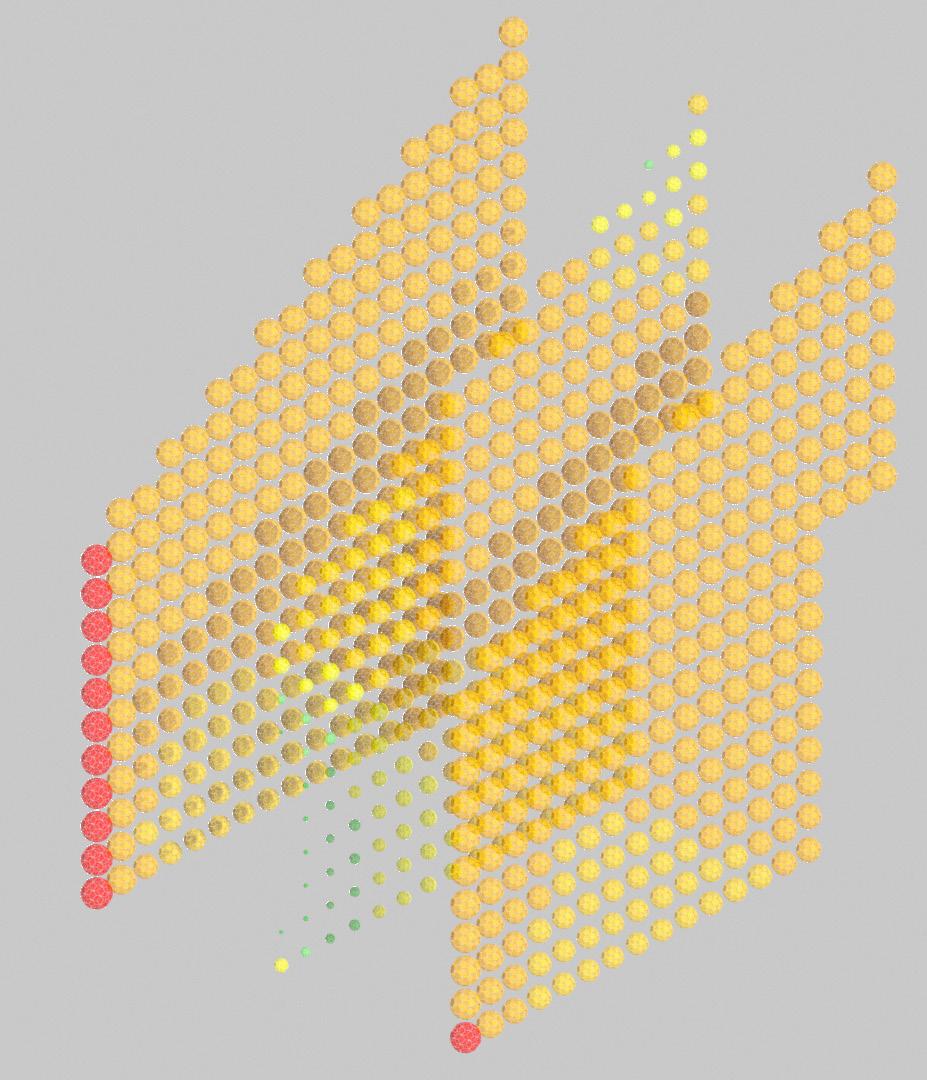
Instead of creating a sequence based on vector felds, this visualization captures data based on a grid of points that show an instantaneous magnitude and direction of air movement on a given day, in a specifc locale, and at a specifc time-step. This translates to a 3D grid of arrows, each representing a specifc location within the larger volume of space. When coupled with information
representing the outdoor wind direction and magnitude, this creates a clear connection between the cause and efect of outdoor stimuli.
This style of visualization also provides a great backdrop for daylighting information with a greater fdelity than what is ofered in the Daylighting Pattern Guide. The ability to scrub through historical weather data in realtime and at specifc location allows the user to better match the 'pattern' that they wish to understand with their exact environment.
Incorporating existing technologies to create new methodologies
One of the most daunting issues that consumers face in the ever-expanding online landscape is fnding information and assistance at the level of 'prosumer.' While there is a wealth of information designed for introducing consumers to new ideas, and a wealth of information that can by found by professionals, there is a missing-middle of information designed for consumers that have a base understanding of design but want to take action and improve their own environments.
While technologies that allow laypersons to run daylighting simulations or get information on the weather in their location are available, they often require a higher level of fne-tune adjustment before accurate results can be provided, and also often require downloading large software packages with high upfront licensing fees. One of the main purposes of Patterns for Health is to create a centralized location for many of these often utilized metrics, and to improve on the intuitiveness of accessing them.
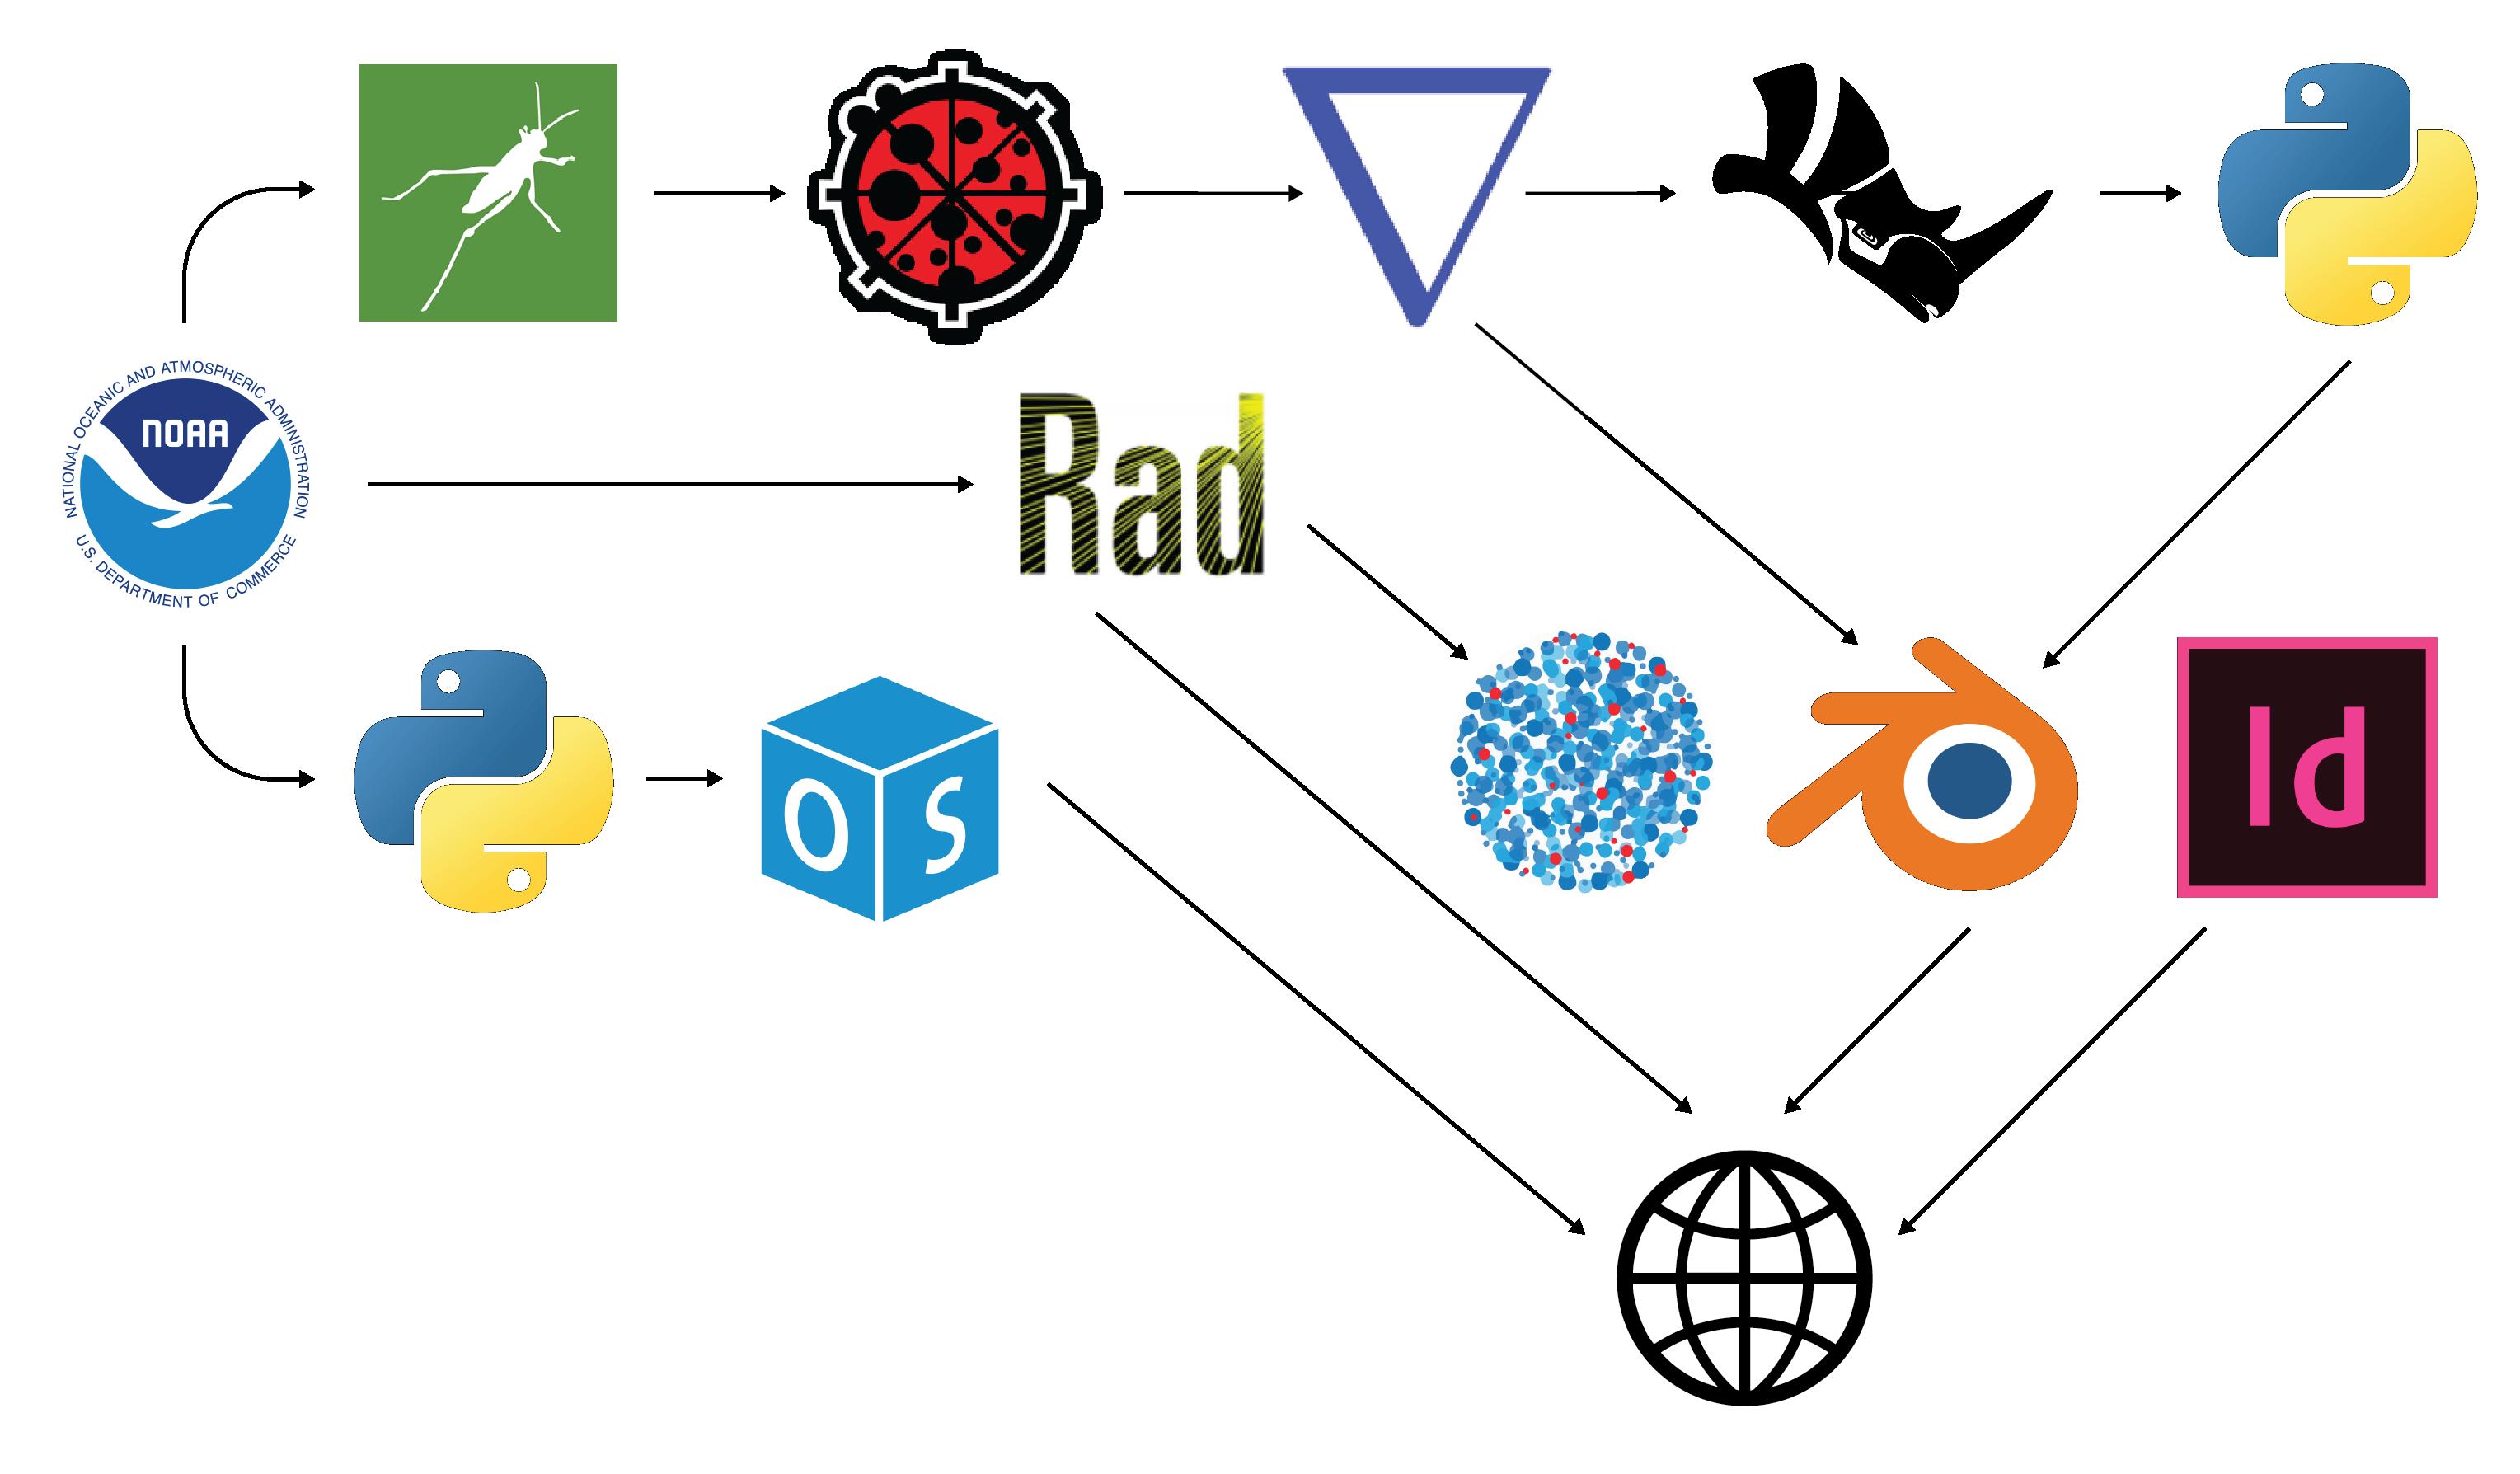
The pipeline that we have been working within attempts to leverage many of the industry standard technologies that architecture frms regularly use such as Radiance, OpenStudio, and NOAA weather data. This allows us to control the movement of the information behind the scenes using various Rhino/Grasshopper scripts and simplify the number of inputs that are needed. This also allows us to minimize the expertise that the enduser would need to have, but to continue to provide the accuracy and fdelity of information that a designer who is trained to use the base software could receive.
Starting with weather data from the National Oceanographic and Atmospheric Administration we utilize the Ladybug Tools plugin for Grasshopper to get relevant data regarding our location of study. This allows us to run OpenFoam with either real-world wind velocity information, or to run it with an assumed value but also incorporate realistic temperature and humidity information to each simulation. As OpenFoam creates and runs cases containing our chosen geometry and apertures, Rhino builds export-geometry that is scaled, rotated, and textured depending on the results and type of simulation. This geometry is automatically exported from Rhino and imported into Blender through a python script that has been tuned to minimize the complexity of the geometry, but still retain enough information for meaningful visualizations. Batches of frames or still images are then rendered out of Blender using a fip-book style setup to show data over time and minimize the amount of necessary hands-on assistance. The NOAA data is also formatted in python, and used to feed OpenStudio allowing us to generate datasets of temperatures, humidities, and other values needed to run comfort, daylight, and energy simulations for the overlays. Some of this formatted data is also needed for SafeAirspaces and Radiance in order to generate accurate calculations regarding health.
Finally, all of the data, images, and overlays are fed into the Adobe Suite to generate videos and grids of the still images for export and publication.
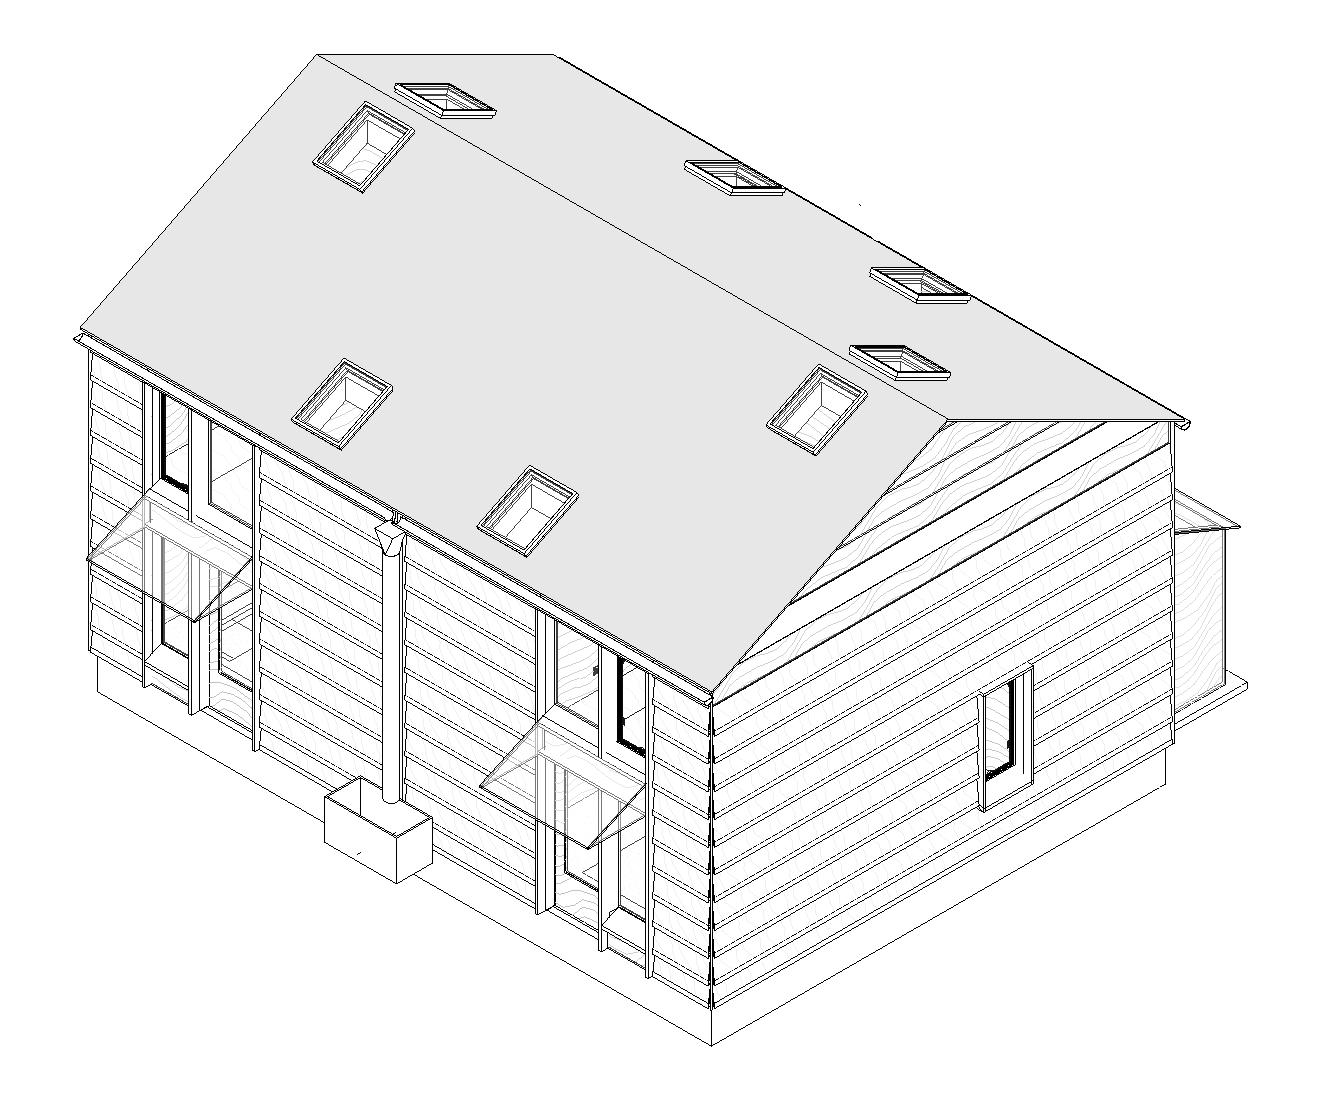
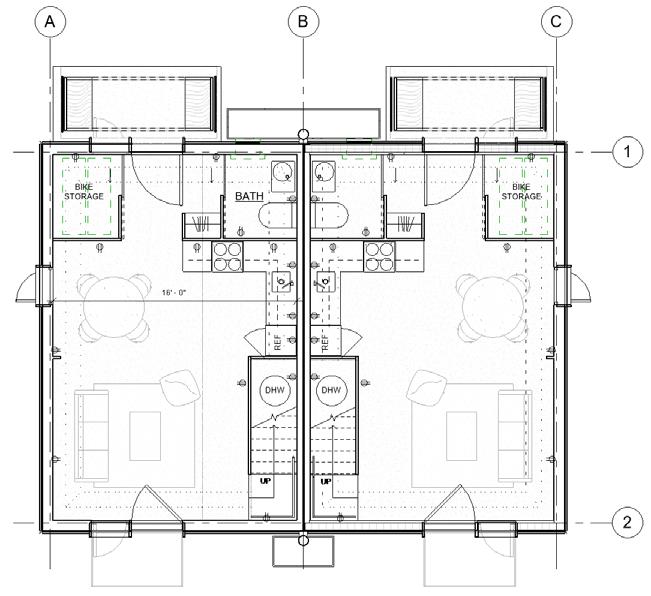
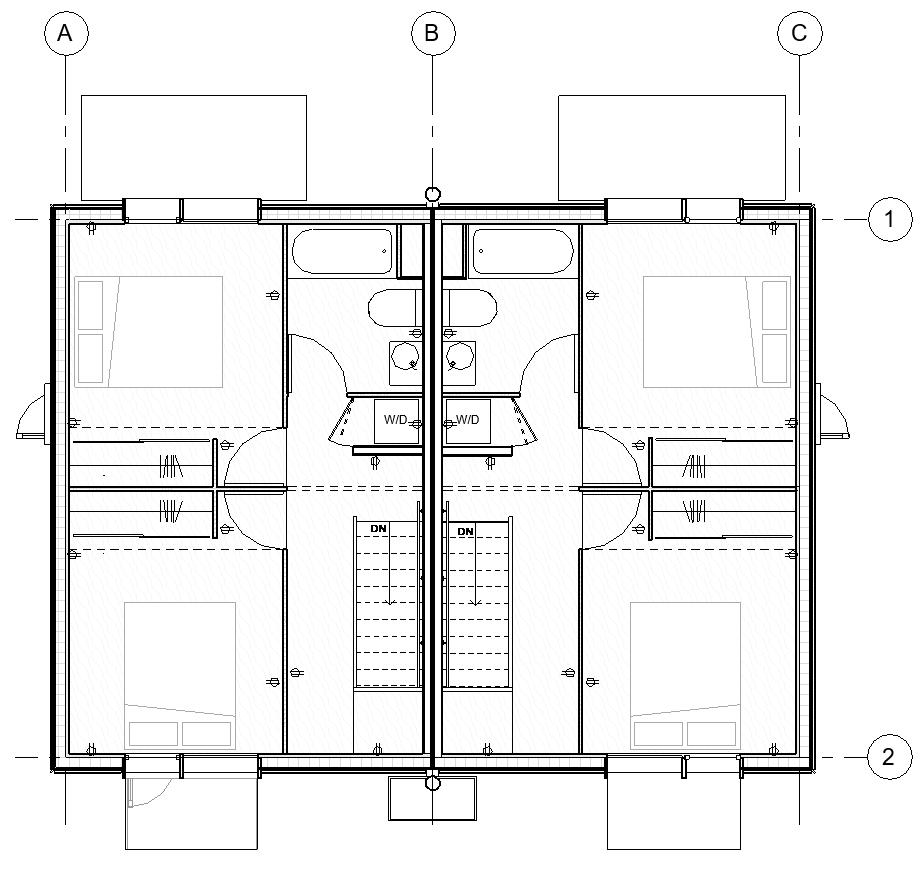
In the following pages we will be utilizing simplifed geometry of a duplex structure of approximately 60 square meters to create proof-of-concept simulations. This structure is designed as a typological case study home and is currently in preparation for construction documents, with the intention of a full-scale construction happening within Oregon in the coming years.
The structure contains two bedrooms, one and a half bathrooms, kitchen/dining, a living room, and has been ftted with several window and skylight confgurations. The possible cases are broken into fve separate confgurations:
· An upstairs cross ventilation case involving the two bedrooms and a portion of the hallway.
· A downstairs cross ventilation case with the operable front door and back door.
· An upstairs bedroom with the possibility of a skylight in addition to the existing window.
· A stack ventilation case involving the front door and a skylight above the centralized staircase.
· A whole-house scenario using all of the available doors, windows, and skylights.
The approximate areas of each case are as follows:
Upstairs Cross
Downstairs Cross
Upstairs Room
Stair Stack
Full House
32.5m² 25.5m²
9.3m²
34m²
60m²
By allowing the end-user to add or subtract skylights, open windows and doors, and designate specifc zones to test, we believe that we can provide a useful and powerful overview of how environmental, health, and comfort factors can be changed. This ability is also valuable for designers and students looking for instant feedback on how specifc combinations of inputs could promote a variety of lifestyle improvements.
Utilizing systems of inputs for controlled outputs
While our end goal has been to prototype an automated and interactive tool that allows users to quickly fip between diferent simulation cases, we quickly realized a simple system of parametric inputs would be a more realistic way to test the capabilities of our software. Each individual choice that we might allow a user to change as an input would quickly and exponentially increase the possibilities that would need to be simulated, and the complexity of the overall setup. To best keep track of each individual change, and number of total possibilities, we settled on a grid based method to store rendered images and automatically overlay calculated data using InDesign's data merge.
To make a manageable system for our frst attempt we designated the following as our inputs:
1 Location
1 Date
3 Wind Velocities
3 Wind Angles
3 Aperture Types
5 Room Combinations
Despite this relatively small number of input possibilities, the number of outputs still necessitated simulating, rendering, and calculating information for over 150 diferent possible situations.
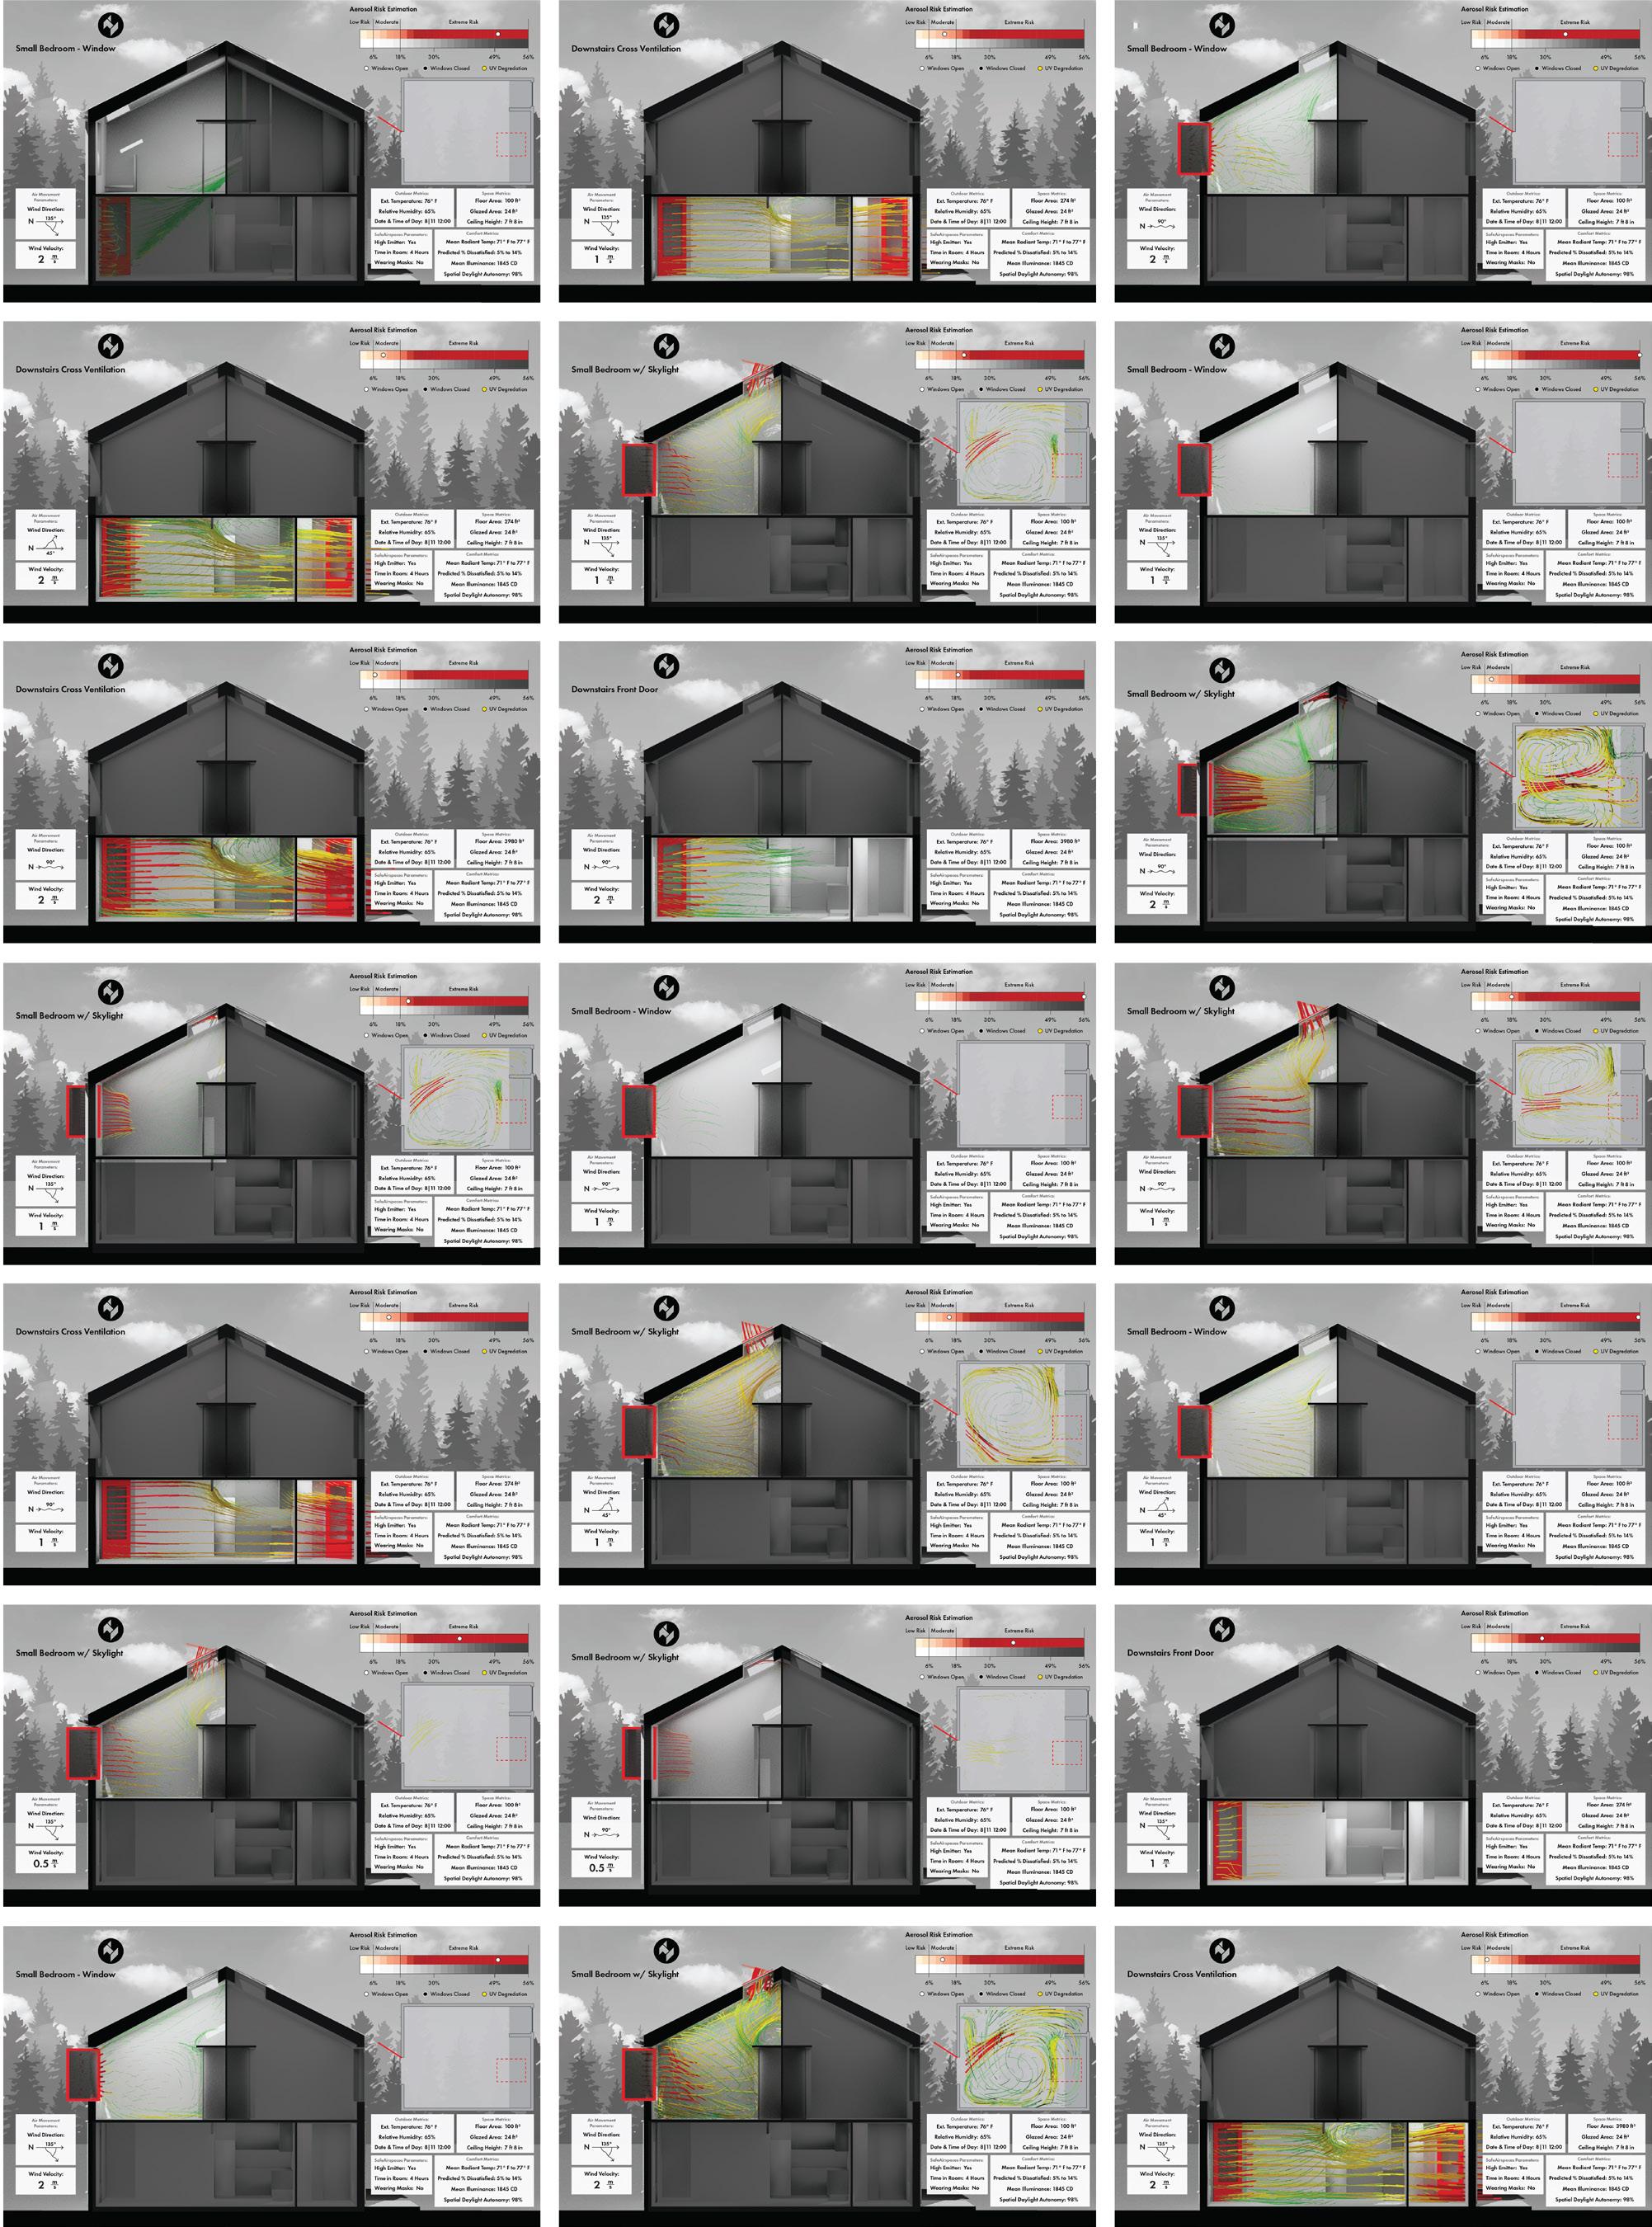
Wind velocity and direction - used to create inward pressure at the window boundary in OpenFoam. For the still images we used wind angles of 45°, 90°, and 135° and magnitudes of .5m/s, 1m/s, and 2m/s of sustained air fow.
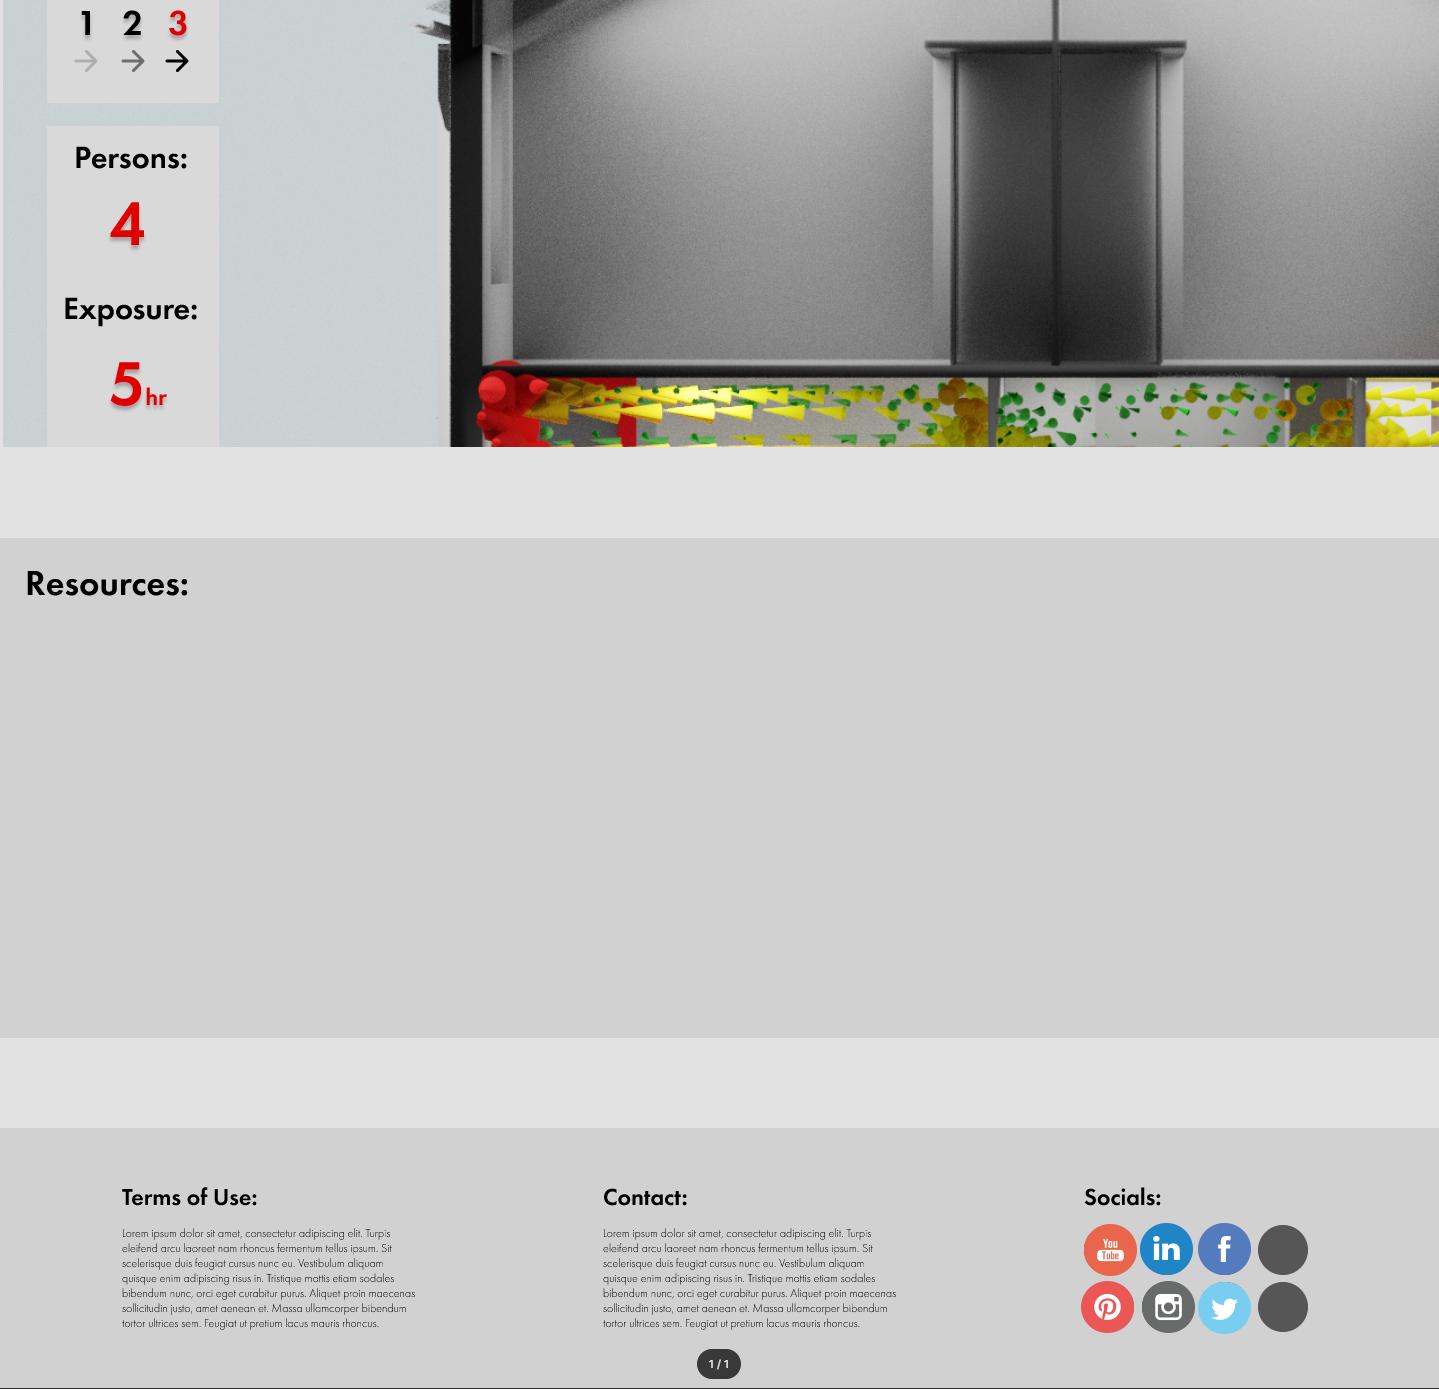
Call Tag:
Aerosol Risk Estimation:
SafeAirspaces calculation utilizing the parameters in the bottom right cluster. Changes based on indoor air-changes and is greatly infuenced by operability and number of apertures.
Plaintext showing case and aperture change - currently shows one of fve possible confgurations:
•Small Bedroom w/ Window
•Small Bedroom w/ Skylight
•Downstairs Front Door
•Downstairs Cross Ventilation
•Stack Closed
•Stack Open
•Upstairs w/ Window
•Upstairs w/ Cross Ventilation
•Full House w/ One Window
•Full House w/ All Windows
Outdoor Metrics:
Exterior temperature and relative humidity received from NOAA as the average daily value. Date and time are set to August 11th at 12pm for all still images.
SafeAirspaces Parameters:
A high emitter and a single receiver are assumed within the scene, each exposure is set to 4 hours and both inhabitants are assumed to not be wearing masks.
Space Metrics:
Floor area and glazed area change depending on the amount of rooms and apertures included in the simulation, ceiling height is constant in all simulations except for the stack case involving the downstairs door and the stairwell skylight.
Comfort Metrics:
Mean radiant temperature, predicted percent dissatisfed, mean illuminance, and spatial daylight autonomy calculated through OpenStudio using the NOAA sunlight information.
Benefts of animation
While numbers are always useful, they can often be difcult to fully understand without context. One of the main issues with metrics such as annual sunlight exposure or spatial daylight autonomy is the loss of fdelity when searching for simplicity. While it is powerful and useful to know whether a space will be appropriately daylit on a specifc day or over the course of a year, it can be just as important to know at what precise times too much light might enter the space or whether glare will be present at 2pm on an arbitrary Wednesday. The same is true for the simplifed and averaged data shown in the previous still images. While the ability to see vectors averaged and drawn throughout a feld is useful for understanding how air could move throughout a space, it loses the nuance and complexity of realistic atmospheric conditions and instantaneous changes. Thankfully, historic data is openly available and allows us to easily understand how air moved throughout a space on a specifc day, and how it could have moved throughout a space with a specifc change.
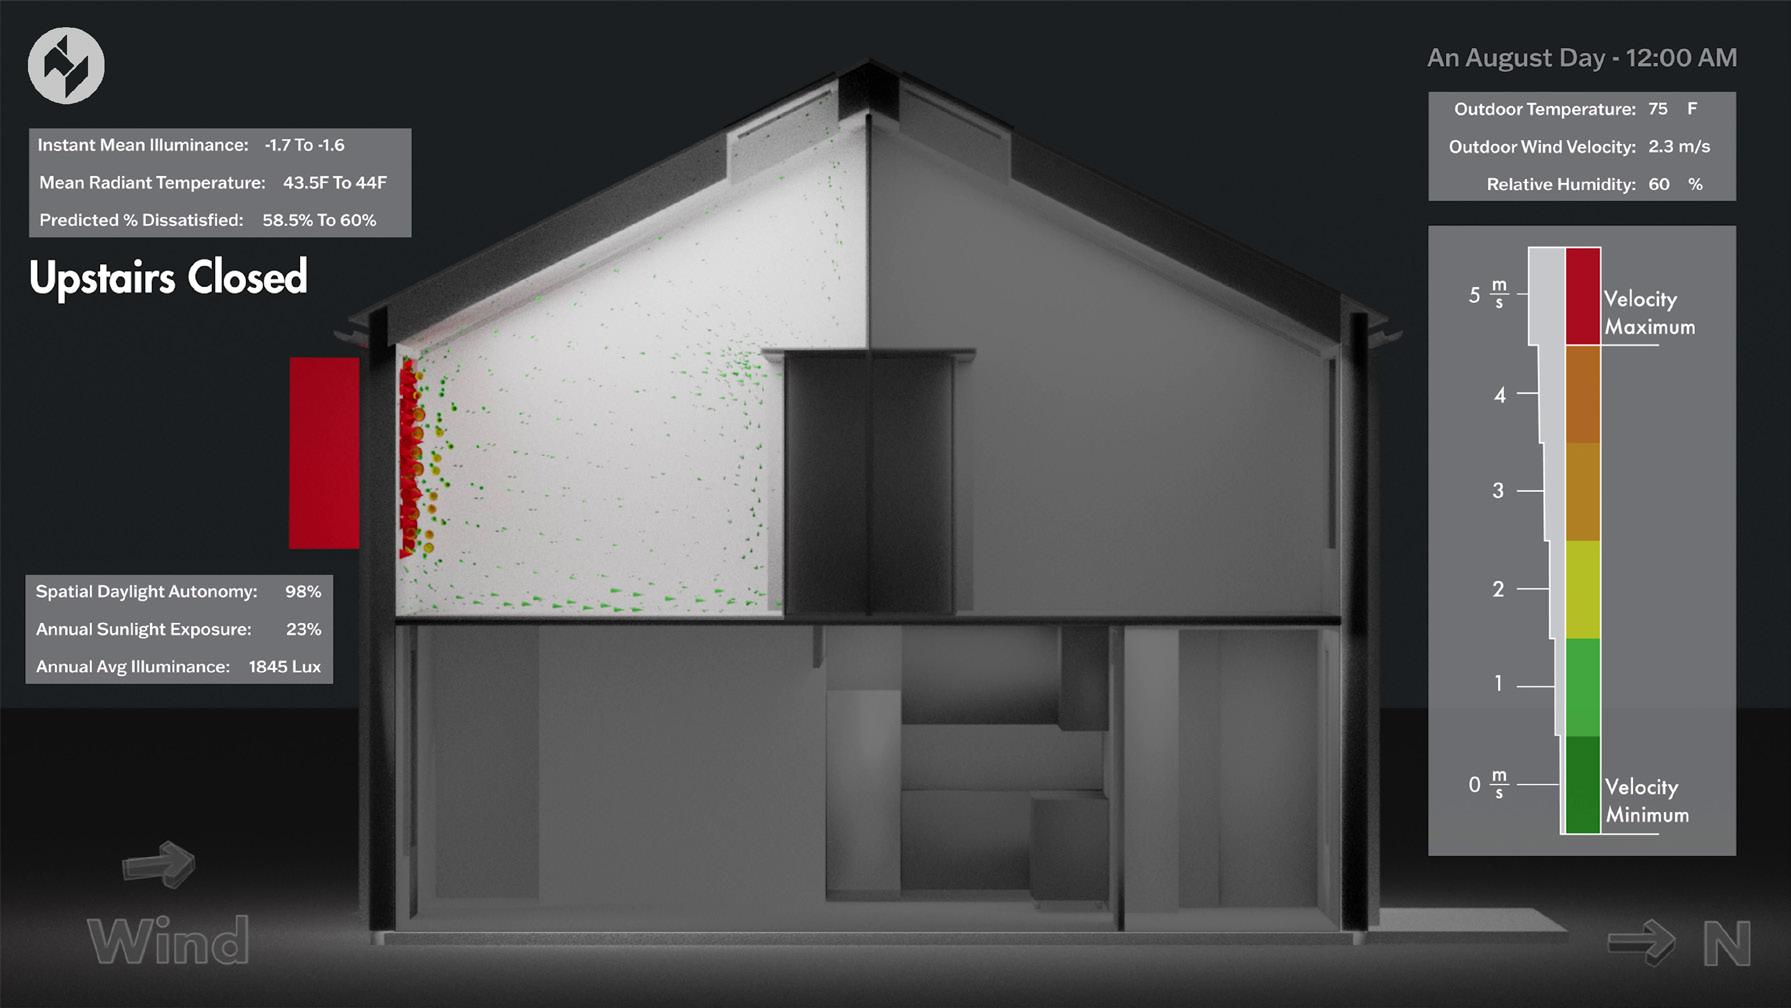
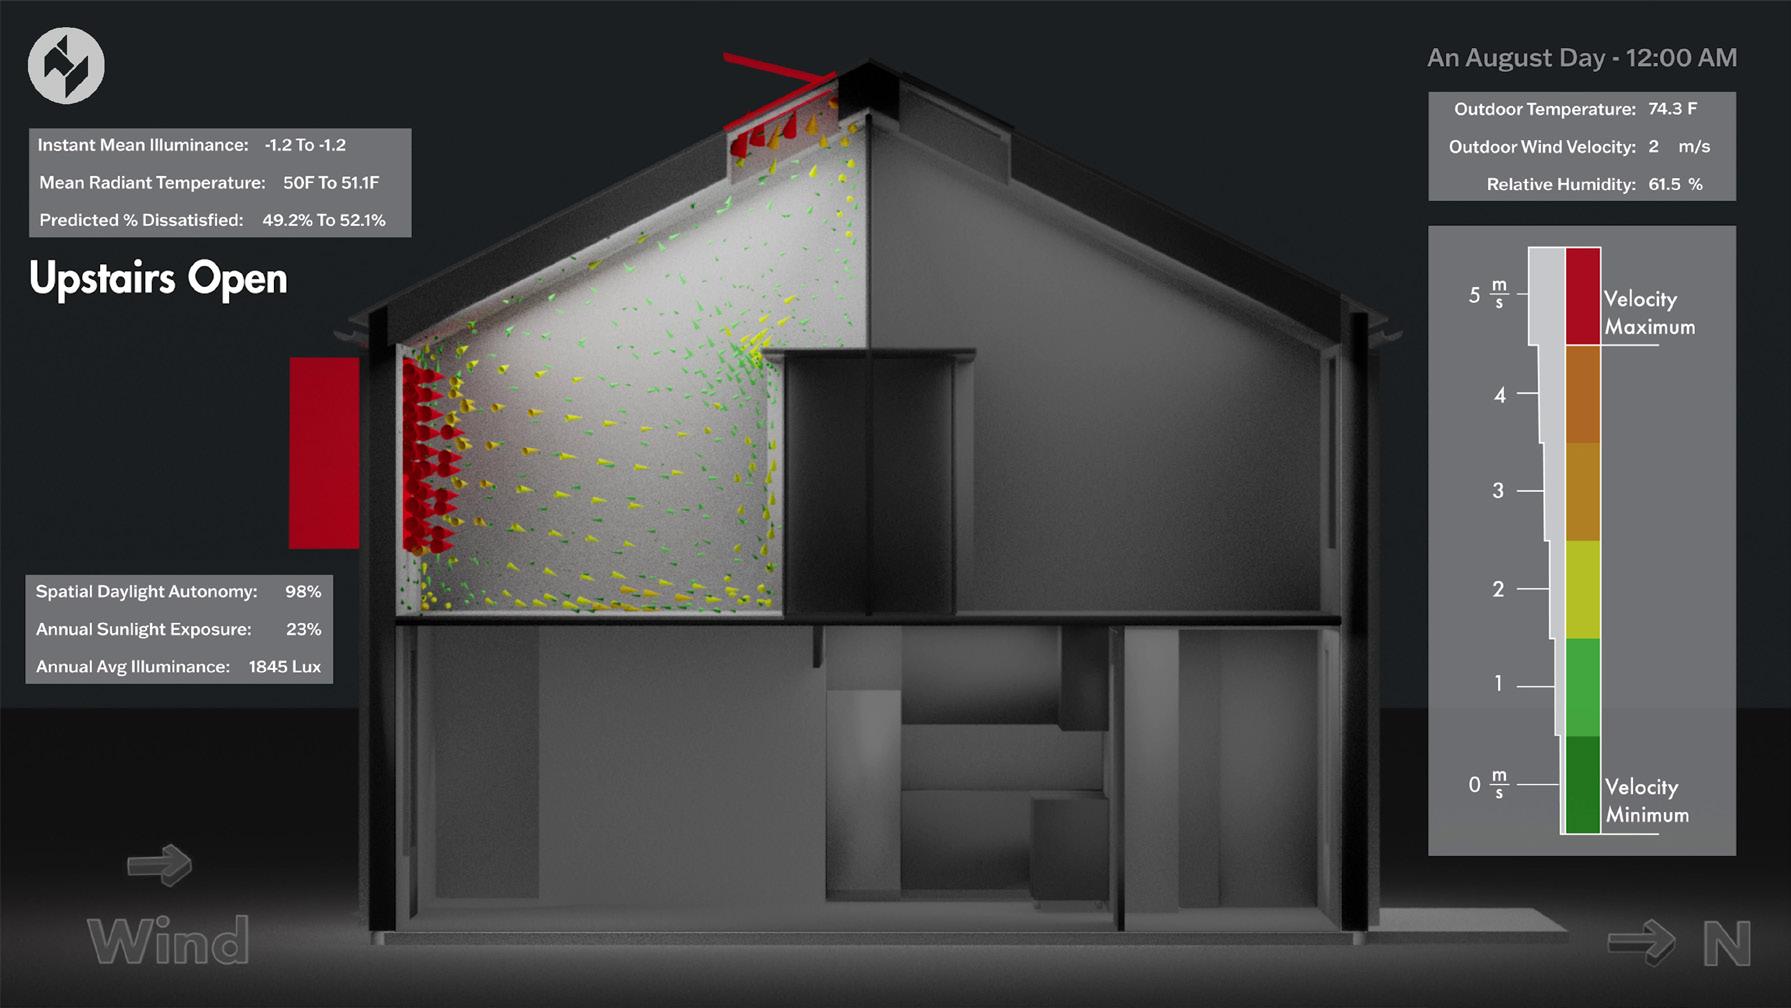
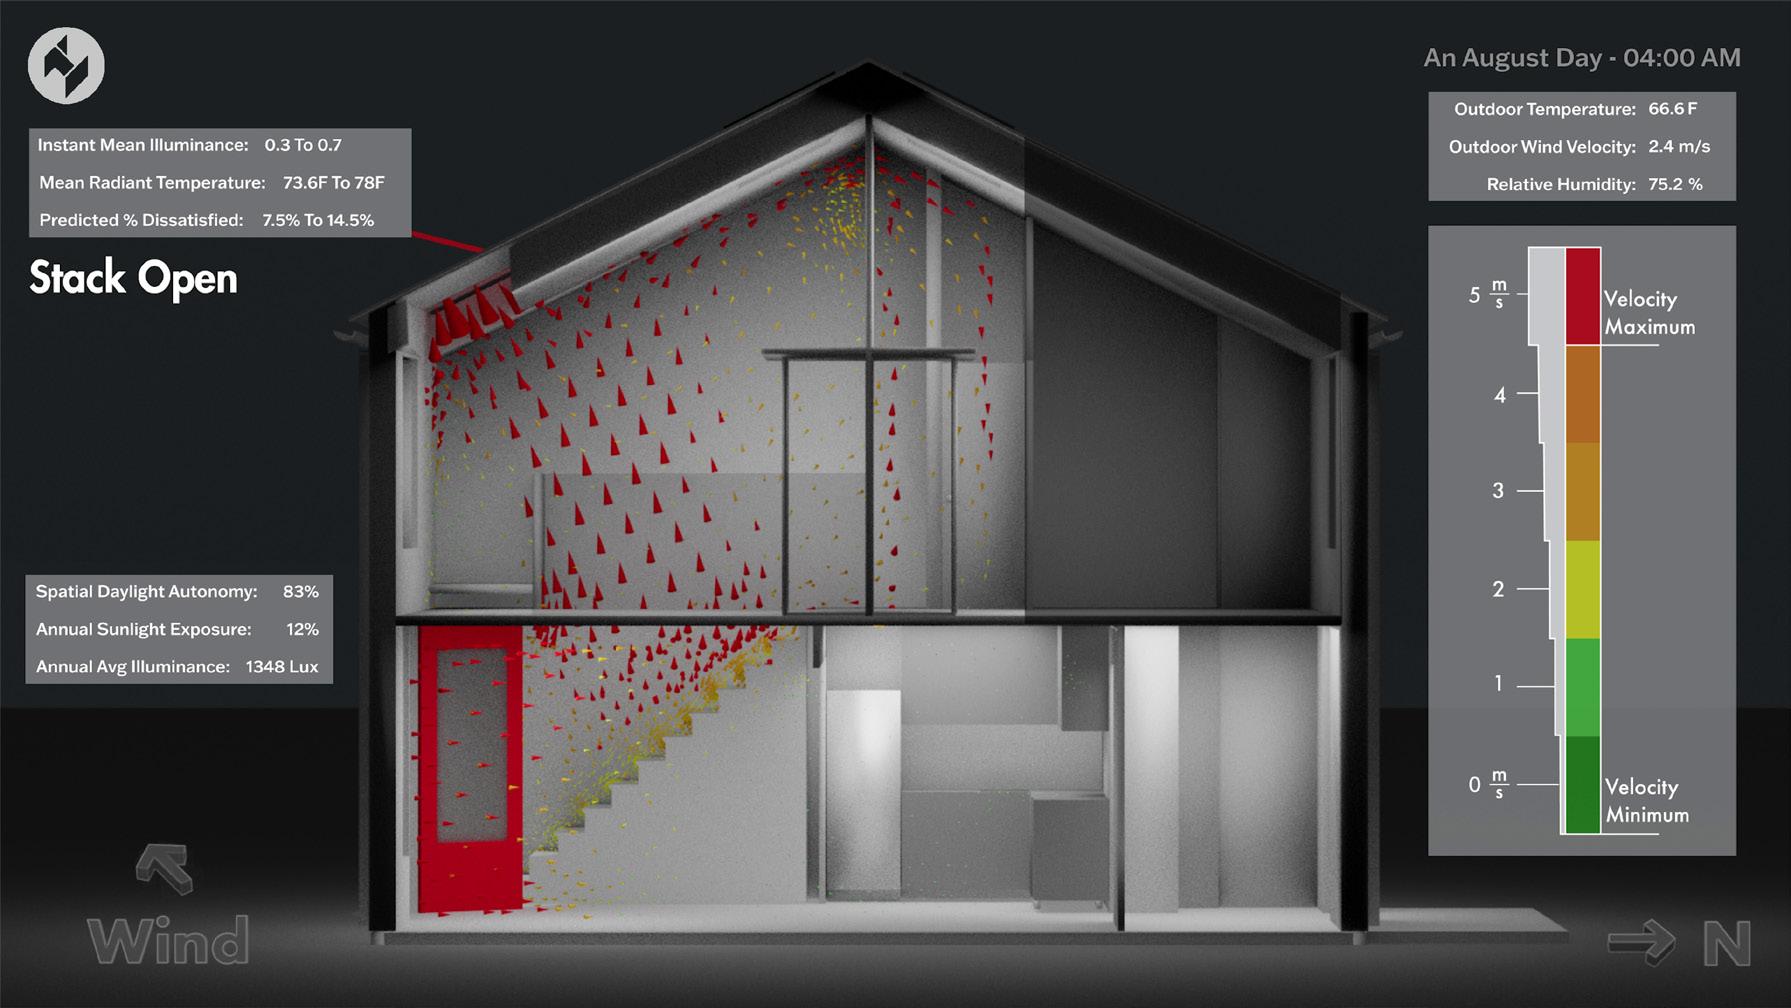
One of the main benefts of animating data is allowing the end user to see how aspects of a simulation change over time, and being able to provide instant feedback on how an individual action can completely change a situation. To best show the results of these simulations over time, we created a system to run CFD simulations at specifc time-steps throughout a specifc day and cross-reference the animation with other useful metrics. Instant mean illuminance, mean indoor radiant temperature, and outdoor metrics allow us to show how changes in the exterior realm can very quickly change the overall indoor climate.
Instant Mean Illuminance, Mean Radiant Temperature, Predicted Percent Dissatisfed, Current Case
Date Tag & Current Time of Day, Instant Outdoor Temperature, Instant Outdoor Wind Velocity, Instant Relative Humidity
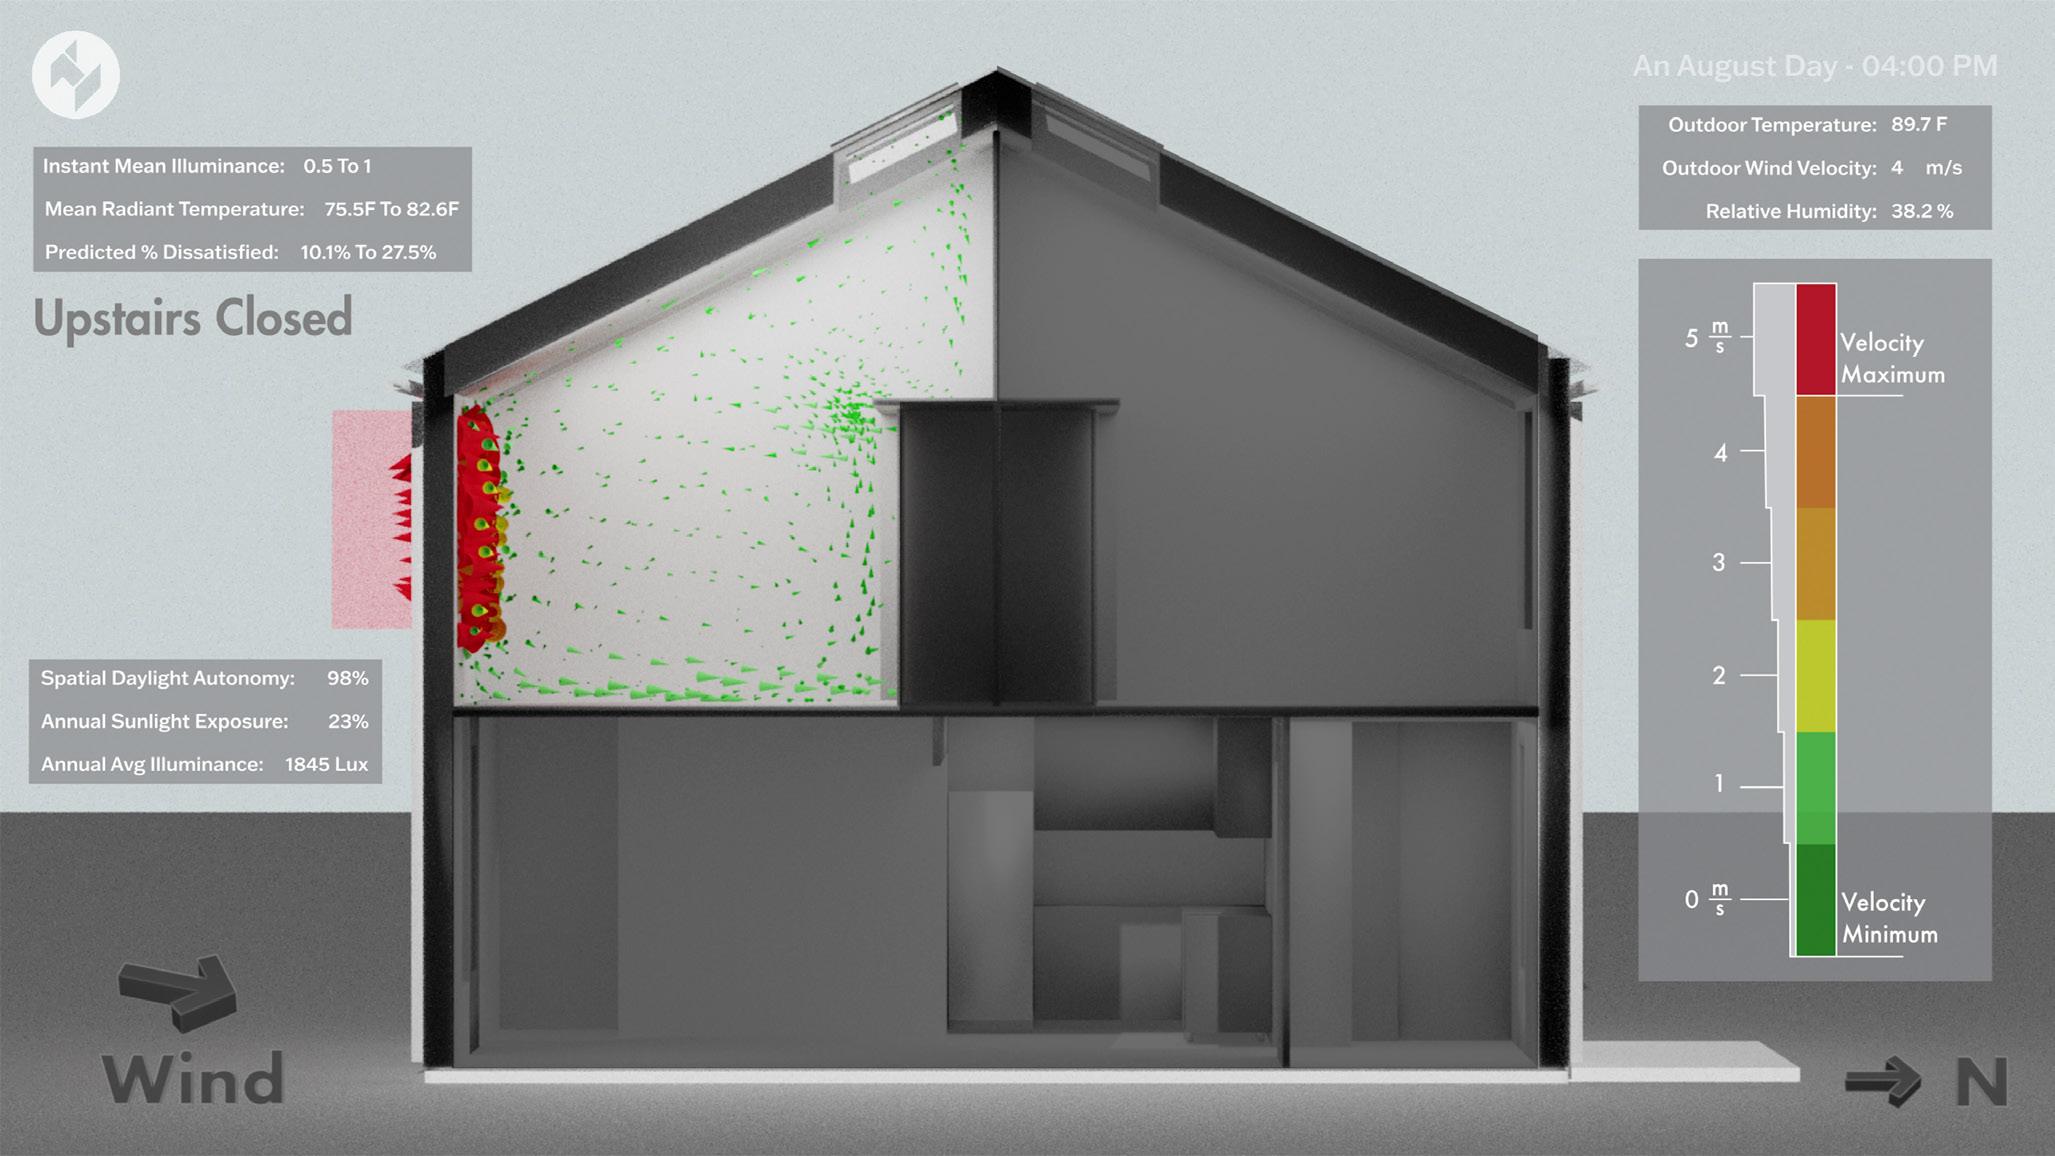
Spatial Daylight Autonomy, Annual Sunlight Exposure, Annual Average Illuminance
Color & Relative Scale: Shows how to quickly determine the true velocity, and relative velocity of the arrows in the scene.

Compilation:
This two minute video shows a variety of diferent simulation setups and the applicable data associated with each case. Most spatial models are shown with an open & closed version for cross reference.
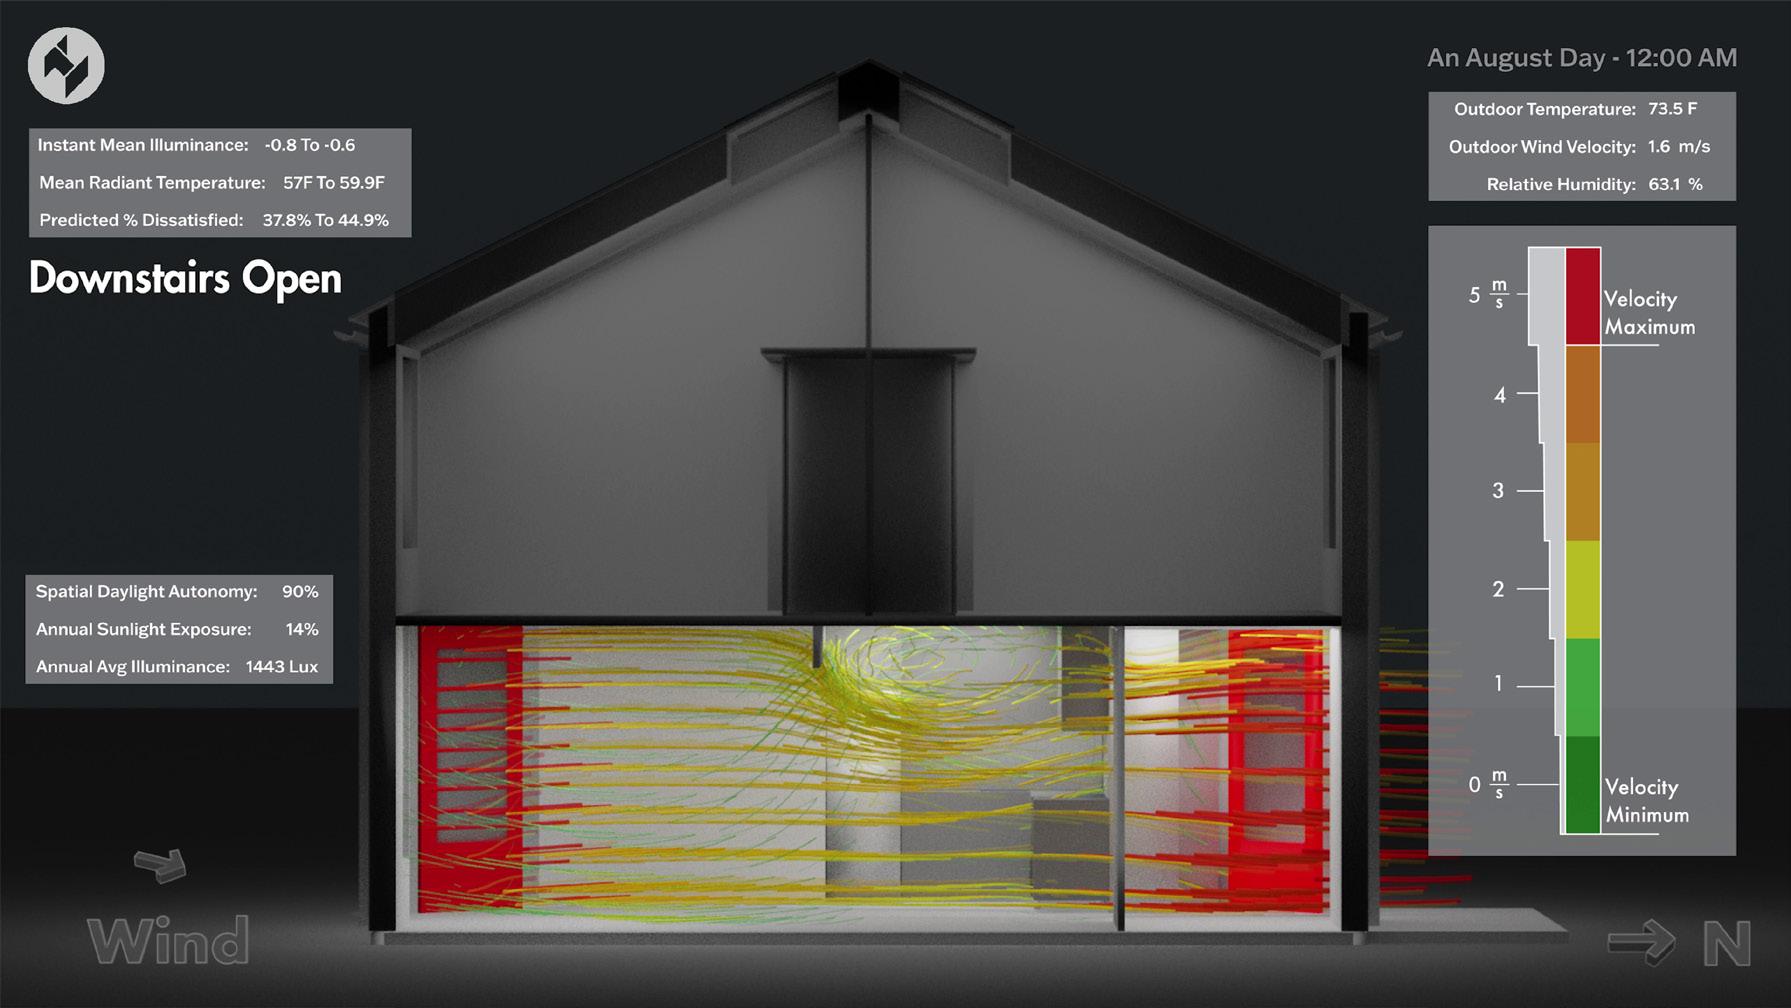
Alternative Visualization Style:
clip contains one of the
Utilizing systems of inputs for controlled outputs
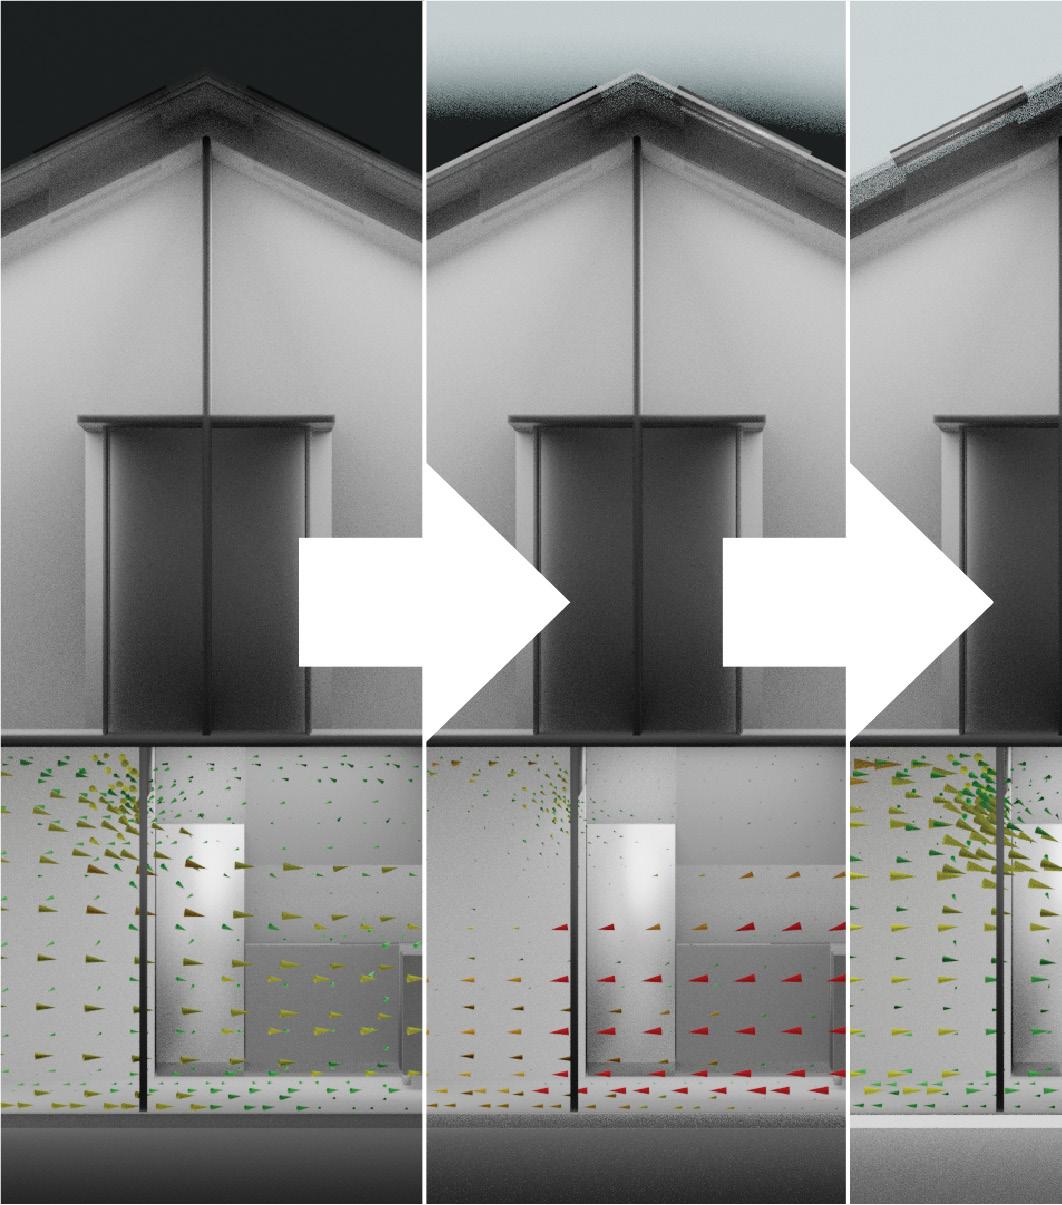
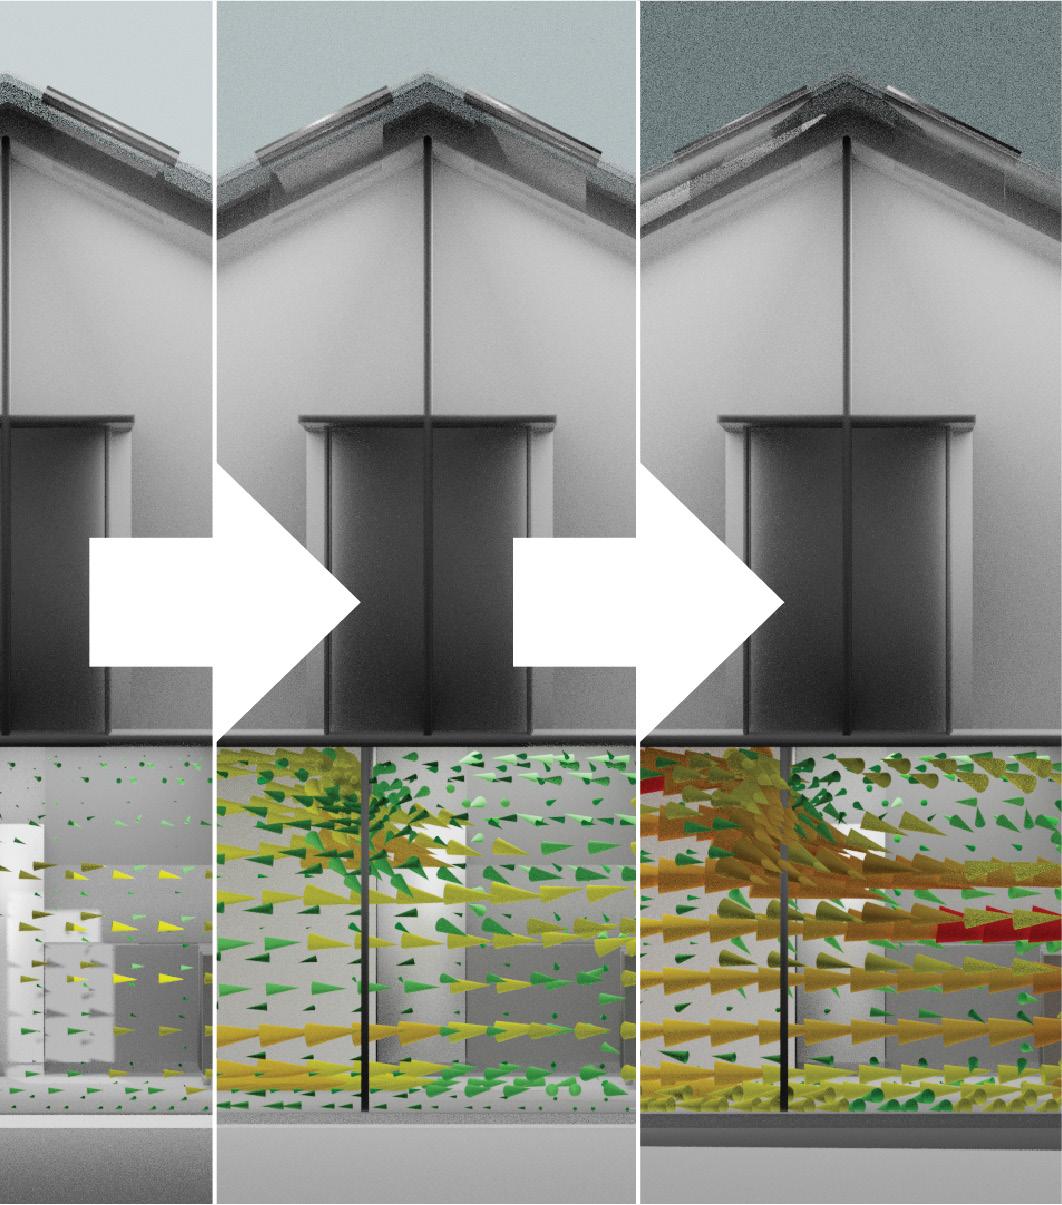
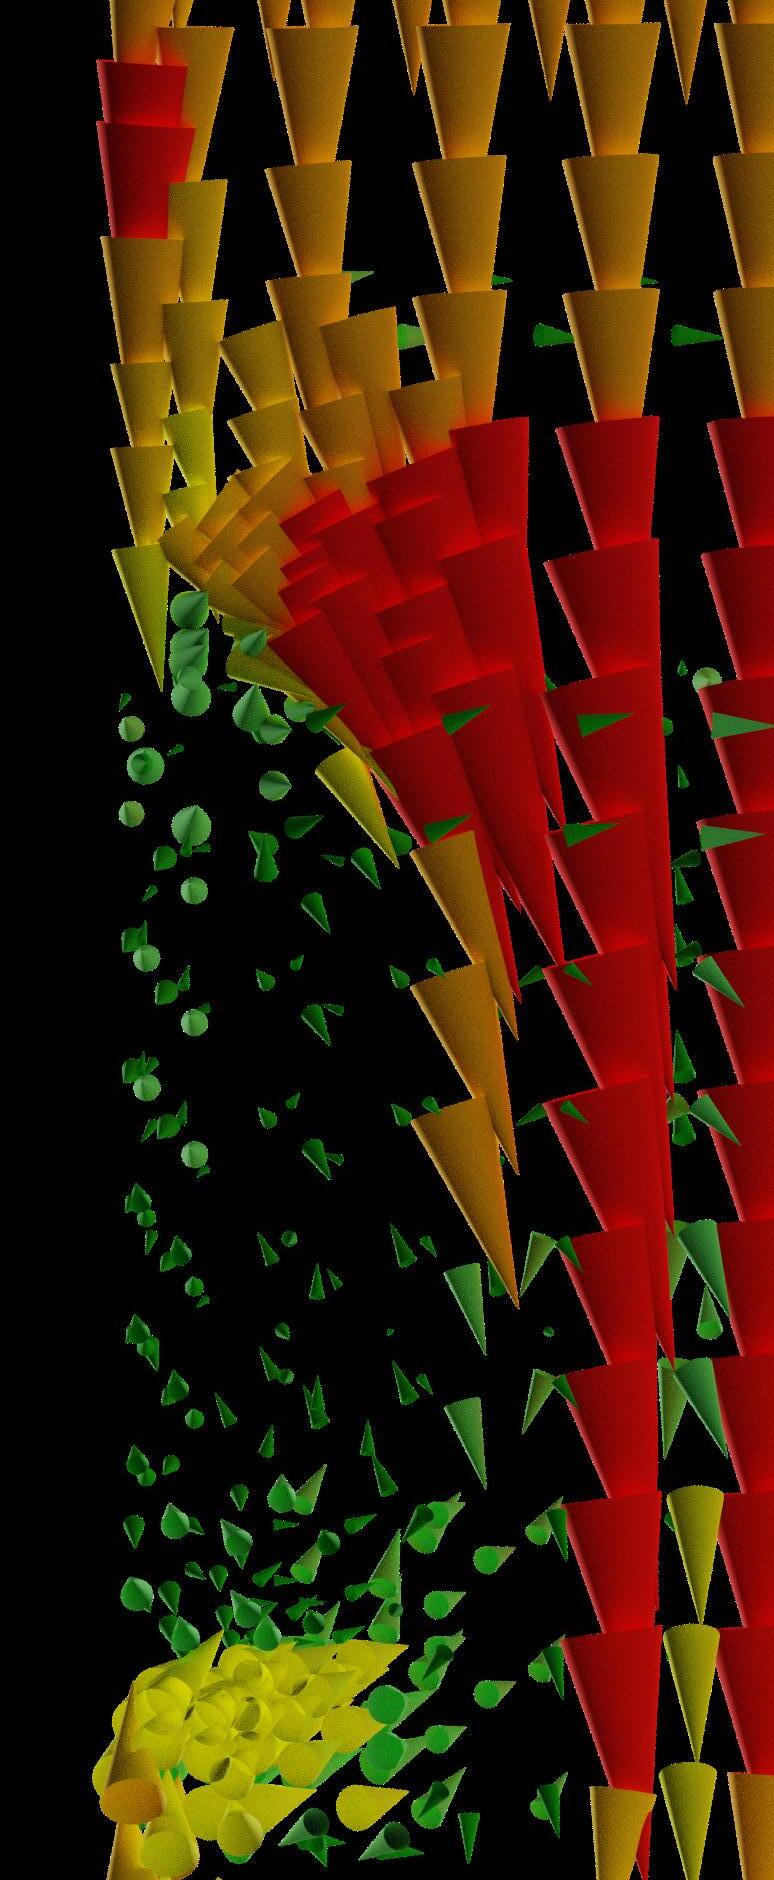
In conjunction with the creation of our CFD pipeline, the idea of combining this visualization style with our previous research on viral degradation from UV exposure seemed like an important step. The following simulations show how airborne particles in stagnant air would degrade over time when exposed to 3 types and intensities of light:
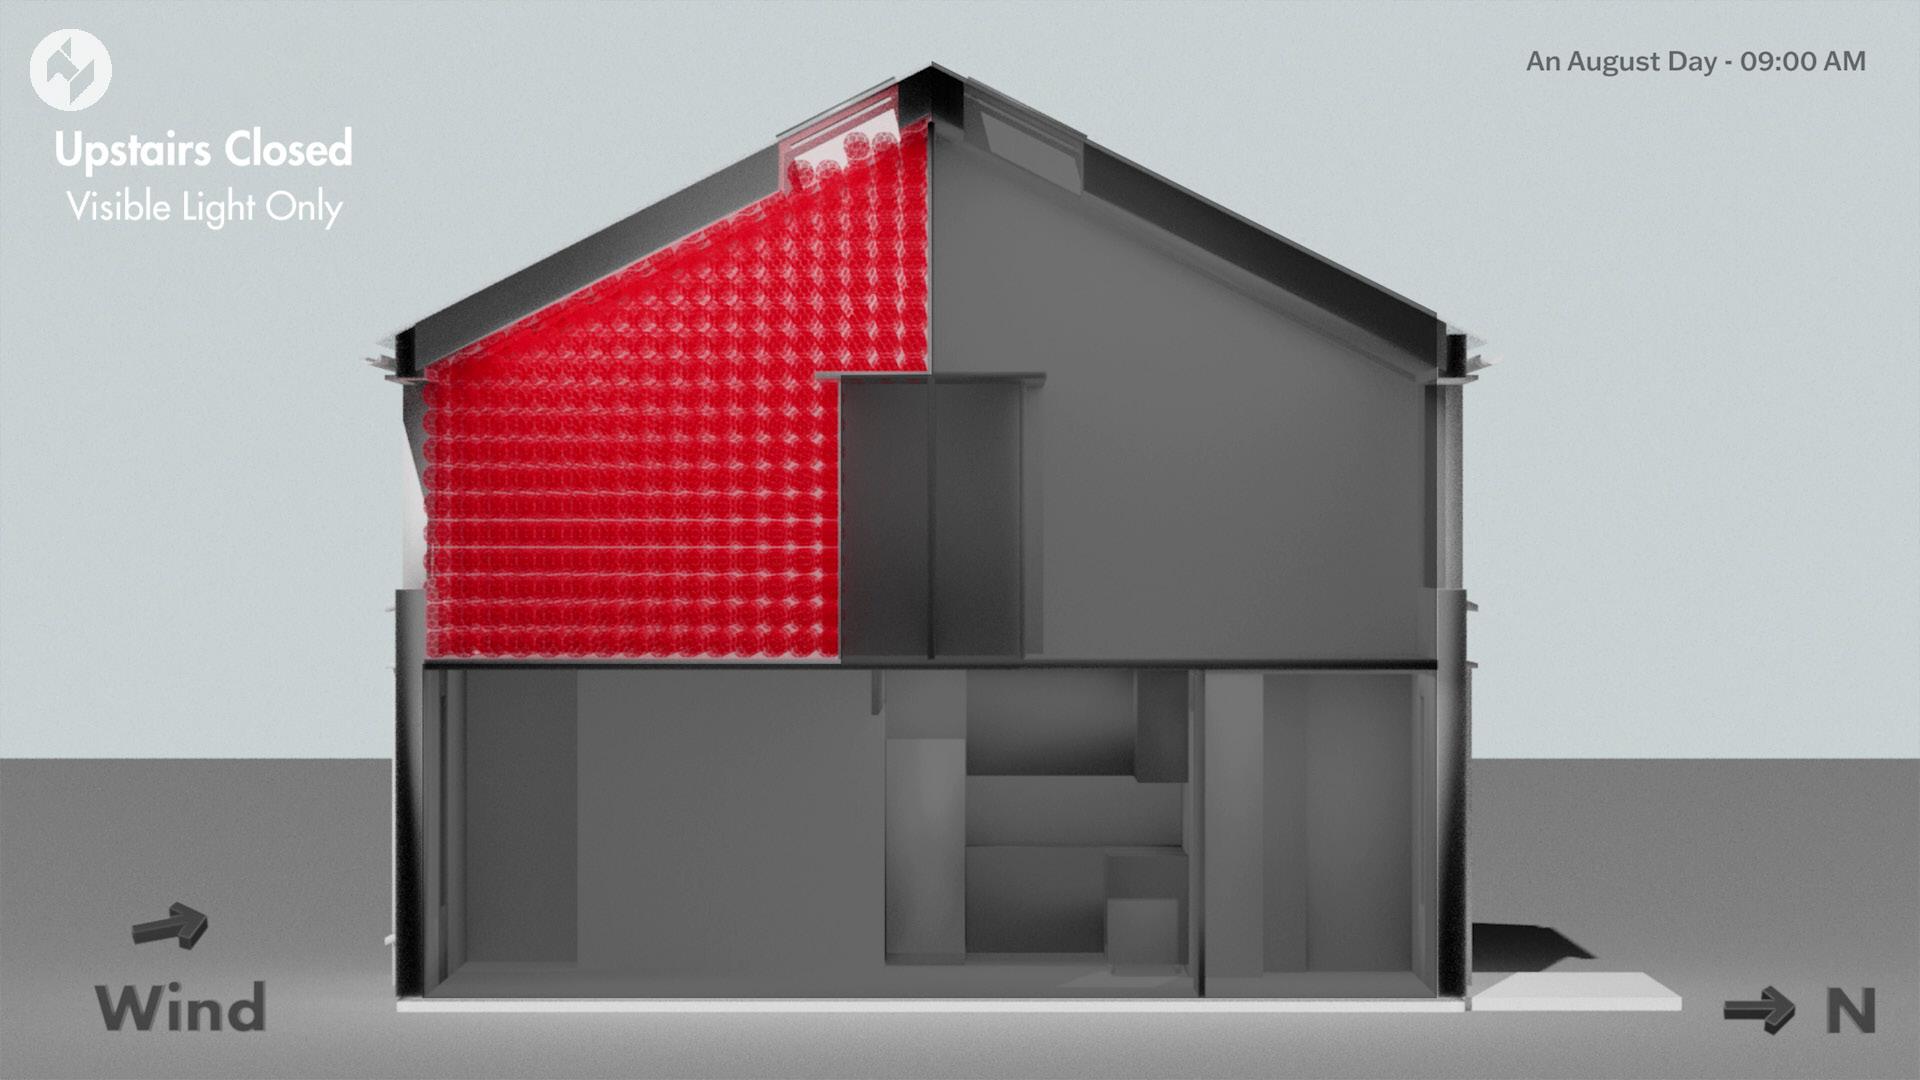
The frst clip shows exclusively visual light fltered through glass at the window and skylight; because of the relatively low power associated with this bandwidth, most of the virus would remain in the air - not accounting for natural decay over time.
The second clip shows visible and UV light fltered through the closed window and skylight. This simulation produces better results than the previous case, but is still unable to decay the majority of the airborne particles.
Finally, a third case shows visible and UV light but assumes that the window and skylight are fully open. This case allows for the majority of the airborne particles to fully decay by approximately 1 pm as the UV wavelengths aren't fltered out by contemporary window glass.
While we found it possible to calculate how sunlight can decay viruses on typical surfaces or in stagnant air, attempting to track how the virus would move throughout the air would provide a larger challenge. In future studies we believe that it will be possible to combine the UV decay of viruses such as Covid-19 with the particle tracking available in modern CFD softwares such as OpenFoam. The mathematics regarding this degradation is complex as it would require both understanding where each particle originates/travels, as well as how long each particle has been exposed to various intensities of UV light that itself changes with time and location of the sun.
What use is a tool that only a few can use?
Although this one structure simulated in a single climate allows for many important discussions and insights, the power of this pipeline is in its scalability. Creating an intuitive package for the scripts we have created would allow the insights of these various simulations to empower a new demographic of homeowners, designers, and students.
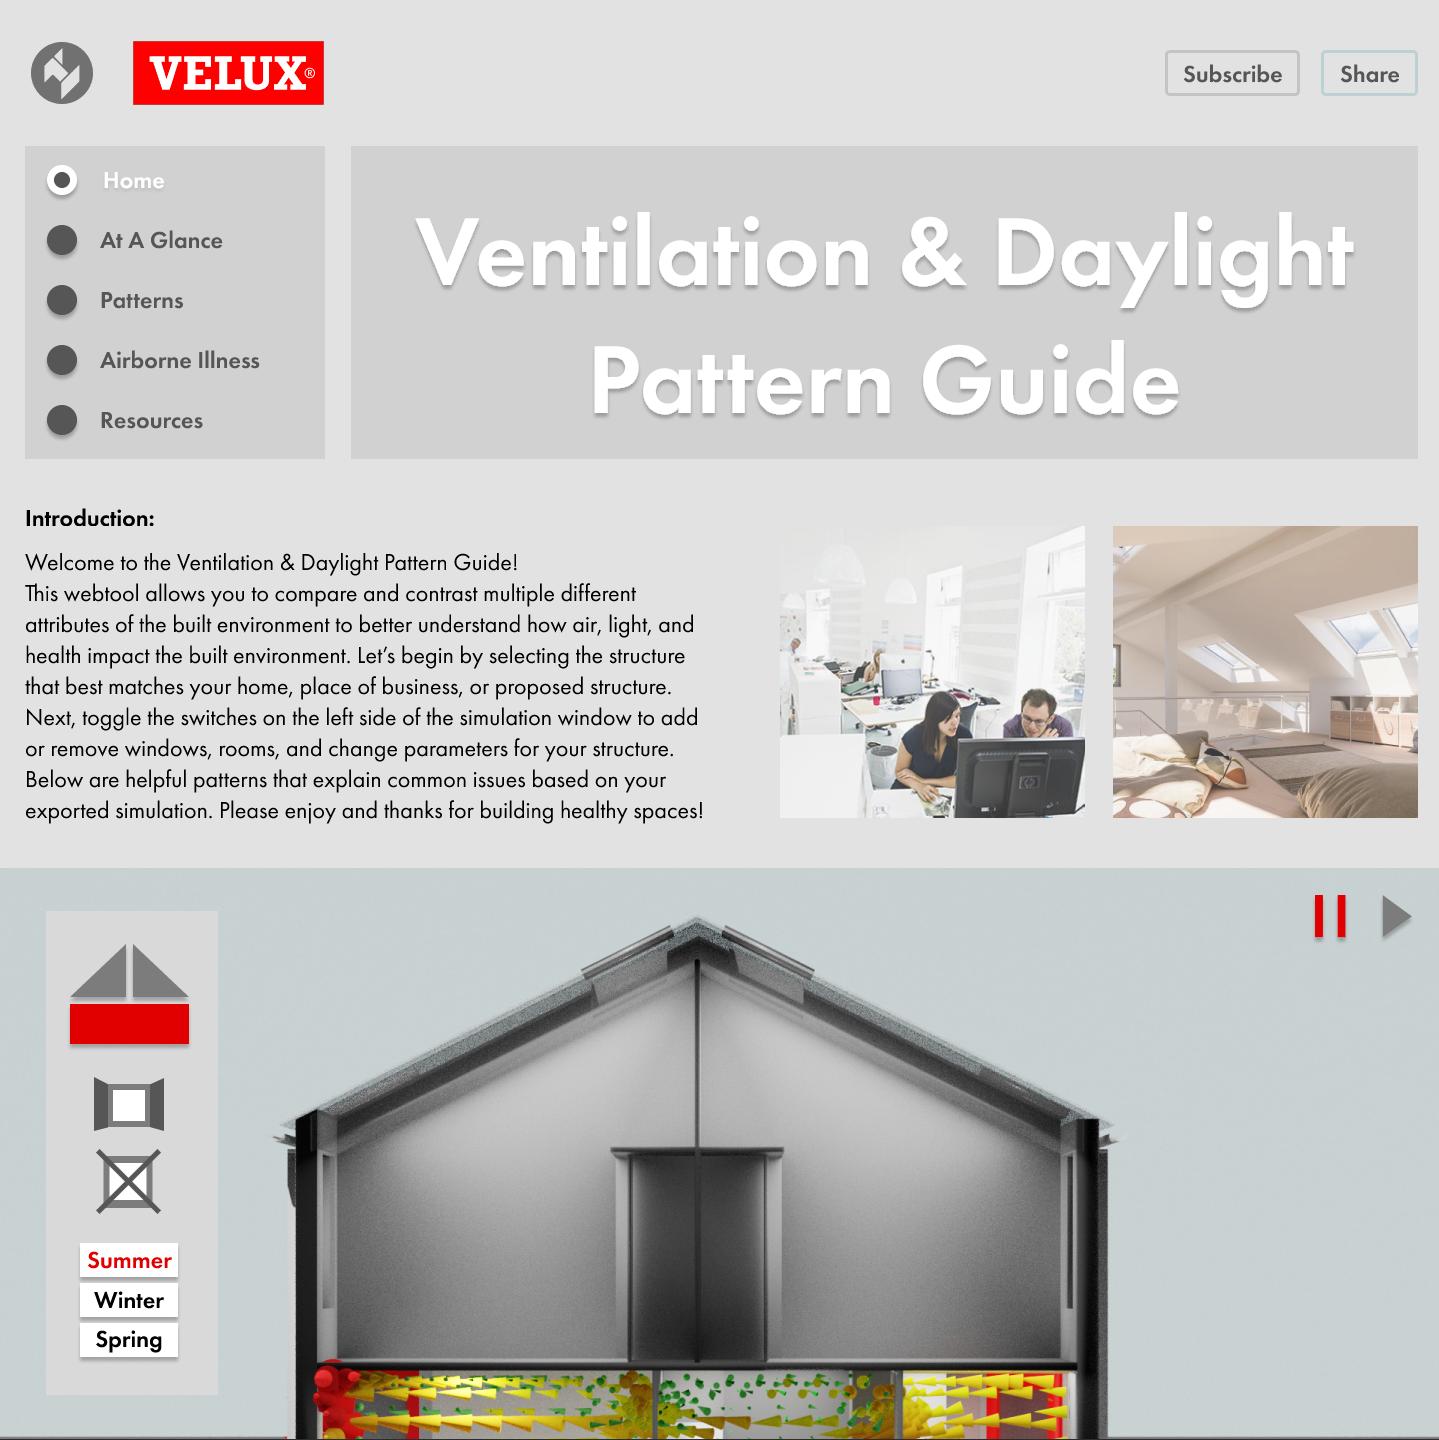
One avenue of output would be the creation of a web-tool allowing the viewing of the existing visualizations, and creating a repository that could host more geometries, locations, and situations into the future.
Another possibility would be in creating a separate piece of software that could be available for download. While this would put more computational expectation on the end-user it would also allow for more freedom and opportunity on their end. This option would also require
a heavier investment in creating a stable and quality controlled software suite capable of giving useful feedback to the user in the event of a failed run or unexpected result.
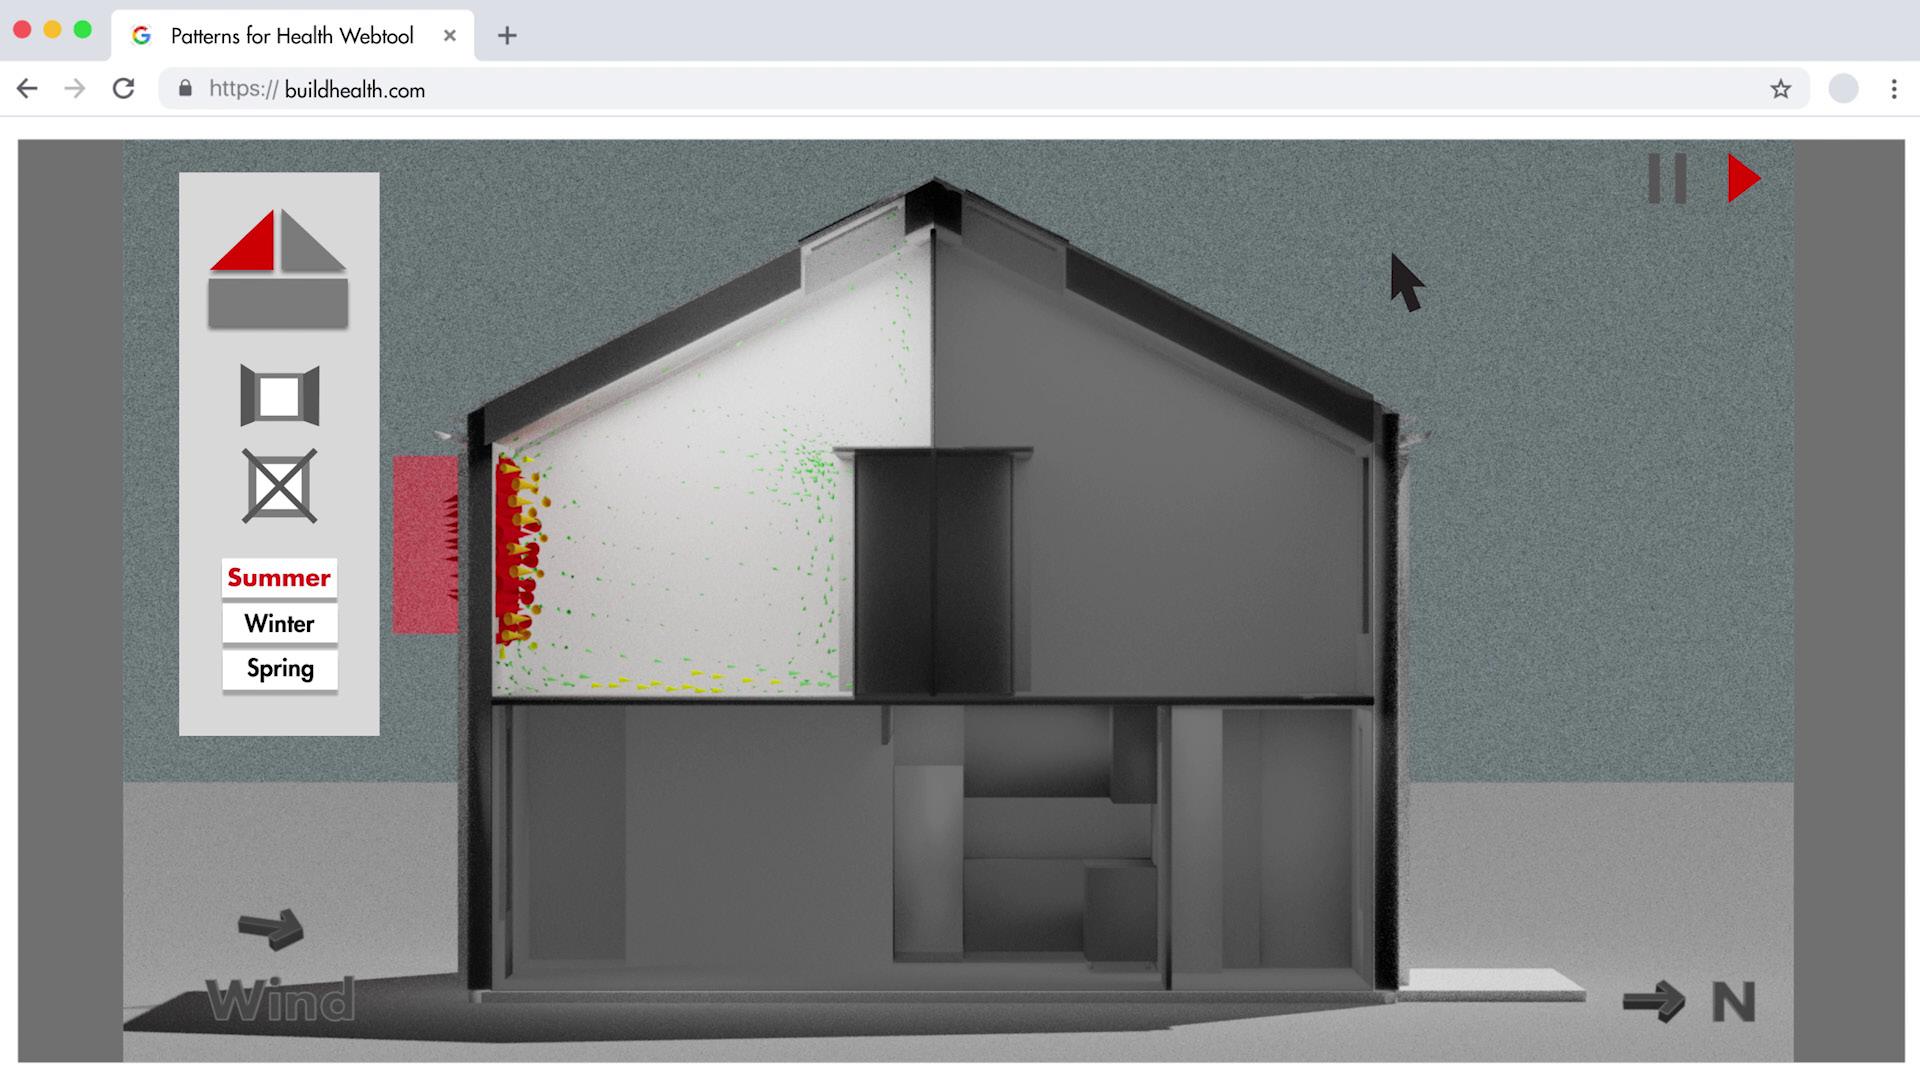
The following video clip loosely shows a possible UI/UX solution for viewing prerendered content in a web setting similar to that of the last fgure. The content shown is heavily simplifed from what is shown in previous clips, but could easily provide the same information and even the possibility of exporting results.
There are many benefts to prerendering content as it would allow a higher level of quality control, instant feedback based on changes and toggles, and reduced simulation hours and infrastructure costs. The main detriments would be the lack specifc control allowed to end-users for inputting structures and climates.

Isaac Martinotti
Research Assistant, Bachelor of Architecture University of Oregon, Eugene
Isaac is a recent graduate from the University of Oregon with a Bachelor of Architecture degree. Currently working for the Institute for Health in the Built Environment, he utilizes his abilities in computational design to assist the lab in creating tools for architects and consumers to utilize energy studies in dayto-day life. Much of his recent work as an associate researcher in Eugene has centered around visualizing data created through academic research for public consumption, creating informational material for health ofcials, and assisting in the publication of academic papers. Recently accepted into a Master of Science in Computational Design program at Carnegie Mellon, he hopes to continue the foundation that he has created at the IHBE and work to spread the importance of efciency and human-centric qualities fostered in the lab to his future endeavors.

Alen Mahic
Research Associate, Institute for Health in the Built Environment, University of Oregon, Eugene
Alen Mahic is a Research Associate at the University of Oregon Energy Studies in Buildings Laboratory (UO-ESBL). He is an alumni of the University of Idaho M.Arch program and its energy efciency laboratory, the Integrated Design Lab in Boise, ID, USA. Over the past decade his focus has primarily been on ways we can bridge the gap between academic research and practical application of digital daylighting simulation, building energy simulation, and visual comfort and glare analysis methods. This includes developing automated simulation workfows centered around the state-of-the-art Radiance suite of daylighting tools and the EnergyPlus whole-building energy simulation engine. These workfows have been applied in numerous research and technical assistance projects in collaboration with other academic institutions and private industry partners through the Institute for Health in the Built Environment (IHBE).

This work is copyrighted by the University of Oregon and provided under a CC BY-NC-ND 4.0 license. To view a copy of this license, visit http://creativecommons. org/licenses/by-nc-nd/4.0/ Please contact techtran@uoregon.edu if you would like additional permissions to use the materials.

Kevin Van Den Wymelenberg
Associate Dean of Research & Facilities for the College of Design, Director, School of Architecture, University of Oregon, Eugene
Kevin Van Den Wymelenberg is a Professor of Architecture at the University of Oregon, the Director of the Energy Studies in Buildings Laboratory in Eugene and Portland, Ore, and CoDirector of the Biology and the Built Environment Center. He has a PhD in the Built Environment from the University of Washington. He teaches classes in daylighting, integrated design principles, energy performance in buildings, and design. Ven Den Wymelenberg has consulted on several hundred new construction and major renovation projects with architects and engineers regarding daylight, energy in buildings, and indoor environmental quality since 2000. Five of these projects have been recognized with AIA's Committee on the Environment Top 10 Awards and many others are LEED certifed. He has presented at many conferences including the National Academy of Sciences Engineering and Medicine, the Illuminating Engineering Society, LightFair International, and Passive Low Energy Architecture. He has authored several papers and two books related to daylighting visual comfort, and low energy design strategies. Kevin is the Chair of the IESNA's Daylight Metrics Committee and co-author on IES document LM-83 that serves as partial basis for the LEED V4 Daylighting Credit.

Mark Fretz
Institute for Health in the Built Environment University of Oregon, Portland Research Assistant Professor, Department of Architecture
Mark Fretz is a Research Assistant Professor and Interim Director at the University of Oregon’s Institute for Health in the Built Environment in the Department of Architecture. Prior to studying and practicing architecture, Mark spent a decade as a clinician with the U.S. Public Health Service and has transitioned from investigating oral microbiomes to building microbiomes and architectural design. As a designer, researcher and former clinician, he synthesizes this diverse background to facilitate knowledge exchange between the Institute’s Build Health, research labs, external collaborators and community. His research focuses on exploring design strategies that optimize human health while reducing energy use and carbon in the built environment. An important theme in this exploration is understanding how human migration from outdoor to indoor dwelling has afected evolutionary mechanisms connected with health and how architectural design can restore these relationships.