This report contains certain forward-looking information. In preparing the Budget Report, certain assumptions and estimates were necessary. They are based on information available to management at the time of preparing the budget. Users are cautioned that actual results may vary. Throughout the text in this report, financial values have been rounded to the nearest thousand unless otherwise stated.
Land acknowledgement
Brock University acknowledges the land on which we gather is the traditional territory of the Haudenosaunee and Anishinaabe peoples, many of whom continue to live and work here today. This territory is covered by the Upper Canada Treaties and is within the land protected by the Dish with One Spoon Wampum Agreement. Today, this gathering place is home to many First Nations, Métis and Inuit peoples and acknowledging reminds us that our great standard of living is directly related to the resources and friendship of Indigenous people. brocku.ca/indigenous/
Message from the executive leadership team
We are pleased to present the budget plan for 2024-25. Recognizing the generational challenges facing the post-secondary sector in Ontario, we commend the Brock community’s collective efforts to confront these fiscal circumstances with realism, creativity and a willingness to prioritize the sustainability of Brock’s mission.
Our community is resilient and we have much to look forward to in the coming year. We will seize the opportunities presented by the challenges we face to come together as a community, to celebrate our many accomplishments, and to reflect and build on what makes Brock a fantastic place to study, live and work. We thank you for your ongoing support as we continue to forge a path for our institution.
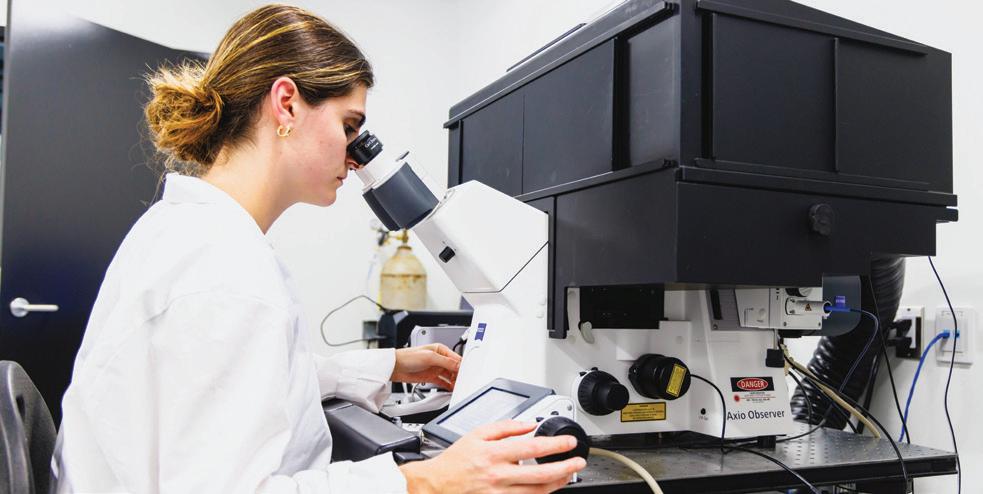
Launched in 2023 in consultation with the campus community, Brock’s Academic Plan is guiding our teaching and learning priorities as we look to refresh the Institutional Strategic Plan in 2025. We are unwavering in our commitment to providing an excellent, future-oriented education experience, one that is accessible, flexible, student centred, and is equitable, diverse and inclusive. Advancing research priorities and building research capacity across the University is a steadfast focus. This year, Brock is anticipated to receive the highest-ever level of TriAgency funding in the institution's history. Additional significant areas of research focus in 2024-25 include a full launch of the Clean Agriculture for Sustainable Production Field Infrastructure Farm project and of the Validation, Prototyping and Manufacturing Institute (VPMI).
Ontario universities are facing unprecedented financial sustainability challenges as a result of government policies, and we recognize it is up to us to continue to operate within these constraints. Revenue options will remain highly regulated despite the advice of the Blue-Ribbon Panel, which recommended a 10 per cent increase to base grant funding as well as flexibility on tuition rates to recognize the realities of rising costs. We must work together and continue to find new ways of delivering our outstanding programs within our means. Our sustainability is dependent on our capacity to innovate. For example, the 202425 budget year will see the first students entering Brock’s new undergraduate Engineering programs, with more programs coming online in the next few years able to welcome a growing number of future engineers. Brock’s Professional and Continuing Studies continues to grow apace, with the number of new offerings increasing significantly beginning in 2024. Our 2024-25 budget is the first year when this new initiative is planned to almost break even, with expectations that it will generate profits to support the institution programs in future years.
Despite the challenging external circumstances facing it, Brock continues to grow. We should be proud of the service we offer our students and the broader Niagara region. Brock’s success to date results from the efforts of its people – your efforts – as well as the investments made in this budget.
Tim Kenyon, Provost and Vice-President, Academic
Michelle McGinn, Provost and Vice-President, Research
Jennifer Guarasci, Vice-President, Administration
Meaghan Rusnell, Vice-President, External
Lesley Rigg, President and Vice-Chancellor
Financial results
(1) For purposes of this figure, the funding from the contingency reserve of $1.5 million in the 2023-24 Budget is shown below the line instead of as part of Inter-fund revenue for comparability with the 2024-25 budget.
Statement of operations metrics
The following metrics were developed to identify areas of strength as well as improvement.
2
(1) Calculated using financial information from 13 comprehensive universities. Certain 2022 metrics have
financial statements.
Brock’s tuition is slightly below the average; however, grant revenue per student continues to be well below the sector average and represents an area of ongoing attention for the University. Naturally, Brock operates more efficiently, given the below-average funding, and this results in lower personnel costs per student to counterbalance the lower funding. Brock continues to invest in students through increasing scholarships, bursaries and fellowships. Interest and investment income metrics are in line with Brock’s financial health metrics as detailed below.
Financial health metrics
The funding budget for fiscal 2024-25 is illustrated in Figure 1. It identifies an in-year mitigation target of $10.1 million, as compared to a mitigation target of $4.0 million in 2023-24. This budget plan assumes a minimum $4.0 million in-year mitigation target coupled with a maximum $6.1 million draw from the contingency reserve to fund the balance of our operating costs. Rather than leveraging a short-term financing facility, such as the University’s line of credit, using the contingency reserve will provide a lower cost of funds solution, as the forgone investment rate of return on our reserves is less than our cost of borrowing. The information below describes our financial health and compares several of our financial health metrics to other comprehensive universities. In addition to the metrics below, Brock's current Morningstar DBRS credit rating is "A (high)" with stable trend. See page 81 for further details of the credit rating. Refer to page
Figure
Figure 3
Governance at Brock University
The University was incorporated in 1964 through The Brock University Act (the Act), a Statute of the Province of Ontario. The University is governed by the Act. The governance, conduct, management and control of the University’s property and the conduct of its business affairs is vested in the Board of Trustees (the Board), while the Senate is responsible for the educational policy of the University. This bicameral system of governance is shown below.
2023-24 Board of Trustees members
• Réjeanne Aimey, Community Trustee
• Mark Arthur, Community Trustee, Chair of the Board
• Anteneh Ayanso, Faculty Trustee
• Greg Berti, Community Trustee
• Don Cyr, Faculty Trustee, Chair of Senate
• Jonathan Davey, Community Trustee
• Arti Freeman, Community Trustee
• Allie Hughes, Community Trustee
• Nyarayi Kapisavanhu, Community Trustee
• Kristian Knibutat, Community Trustee
• Laura Lane, Staff Trustee
• Brian Lang, Community Trustee
• Kevin Magee, Community Trustee
• Dan Malleck, Faculty Trustee
• Anne McCourt, Community Trustee, Vice-Chair of the Board
• Marleen McMaster, Community Trustee
Board of Trustees
The Board consists of 26 members including 17 community trustees elected by the Board, one graduate and one undergraduate student, three faculty members (including the Chair of Senate), and two staff members elected by their respective constituencies. The Chancellor and the President and Vice-Chancellor are ex officio members of the Board.
• Matthew Melnyk, Staff Trustee
• James Maxwell-Barillas, Student Trustee
• Hilary Pearson, Chancellor
• Lesley Rigg, President and Vice-Chancellor
• JoAnna Roberto, Community Trustee
• Christine Sawchuk, Community Trustee
• Stephanie Thompson, Community Trustee
• Robert Welch, Community Trustee
• Rakha Zabin, Student Trustee
• Debbie Zimmerman, Community Trustee
Figure 5
Figure 4: The bicameral system of governance
Senate
As of the time of preparation of this report, the Senate consists of 71 members, including 38 elected full-time teaching staff and professional librarians, two members of the Board, six undergraduate students and two graduate students elected by their respective constituencies. There are also 23 ex officio members of the Senate.
2023-24 Senate members
Members ex officio
• Hilary Pearson (Chancellor)
• Lesley Rigg (President and Vice-Chancellor)
• Tim Kenyon (Interim Provost and Vice-President, Academic)
• Jennifer Guarasci (Interim Vice-President, Administration)
• Brian Power (Vice-Provost and Associate Vice-President, Academic)
• Suzanne Curtin (Vice-Provost, Graduate Studies and Dean, Faculty of Graduate Studies and Post-Doctoral Affairs)
Note: Faculty of Applied Health Sciences (FAHS); Goodman School of Business (GSB); Faculty of Education (FOE); Faculty of Humanities (FOH); Faculty of Mathematics and Science (FMS); Faculty of Social Sciences (FOSS); Faculty of Graduate Studies and Postdoctoral Affairs (FGS); and Brock University Student Union (BUSU).
Planning, Priorities and Budget Advisory Committee
The Senate’s Planning, Priorities and Budget Advisory Committee (PPBAC) defines its terms as follows: It undertakes the responsibility to advise Senate regarding advice to the Board of Trustees in respect to the consistency of the budgets, policies, plans and prioritization processes with academic policy, as well as their consonance with the goals of the University. The PPBAC advises Senate regarding the following:
a) The principles of allocation of the University budget and determination of strategic objectives and prioritization processes.
b) The academic and fiscal priorities of the University.
c) The academic and fiscal challenges of the University.
d) The budget system and strategic planning processes, and any proposed changes in the budget system and strategic planning processes of the University.
e) Matters requiring institutional advocacy.
f) Any other matters referred to it by the Senate or the Senate Governance Committee.
The following are the 2023-24 PPBAC members:
Elected members
• Nota Klentrou (AHS)
• Rosemary Condillac (FOSS)
• Michelle Webber (FOSS)
• Christene Carpenter-Cleland (FMS)
• Francine Vachon (GSB)
• Kelli an Lawrance (FAHS)
• Angus Smith (FOH)
Students
• Carleigh Charlton – Undergraduate student
• Samrath Singh – Graduate student
Ex officio
• Don Cyr (GSB) – Senate Chair
• Tim Kenyon – Interim Provost & VP, Academic
• Peter Berg (FMS) – Faculty Dean
• Ingrid Makus (FOSS) – Faculty Dean
• Deborah O’Leary – Acting Associate VP, Research
• Barbara Sainty – Brock University Faculty Association (BUFA) Observer (non-voting)
Institutional Strategic Plan
The University’s current strategic plan entitled “Niagara Roots – Global Reach,” referred to throughout the text of this document as the “Institutional Strategic Plan,” was implemented in 2018 and guides the institution until 2025. Led by the Office of the President, the strategic planning process has begun to develop a revitalized strategic plan aiming to help the institution deliver on its mission of supporting students and faculty in the discovery of knowledge through exemplary scholarship, teaching, services and community outreach with the goal of releasing the plan in line with the celebration of Brock’s 60th. The current Institutional Strategic Plan, including the Guiding Values, can be viewed at brocku.ca/strategic-plan/
Vision
Brock University is a dynamic, comprehensive university that makes a positive difference in the lives of individuals in our Brock community, the Niagara region, Canada and the world through leadership, innovation and excellence in learning, teaching, research, scholarship and creativity across disciplines.
Mission
Brock flourishes through the scholarly, creative and professional achievements of our students, faculty and staff. Although we share a common purpose, we recognize and honour knowledge pursued through diverse perspectives and approaches. Our academic mission is to nurture and support our students and faculty in the discovery of knowledge through exemplary scholarship, teaching and service.
We provide undergraduate, graduate and professional education of the highest quality. Our graduate programs enhance Brock’s growing reputation for excellence in teaching, research, creativity and innovation. We provide a transformative experience for our students inside and outside the classroom by helping to develop their full potential as educated and engaged citizens in local and global communities. Brock graduates go out into the world as leaders, with a track record of entering fulfilling careers across all disciplines.
Brock University works to enhance the economic, social, cultural and intellectual lives of the communities around us – Niagara, Ontario,
Canada and globally – and to demonstrate the vital ways in which we contribute to the well-being and betterment of society in the 21st century.
Strategic priorities
The Institutional Strategic Plan establishes four strategic priorities, along with associated goals and action items, to advance Brock’s vision over the next seven years.
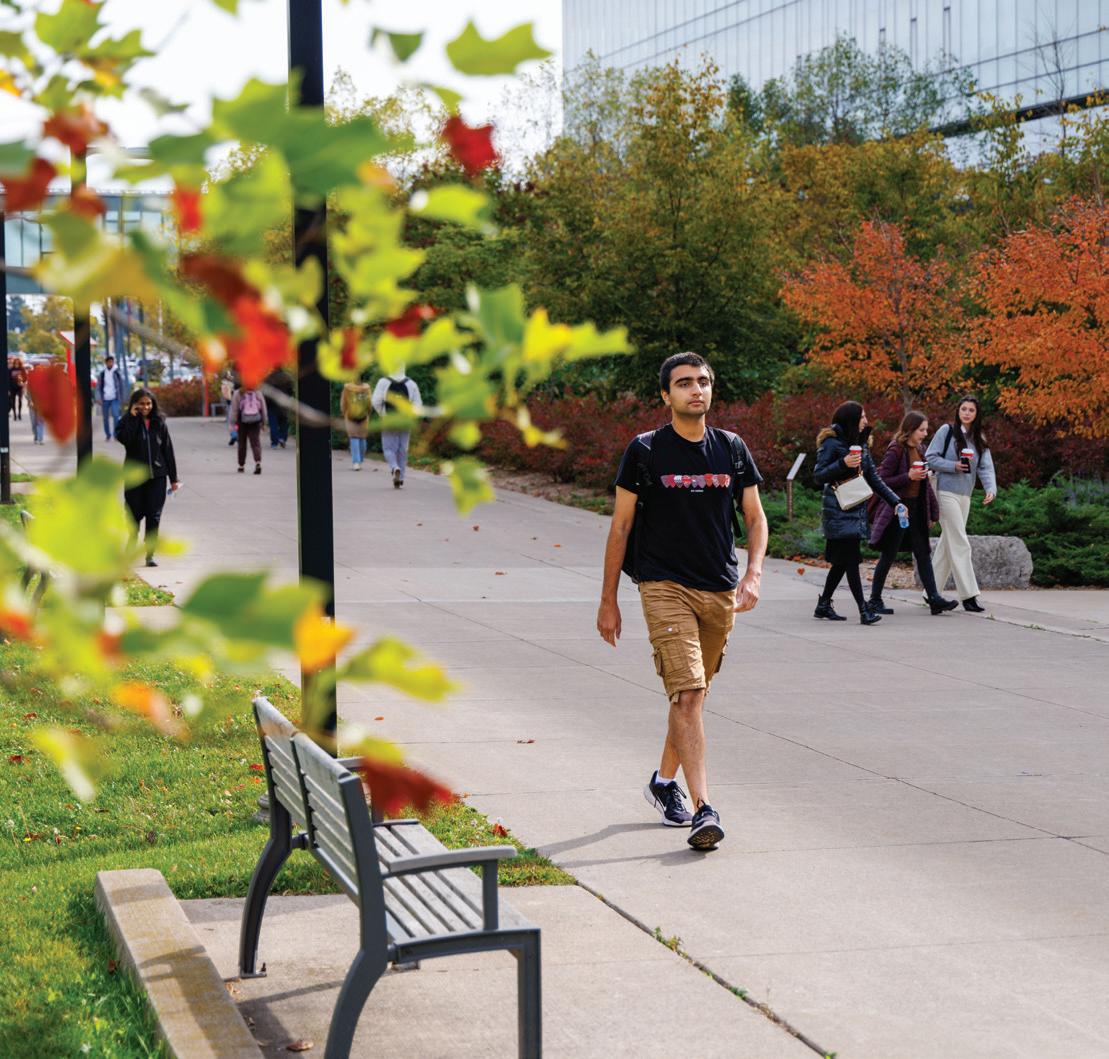
Strategic priority: Offer a transformational and accessible academic and university experience
To be a destination of choice for undergraduate, graduate and part-time students, we must ensure an academic and university experience that positively transforms our students’ abilities, understanding and impact on the world. We teach future-ready students and equip lifelong learners with a zest for knowledge, skills and competencies that will enable them to achieve their full academic, professional, career and life potential. Core to our student experience is the development of engaged citizens who are resilient, involved, career-ready and versatile.
Strategic priority: Build research capacity across the University
Our research focus is central to our identity. Brock will invest in building a world-leading research institution that is grounded in scholarly excellence and strong graduate and post-graduate programs. We will leverage our strengths within and across disciplines to enhance research impact.
Strategic priority: Enhance the life and vitality of our local region and beyond Brock is committed to working with the communities in Niagara, Ontario, Canada and the world. Through local and global connections, we increase opportunities for the residents of Niagara. By responding to the needs of society and supporting its growth and development, we strengthen community vitality and vibrancy.
Strategic priority: Foster a culture of inclusivity, accessibility, reconciliation and decolonization
At Brock, we believe that a diverse and welcoming learning community is built upon the foundation of exceptional students, faculty, staff and alumni. This requires that Brock be attractive and welcoming to people of all identities, and accepting of the unique histories and experiences of Indigenous people within the Canadian state.
Our strategic priorities set the University on the path towards greater national and global recognition for its engagement and relevance to students and communities through enhanced innovation and excellence in teaching, learning, discovery, creativity and the application of knowledge across disciplines.
GUIDING VALUES AND STRATEGIC PRIORITIES(1)
Strategic Focus and Priorities
O er a transformational and accessible academic and university experience
Build research capacity across the University
Enhance the life and vitality of our local region and beyond
Foster a culture of inclusivity, accessibility, reconciliation and decolonization
Integrity and respect Freedom of thought and expression coupled with academic responsibility
(1) The colours in the graphic include Brock’s brand standards and those from the Indigenous Medicine Wheel, the Pride Flag and the Dish with One Spoon Wampum Agreement Flag.
Figure 30
Introducing the data points
As part of the budget report, we provide data points to assist users of this report to draw relationships between financial and non-financial data. The goal is to continue the process of providing meaningful data points to help establish a foundation to explain the “why” behind the revenue and expense values and the outcomes the budget supports. The data points presented in this report were chosen in consultation with Institutional Planning, Analysis and Performance (IPAP), with an emphasis on points which have a financial impact. The data points were made available from IPAP as well as other units throughout the University. Your suggestions for future budget reports and key data points are always welcome at budgetreport@brocku.ca
The second pullout after page 20 presents a timeline that includes some major events impacting our financial experience since 2004-2005, closely aligned with when the move to a comprehensive university was proposed and endorsed.
We hope that you find these data points useful and that they encourage constructive and collegial discussion.
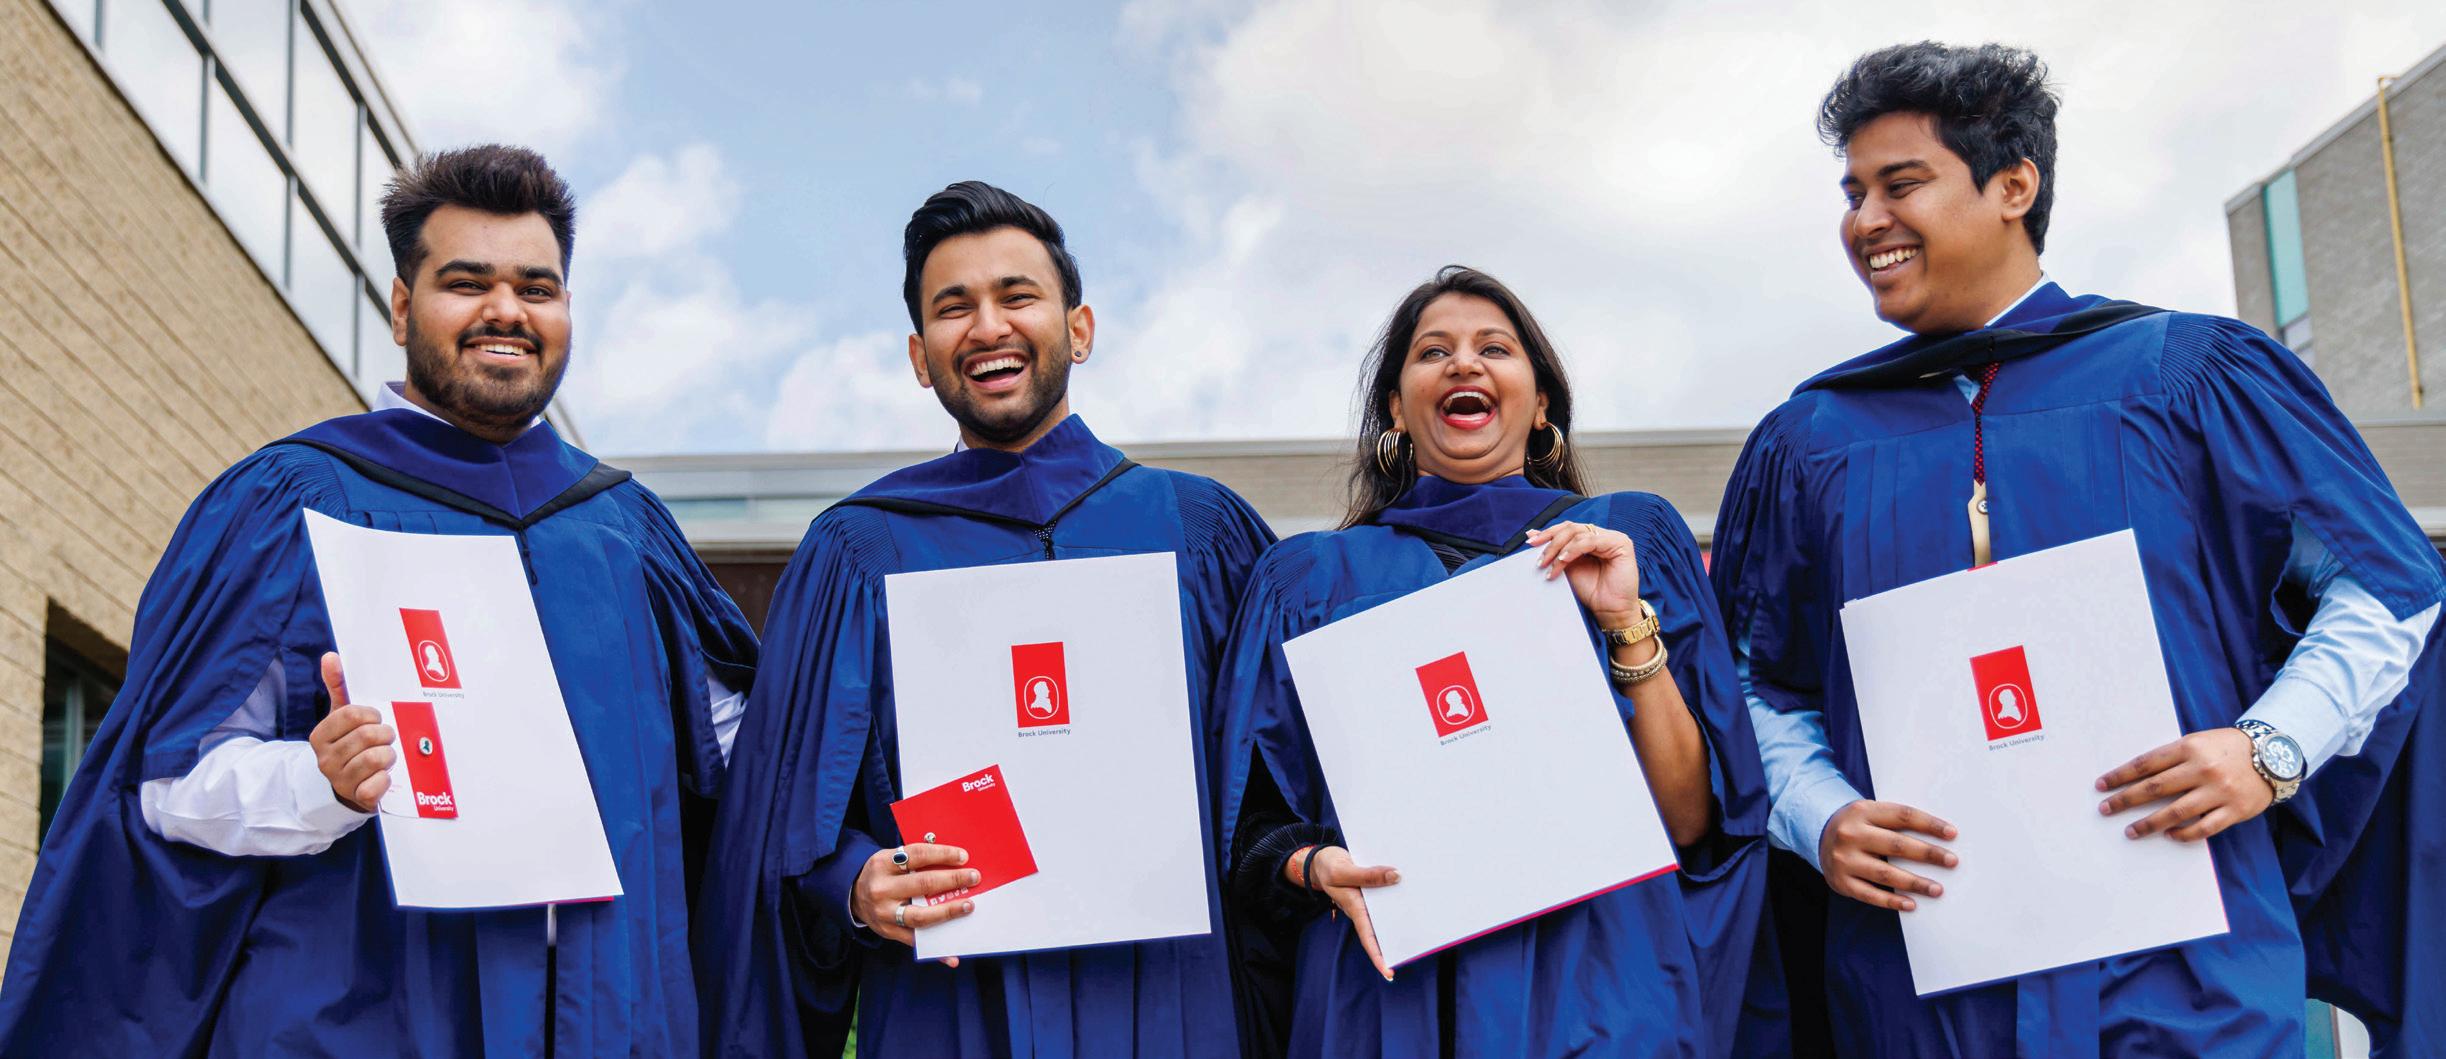
90% of Brock undergraduate students were employed within six months of graduation.
Survey.
96% of Brock undergraduate students were
Source: Maclean’s 2024 University Rankings.
Brock was ranked #6 of 15 among Canadian comprehensive universities for scholarships and bursaries.
Source: Maclean’s 2024 University Rankings
of Applied Health Sciences (FAHS) Goodman School of Business (GSB) Faculty of Education (FOE) Faculty of Humanities (FOH) Faculty of Mathematics and Science (FMS) Faculty of Social Sciences (FOS
Figures represent the number of students in each Faculty of Major on Nov. 1 of each Academic Year (as per PFIS-USER submissions). In addition, figures also include new-entry enrolments as of Feb. 1 for certain programs. Starting in the 2024-25 Budget Report these headcount figures no longer include Continuing Teacher Education enrolment. The prior year figures have been adjusted for comparability.
Figure 10: Fall 2023 undergraduate students by permanent country of residence (%)
Figure 11: Fall 2023 graduate students by
Figure 9: Personnel costs
Source: AppDetails BrockDB on Feb. 26, 2024. (students who applied to Brock for more than one program are only included once).
Average class size by year (full-course equivalent) Overall weighted average class size.
Figures are based on 2023-24 Fall/Winter enrolment.
Figure
Services.
Process and objectives
Overview
The budget is a plan to allocate resources in advance for the maximum benefit of interested parties and to support the Institutional Strategic Plan. It is a method to establish spending and revenue targets of units within Brock University.
The 2024-25 budget process was one of consultation and multiple meetings with the Senior Administrative Council; the Strategic Academic Leadership Team; and the Senate Planning, Priorities and Budget Advisory Committee in addition to numerous unit-specific meetings. Every effort was made to ensure the budget is consistent with the academic policy of the University and that it supports the Institutional Strategic Plan and the Strategic Mandate Agreement 2020-25 (SMA3).
The timeline for the budget process allows the budget to be completed for approval at the cycle 4 meeting of the Board of Trustees in May to coincide with the start of our fiscal year – running from May 1 to April 30. We thank all units for meeting the requirements of the budget timeline. The scale of this generational fiscal circumstance following so many years of efficiencies resulted in the need to address this budget challenge with a larger mitigation target consistent with the direction of the May 7, 2015, Board of Trustees twopart motion: “THAT the President be given a mandate to:
1. Ensure the University funding budget for 2015-16 and all subsequent years are prepared and presented as balanced. If a balanced funding budget cannot be achieved when presented to the Board of Trustees for approval, the deficit can be presented as a mitigation target provided a plan to achieve the mitigation target is included.
2. Manage the affairs of the University in order for it to achieve, or do better than, the funding budget.”
As an initial part of the budget process, guidance is prepared by considering all known commitments in the upcoming year, including personnel rate increases, debt payment commitments and investments set out in the Fiscal Framework. For 2024-25, this resulted in $37.2 million shortfall in projected revenue to fund our operations. The necessary mitigation efforts followed an already challenging budget year in 2023-24. Each unit throughout the University once again analyzed their budgets to identify savings while carefully considering the impact on student experience.
We thank all units who worked diligently and prepared their budgets to bring the overall 2024-25 budget together. Following all the consultations, our people brought the budget to within 2.6 per cent of being balanced with a minimum $4.0 million in-year mitigation target coupled with a maximum $6.1 million draw from the contingency reserve to fund the balance of our operating costs. For a more detailed discussion of the methods used that resulted in identified savings of almost $27 million, see the Budget Environment section of this report, starting on page 15.
While in-year mitigation targets are established in the budget, these efforts do not overshadow the long-term growth and development of the University. Certain areas will require investment for the University to achieve our strategic goals. The following sections provide additional information in areas of new and ongoing investment as established in the 2024-25 operating budget.
New and ongoing investments
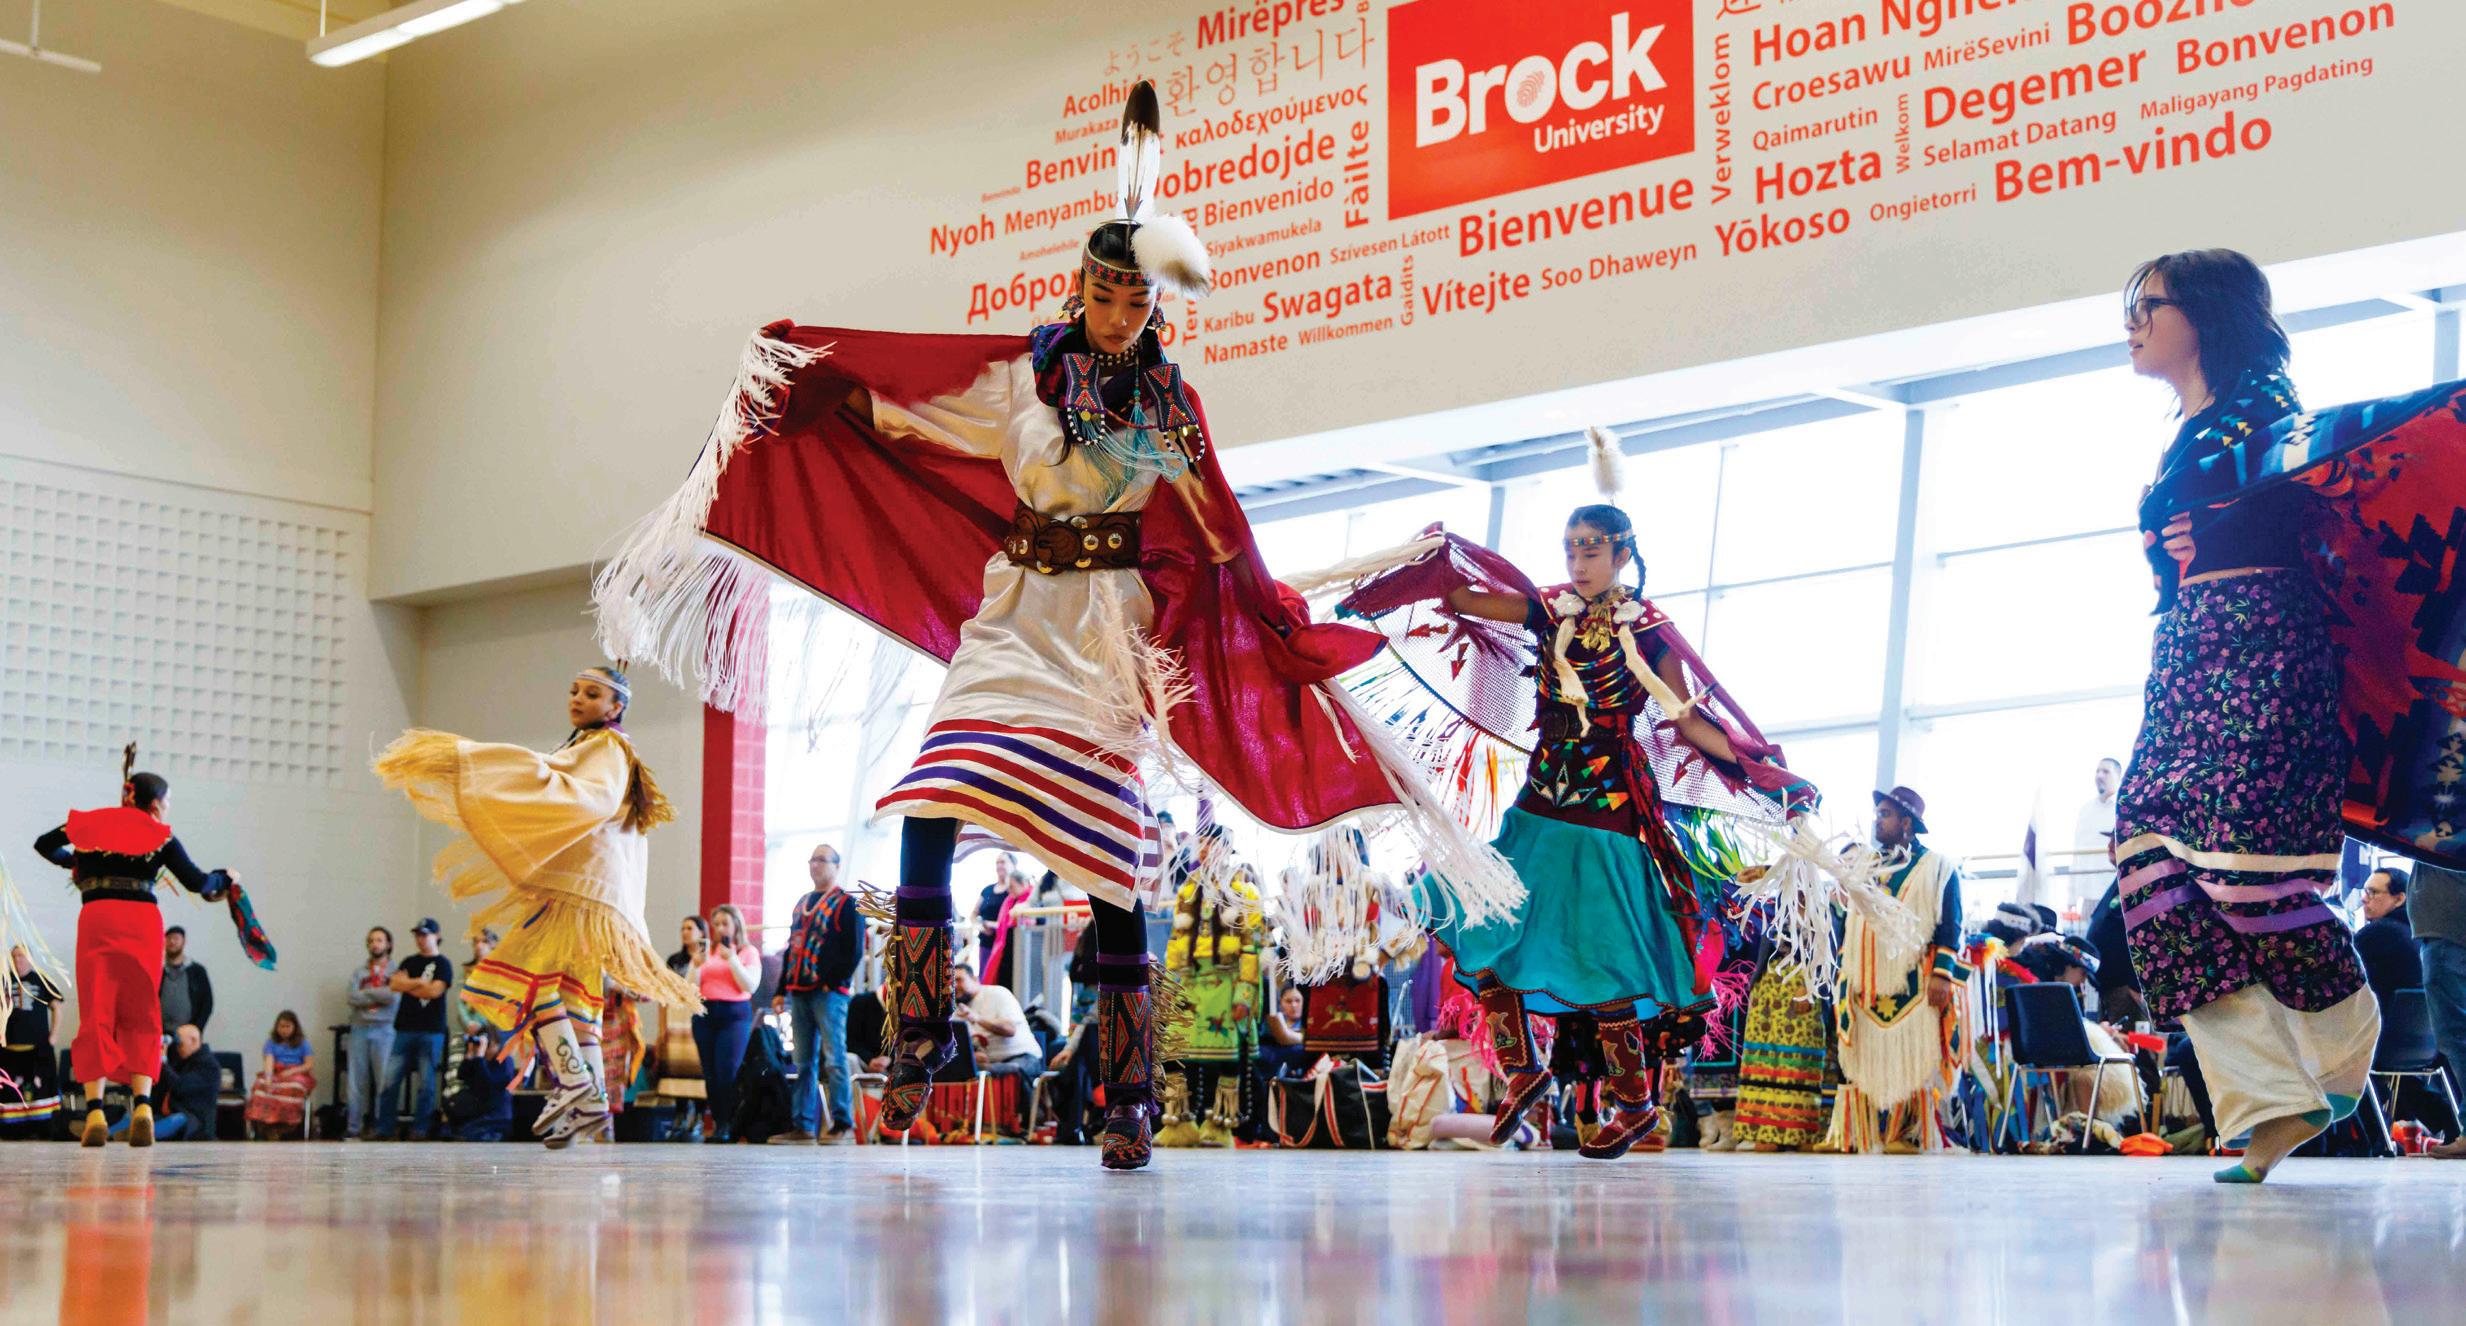
The Institutional Strategic Plan specifically identifies focusing and strengthening engagement and trust with Indigenous communities and partners. The 2024-25 budget supports this initiative in a number of meaningful ways that are highlighted below:
Indigenous support
• Continued support for the Vice-Provost, Indigenous Engagement
• Continued support for the Hadiyaˀdagénhahs First Nations, Métis and Inuit Student Centre and Undergraduate Aboriginal Studies
• Targeting scholarship support for Indigenous students, both undergraduate and graduate
• Faculties supporting growth in Indigenous content in curricula
• Faculties continue to diversify their faculty complement by appointing Indigenous faculty members
Core to the Institutional Strategic Plan is academics and teaching. The 2024-25 operating budget is in support of this as can be seen by the investments in the Teaching Faculties highlighted below:
Teaching Faculties
• Total operating and personnel cost budget: $177.5 million, which is 45 per cent of the total University operating and personnel costs budget
• FTE (2): 823.5
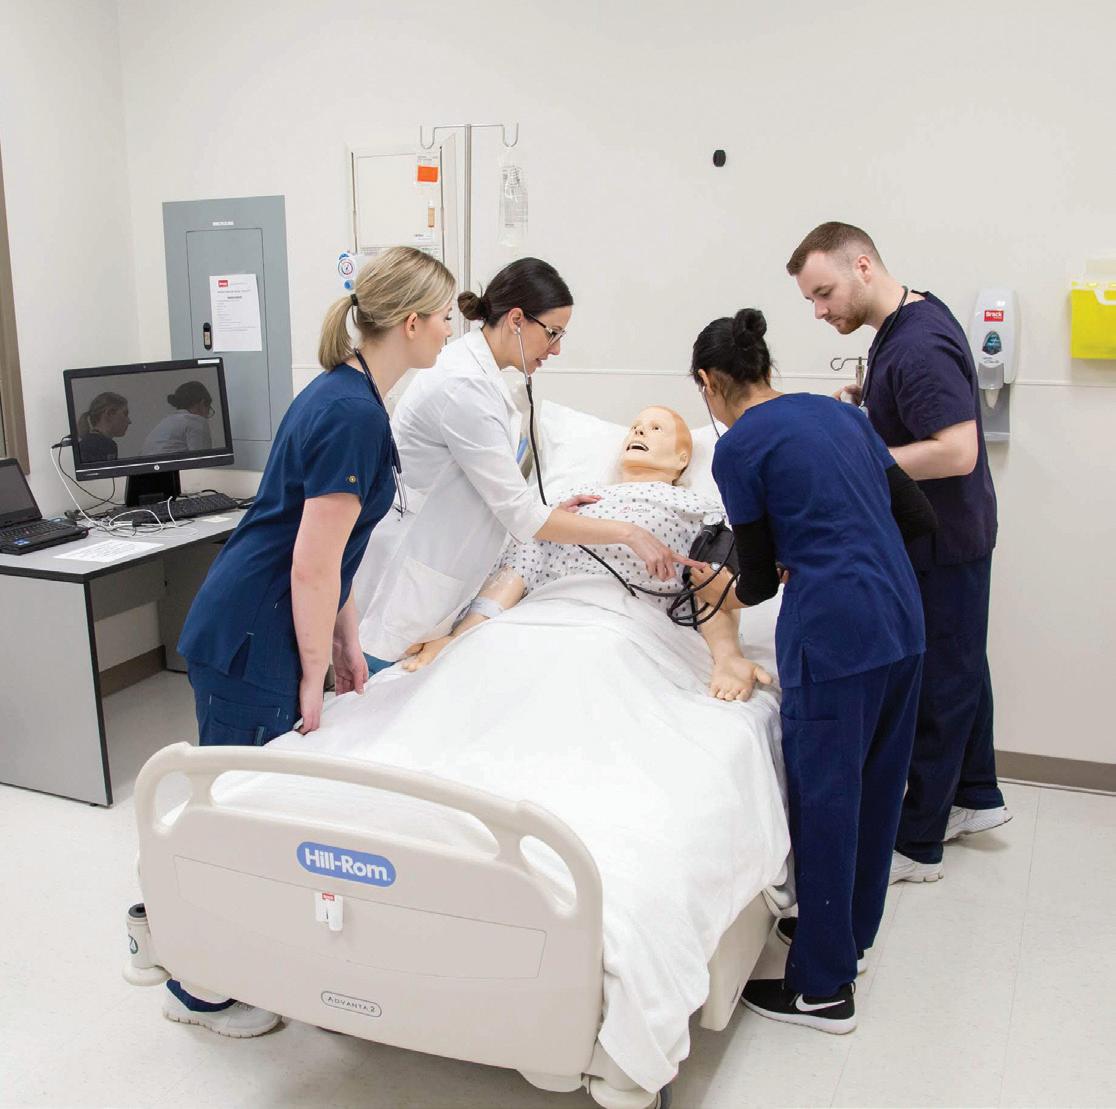
• Faculty of Applied Health Sciences provides high quality undergraduate and graduate education with extensive practicum and experiential learning opportunities combined with a broad research capacity dedicated to enhancing sport and health outcomes in cooperation with our numerous community partners.
• The Goodman School of Business lives its vision of creating meaningful sustainable impact through classroom teaching, community engagement and worldchanging research.
• Faculty of Education is strengthening community networks for experiential and work-integrated learning opportunities while enhancing program and student supports which will maintain the Faculty's reputation of graduating highly regarded educators and researchers.
• The Faculty of Humanities continues to provide exciting experiential opportunities and supports for students.
• The Faculty of Social Sciences continues to prioritize delivering and developing high quality programs and providing funding for strategic initiatives that serve Faculty, staff and students.
• The Faculty of Mathematics and Science is launching a BEng Integrated Engineering program in Fall 2024, the first engineering program at Brock University, while establishing new research ties with industry through the VPMI and new community ties through numerous events that engage the public in science. brocku.ca/academics
The strategic priority to “Build research capacity across the University,” as identified in the Institutional Strategic Plan, is supported as part of the 2024-25 budget. The section below details investments to support research activity.
Research support
• The 2022-23 Fiscal Framework established targeted guidance to build research capacity across the University by ensuring the operating budget for the central research enterprise and Faculty-based research services grow each year by at least the rate of inflation with additional structural adjustments. The inflation adjustment was paused when developing the budget for 2024-25, however funding of the central Research Enterprise did increase compared to the 2023-24 budget, not including Faculty of Mathematics and Science research services (i.e. Technical Services and Science Stores).
• Total net direct operating budget (1) of the central Research Enterprise and the Office of the Vice-President, Research (VPR): $4.7 million, representing an increase of $0.1 million over the 2023-24 budget.
• Highlights of some investments in the 2024-25 budget include:
- Grant funding for various items including VPR Research Excellence for Research Initiative Awards, application support, equipment support, Indigenous research, and matching funds as well as Chancellor's Chair and Match of Minds grants.
- Funding for post-doctoral fellowship awards and distinguished/early career research awards.
- Funding the Cool Climate Oenology and Viticulture Institute.
- Funding the full launch of the Validating, Manufacturing and Prototyping Institute. brocku.ca/research-at-brock
We know the Library is important to both teaching and research. To ensure Brock’s Library remains competitive with our peers, the Fiscal Framework establishes a goal of benchmarking our acquisitions on a per-student basis against our peers in the Canadian Association of Research Libraries (CARL).
Library acquisitions
• Net direct operating budget (1): $5.7 million
• Where this isbudgeted: As part of the total Library budget of $12.1 million ($11.8 million in 2023-24)
brocku.ca/library
Another of the strategic priorities detailed in the Institutional Strategic Plan is to “Offer a transformational and accessible academic and university experience.” The 2024-25 operating budget supports this priority through its development of Professional and Continuing Studies (PCS) and Engineering.
Professional and Continuing Studies
• PCS is charged with developing a wide range of continuing education and professional programs with flexible learning opportunities to meet the needs and advance the careers of a wide audience of learners, including current students, graduates, working professionals and retirees. PCS includes many of Brock's non-credit offerings.
• PCS is approaching a self-sustaining model and not drawing from strategic reserve funding in 2024-25.
• Operating and personnel budget is $0.9 million, offset by revenue of $0.8 million for a net cost of $0.1 million.
• FTE (2): 3.5
brocku.ca/continuing-education
Engineering
• The Yousef Haj-Ahmad Department of Engineering is an innovative approach to engineering education tailormade to address emerging needs and challenges in the field. Brock's unique, made-in-Niagara interdisciplinary program blurs the lines between traditional engineering disciplines, helping the engineers of tomorrow lead in fields as diverse as big data, artificial intelligence, bioengineering, medical devices, sustainability and climate change, robot automation, manufacturing and transportation. 2024-25 will see the first cohort of students launch this program.
• Operating and personnel cost budget: $1.7 million. This investment is being fully funded by strategic reserves in 2024-25.
• FTE (2): 9.5
• Where this is budgeted: Faculty of Mathematics and Science
brocku.ca/mathematics-science/engineering
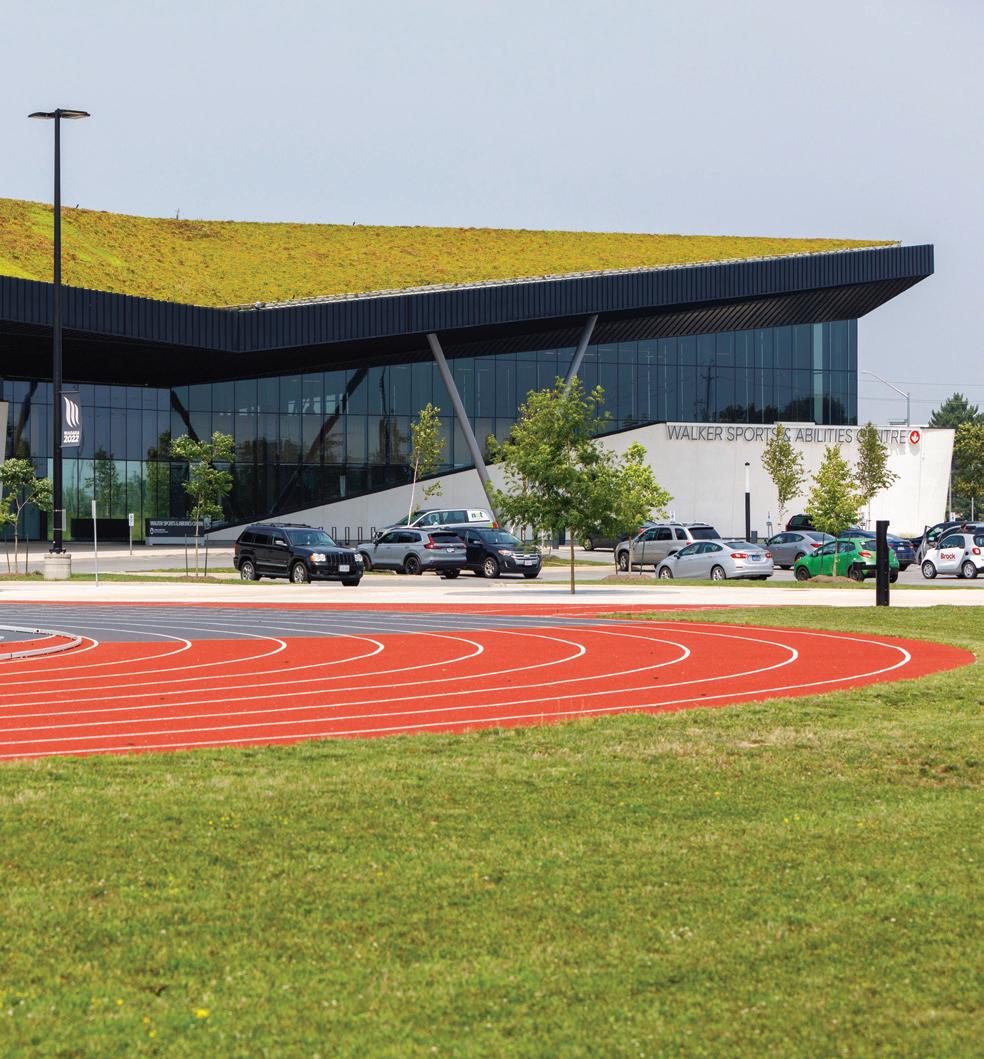
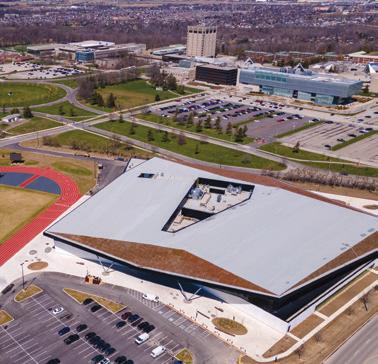
Canada Games Park, which sits on Brock land, contributes to the strategic priority to “Offer a transformational and accessible academic and university experience.” Part of this priority is to provide an engaging campus experience that meets students’ needs and affords social, cultural and recreational opportunities for all students. Canada Games Park houses the Walker Sports and Abilities Centre, including a health and well-being centre, arenas, gymnasiums and an outdoor facility with a track, athletic field and beach volleyball courts, of which Brock University is a 1/4 owner and 1/3 operator.
Canada Games Park
• Net direct operating budget (1): $1.0 million. (Note: this budget does not include the arena and gym leasing costs budgeted in Brock Sports and Recreation).
• Where this is budgeted: Campus Development and Community Agreements brocku.ca/community-relations/community-resources/ walker-sports-and-abilities-centre/
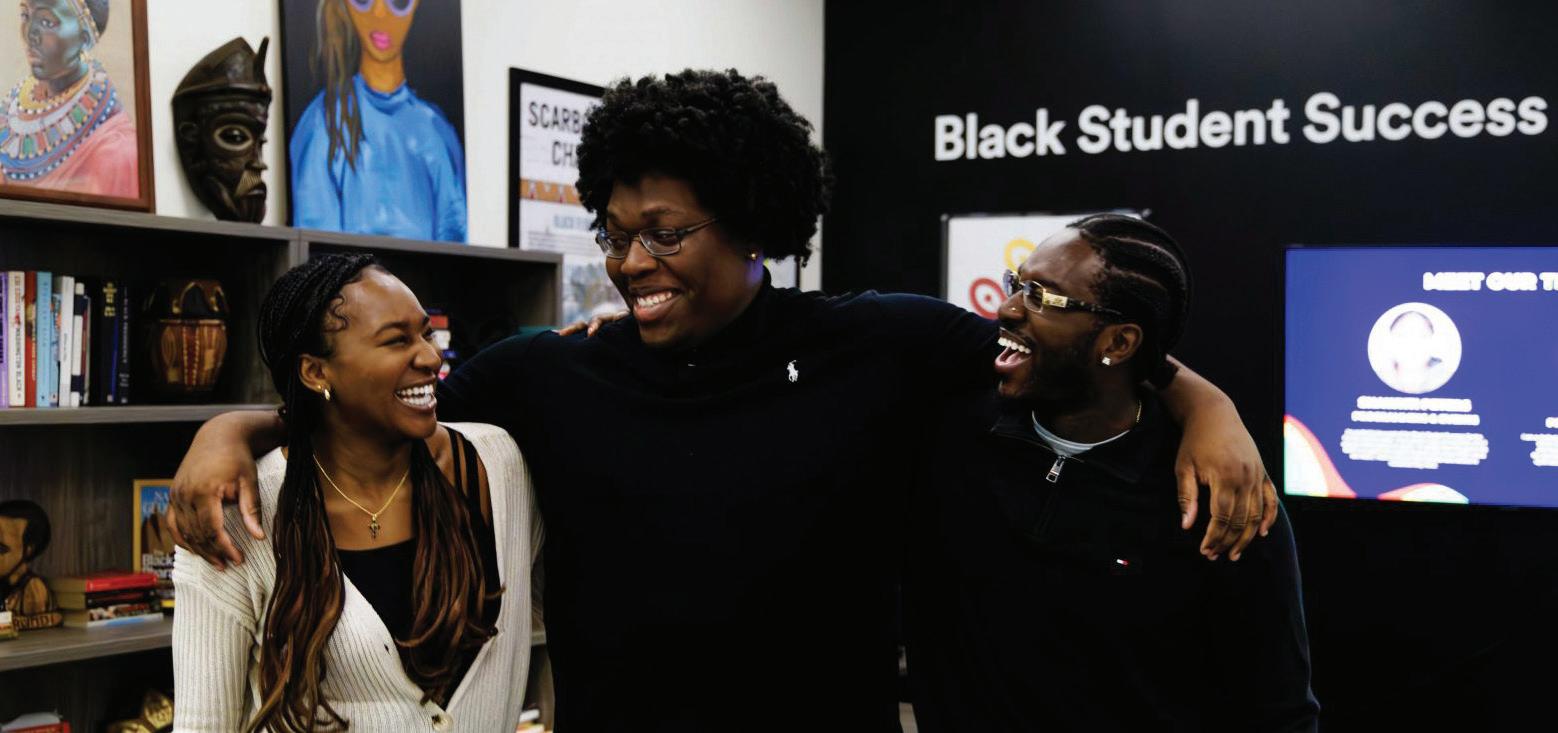
One of Brock’s strategic priorities is to “Foster a culture of inclusivity, accessibility, reconciliation and decolonization.” One of the ways this is seen in the 2024-25 operating budget with the investment in the Black Student Success Centre (BSSC).
Black Student Success Centre
• The mission at the BSSC is to serve as a centrally located resource and support space on the Brock University campus dedicated to the advancement, development, elevation, growth and success of the African, Black and Caribbean student community.
• Where this is budgeted: Student Life and Success brocku.ca/bssc
Scholarships, bursaries and fellowships support the Institutional Strategic Plan by helping Brock become a destination of choice for students and making it possible for more to attend the University.
Scholarships, bursaries and fellowships
• Undergraduate: $15.2 million
• Graduate: $8.5 million
• Funding sources: $21.1 million (89%) operating budget and $2.7 million (11%) endowment.
Continue to enhance accountability, understandability and transparency of the budget
To everyone involved in the budget development, thank you for making this budget possible. Furthermore, this year’s report continues the linkage of financial and non-financial data through a strong partnership with Financial Services and Institutional Planning, Analysis and Performance. We suspect this information will generate discussion, which is encouraged. It is anticipated that future budget reports will continue to build and add to the financial and non-financial data disclosed herein. Discussing both financial and non-financial data together will help support ongoing efforts to ensure a fiscally responsible budget while paying close attention to quality and academic outcomes. It is hoped that the efforts made throughout the development of this budget have enhanced accountability, understandability and transparency. Feedback is always encouraged and welcomed, and can be directed to budgetreport@brocku.ca
Budget environment
The current budget environment is informed by our Fiscal Framework, enrolment and notably government policies at both the federal and provincial levels. Developing the 2024-25 budget demanded attention to detail to address the significant fiscal pressures structural to the university sector owing to government policies. As a not-for-profit organization, each year our goal is to achieve a balanced budget. Recognizing costs are subject to inflation, our ability to offset these costs with additional revenue is not possible within the confines of current government policy; thus, each year we endeavour to find additional efficiencies and diversify revenues to achieve a balanced budget. Demands on the University impose costs that will always exceed its available resources. Brock University must therefore have some means both of setting priorities among its many possible opportunities and of planning to enable the strategies it undertakes. As we have done in past years, consultation with the University community has informed budget development. Integrating the feedback received on the budget within our fiscal parameters and guided by the Institutional Strategic Plan, this budget plan provides support for the academic policy of the University while recognizing the constraints that a $10.1 million shortfall will have on mitigation efforts. This discussion on the budget environment serves to highlight areas that significantly impact the budget development.
Enrolment
Enrolment generates the majority of our revenue; thus, it is a key assumption in our budget planning. As noted in the Fiscal Framework, Brock relies on strategic enrolment growth to fund a significant portion of our cost increases given that tuition rates and government grants are regulated and are not increasing at all close to the rate of inflation.
International enrolment continues to be an area of risk for the entire sector as the federal government's caps on international enrolment are expected to reduce undergraduate international intake by 40 per cent, which represents a decline of 108 students compared to prior year budget. Overall international undergraduate enrolment is down 19 per cent, which accounts for a $11.5 million decline in tuition revenue as compared to the 2023-24 budget. New programs such as Engineering and new types of students that we plan to attract through Professional and Continuing Studies will aid in our sustainability plan, but these programs do require investments that will initially exceed revenue generating capacity to ensure their future success. Brock’s 2024-25 budget plan continues to maintain investments in these strategic areas of growth.
Figure 31 outlines our updated enrolment plan. The next few years will require thoughtful academic-led enhancements to programs and allocations of limited resources as we endeavour to regain enrolment growth to meet our fiscal needs.
Figure 32: Total all-in headcount enrolment projection(1)
Figure 31: Total headcount enrolment projections
Actual all-in enrolment (1)
Budget all-in enromlent (1)
Actual year 1 intake – undergraduate(2)
Forecast year 1 intake – undergraduate (2)
(1) ‘All-in’ enrolment includes letter of permissions, non-degree students, auditors, additional qualifications and certificates. Starting in the 202425 Budget Report all-in headcount no longer includes Continuing Teacher Education enrolment. The prior year actuals and budgets have been adjusted for comparability.
(2) Intake enrolment represents year 1 undergrad intake headcount excluding certificates and International Student Programs (ISP).
Government Policy
Brock continues to appreciate its strong and collaborative relationship with the Province of Ontario through the Ministry of Colleges and Universities (MCU). Despite the Province’s fiscal constraint, it continues to fund important programs at Brock.
On March 27, the Province of Ontario announced its Budget 2024 titled: “Building a Better Ontario.” In 2024-25, the government is projecting a deficit of $9.8 billion, improving to a deficit of $4.6 billion in 2025-26 and a surplus of $0.5 billion in 2026-27. This is driven by slower growth impacting revenues, increased compensation costs and increased investments in infrastructure, municipalities and key public services, as well as gas tax relief. Post-secondary education sector funding is projected to increase very modestly at a rate of one per cent per year from $12.6 billion in 2023-24 to $13.0 billion in 2026-27. This reality of minimal increase in funding is seen in Brock’s budget for grant funding representing a nominal increase of 0.2 per cent. While new funding envelopes were announced to increase funding for base operating grants, the reality is that other grants such as the
teacher’s expansion grant are being eliminated, resulting in a net neutral change in overall grant funding in the operating budget. For example, the Province announced increased supports to institutions of $903 million to strengthen post-secondary education in Ontario, including implementing a Postsecondary Education Sustainability Fund to help address immediate financial sustainability challenges. Brock has not factored any unknown grant allocations into our budget plan as the net impact of any new funding commitment has not been provided at the time of budget development.
Although not an ideal situation, the sector does have a level of certainty going forward with respect to provincial government policy. The tuition freeze has been committed for another three years except for anomalies where identified programs are well below the sector average. Growth in grant funding will be modest, below the anticipated rate of inflation, resulting in the need to find ongoing efficiencies and new revenue opportunities.
Compounding the sector’s fiscal challenges is the Federal Government’s two-year restriction on international enrolment that will result in limitations to international enrolment growth, one of the few sources of revenue flexibility. This announcement is changing Canada’s previous standing as a destination country for postsecondary studies, driving down application volumes and interest in Canada’s programs nationwide. For 2024, the cap is expected to result in approximately 360,000 approved study permits, a decrease of 35 per cent from 2023; however, due to the government's plan to allocate visas based on population, Ontario will see approximately a 50 per cent decrease in visa allocations. In response to this policy, the Ontario government announced that applications will be allocated to institutions based on the following criteria:
• Prioritize programs in high-demand areas, including skilled trades, health human resources, STEM, hospitality and child care.
• Cannot exceed the institution’s 2023 permit levels.
• As a final backstop, the ratio of international permits cannot exceed 55 per cent (exclusive of high-demand areas) of the institution’s 2023 first-year domestic enrolment.
The Province has also tied grant funding to labour market outcomes beginning with the Strategic Mandate Agreement 2020-25 (SMA3), which took effect in 2020-21. As initially established, this updated funding model includes tying a larger portion of funding to metric performance through the Differentiation Envelope. This proportion started with a system average of 25 per cent in 2020-21 and is ramped up to a system average of 60 per cent of total MCU operating grant funding by 2024-25. Figure 32 details Brock’s proportion of the Differentiation Envelope.
Figure 32: Base Operating Grants ($000s)
Brock, along with our peers across the province, has 10 metrics used to determine funding allocations. As detailed in Figure 33, metrics are aligned with priorities in skills and job outcomes and economic and community impacts. Brock’s Institutional Strategic Plan aligns our strategic priorities with the government. It should be noted that during 2020-21, the MCU announced that the metrics tied to the Differentiation Envelope would not impact the grant funding for 2020-21 and this pause carried forward through 2022-23. Figure 33 further highlights how achieving and exceeding targets does not increase grant funding;
Figure 33: Performance-based funding
however, missing targets results in reductions in funding. Our goal within the context of our budget is to achieve our target metrics and maintain our grant funding at current amounts while capitalizing on strategic growth areas where government is providing special-purpose grant opportunities. Based on current estimates of the performance metrics, the 2024-25 budget assumes a slight shortfall of $0.08 million from the maximum funding available driven by three metrics achieving slightly less than 100 per cent of target as outlined in Figure 33.
(1) Actual for this metric represents the current assumption.
Generational Fiscal Environment
This section, usually reserved for a discussion on the University’s Fiscal Framework, is being replaced temporarily with a discussion on this budget plan and the strategy to combat a generational fiscal deficit brought on by the externalities discussed in the previous section.
We are very familiar with the fiscal challenge facing Brock and the Ontario post-secondary sector. Government regulates more than half of the University’s revenue and that revenue is predominately subject to zero per cent inflation. With personnel costs growing at 4.1 per cent annually, and with 67 per cent of expenses associated with personnel costs, most of which is tied to collective agreements, the University is faced with a budget model that must rely on increasing enrolment revenue to fund base operating expense inflation. This framework is highlighted in Figure 34. As labour negotiations are impacted by sector wide outcomes, Brock’s recent settlements are reflecting these external pressures, further accelerating inflation on personnel costs and adding even greater pressure to this model.
As the budget development process began for 2024-25 in the fall of 2023, there was a realization that our funding shortfall would surpass any shortfall experienced in Brock’s history if immediate action was not taken. A $37 million funding shortfall, approximately 10 per cent of the total funding budget, materialized out of these external pressures. The size of this shortfall signalled that we would not be able to meet our Fiscal Framework commitments in the short term and that a resetting of priorities would need to take place to maintain Brock’s solvency. The word solvency may seem like an extreme
concept, but the reality is every university in Ontario is facing deficits and our ability to fund deficits is limited to our contingency reserves, which at the time of writing is projected to hold $6.8 million in funding at 2023-24 fiscal year-end. Structural changes are necessary for longer-term sustainability; however, those changes must be informed by strategic academic-led reviews that require adequate time for planning and successful implementation. Through a rigorous budget development process, Brock identified $27 million in mitigation to bring the proposed budget deficit to $10.1 million. Recognizing this deficit is larger than historical mitigation targets, this budget plan assumes a minimum $4 million in-year mitigation target coupled with a maximum $6.1 million draw from the contingency reserve to fund the balance of our operating costs. Rather than leveraging a short-term financing facility, such as the University’s line of credit, using the contingency reserve will provide a lower cost of funds as the forgone investment rate of return on our reserves is less than our cost of borrowing. Generally there has been a 150-250 basis points (bps) premium on our borrowing rate over our investment rate of return. At the time of writing, Brock’s line of credit at Prime less 50 bps would represent a cost of 6.7 per cent; whereas, operating investments are earning approximately five per cent within the current rate environment. Brock would also benefit from a flexible repayment plan if we are essentially borrowing from ourselves. Any future surplus will subsequently be earmarked for repayment into our contingency reserve prior to being allocated to other strategic reserves. This strategy will leave Brock with limited contingency reserves at the end of fiscal 2024-25; however, no external financing will be utilized for operating expenses and this will afford the institution time to adapt our programs for future sustainability.
Figure 34: Budget Framework
Financial update
At the time of writing this budget report, we are projecting, through our second trimester reporting (T2) for fiscal 2023-24, a remaining mitigation target of $4.9 million vs. the mitigation target as part of the first trimester reporting (T1) of $11.1 million. The T2 reporting can be found at brocku.ca/about/university-financials. This outcome indicates that we have already mitigated $6.2 million of our T1 mitigation target. The T2 reporting forecasts a revenue shortfall versus budget of $7.4 million, which is offset by mitigation strategies such as personnel savings forecasted to be $4.7 million and non-personnel operating costs savings to be $1.9 million. At year end, this projection will be updated to actual results in the 2023-24 Annual Report. Additional work has been done since the T2 report to close the remaining mitigation target. At the time of writing it is anticipated Brock will close the 2023-24 fiscal year to a balanced result.
The 2024-25 budget was established with certain key assumptions:
1. The enrolment forecast shows an increase of 176 (1.0 per cent) undergraduate students and an increase of 30 (1.7 per cent) graduate students as compared to 2023-24 forecasted all-in enrolment. However, there is a significant change in student demographics as undergraduate international enrolment is projected to decline by 211 (12.4 per cent) which has a significant impact on tuition revenue as explained in the, Student Fees, section of this report starting on page 23.
2. Continuation of the (MCU) tuition policy allowing for a five per cent increase to domestic out of province tuition rates, representing $0.08 million additional revenue as well as the continuation of tuition anomaly increases of 7.5 per cent for certain programs that were approved in 2023-24 by the MCU representing approximately $2.2 million.
3. MCU operating grants in 2024-25 are forecasted to be consistent with the amounts expected to be received in 2023-24 (T2 forecast), except for additional funding for Nursing, limited-term additional funding from the MCU of $2.6 million offset by the elimination of the additional grant received in 2023-24 for Teacher Education. The funding model is described in the, Grant revenue, section of this report starting on page 28.
4. Inclusion of uncommitted strategic/discretionary funds of a half per cent of the revenue budget, at $1.9 million.
Due to the mitigation target in 2024-25, the mitigation measures of fiscal 2023-24 will remain in effect. These measures will assist us in meeting our target of a year-end balanced result or better. Reviews are also required to find a way to permanently eliminate the need for these mitigation measures and ensure we remain financially sustainable, where revenues naturally grow in harmony with the rate of growth in our expenditures. Any surplus at the end of the year derived from mitigation efforts will first be used to repay any use of the contingency reserve in 2024-25.
Historical timeline
In planning for the future, it can be useful to look back and ask “how did we get here?” The chart and historical timeline provided here attempt to rewind the clock and identify some key decisions with significant financial impact that have occurred since 2004-05. These key decisions have been identified on the timeline along with an undergraduate and graduate student headcount, and a faculty, professional librarian and staff headcount. The chart begins in 2004-05, as it closely coincides with when the move to a comprehensive university was proposed and endorsed. An interesting observation is that the student to faculty and librarians ratio, and the staff to faculty and librarians ratio have not changed substantially since 2004-05.
Note: The faculty and professional librarians headcount figures accumulated represent roster data (i.e. all employees holding a faculty position in the academic year). The staff headcount figures are from Office of People and Culture and represent headcount as of October each year.
Note: The figures were obtained from the audited financial statements of Brock University, which were prepared in accordance with the Canadian generally accepted accounting principles for not-for-profit organizations (2004-05 to 2010-11) and in accordance with Canadian accounting standards for not-for-profit organizations (2011-12 to 2022-23).
Space considerations
The following charts present two different ways of examining space at the University. Figure 37 details the space usage by category as of 2022, which was prepared for the Council of Ontario Universities’ Survey of Physical Facilities, as well as an updated estimate for 2024. Only 70 per cent of the University’s space is assignable to specific functions, while 30 per cent is non-assignable, meaning it relates to items such as utility plants, corridors and hallways. Figure 38 details the Deferred Capital Renewal and Maintenance (DCRM) backlog by asset type and compares this to the replacement value of those assets. This information was obtained from the condition assessment performed by SLAM Technologies Inc. (through Council of Ontario Universities) in May 2023, which determined Brock has $385 million in DCRM requirements that have accumulated over a number of years. In addition, the chart details the Facility Condition Index (FCI) (DCRM divided by the current replacement value), which determines the relative condition of the asset. The lower the FCI, the better the condition of the asset. For example, MIWSFPA has a low FCI, while buildings with higher FCIs are generally older, such as the Schmon Tower and the Walker Complex. Brock’s overall FCI is 0.25, while our goal is to maintain a FCI of 0.18.
Figure 37: Space usage
(1) The 2022 data was prepared for submission to the Council of Ontario Universities Triennial report that takes place every 3 years. The data is as of Nov. 1, 2022. The estimate for 2024 was updated after the original submission and is included as an updated comparison to the 2022 data.
(2) NNASM includes items such as central utilities plants, corridors, stairwells, elevators, service tunnels and parking structures.
Source: SLAM Technologies Inc. Facility Asset Condition Database.
(1) Facilities Condition Index (FCI): Represents DCRM backlog divided by replacement value.
(2) Central Utilities Building: Mainly relates to the Cogeneration Facility and also includes Facilities Management offices.
(3) Infrastructure: Includes many of the non-building assets, such as parking lots, storm sewers and roadways.
(4) Main – other: All buildings on the main campus that are not specifically identified.
Figure 38: DCRM 2023
Plaza Building construction completed Welch Hall expansion completed
International Centre construction completed
Roy and Lois Cairns Health and Bioscience Research Complex construction completed
full-course equivalents offered
Required full-course load for faculty changed from 2.5 to 2 Double cohort began
Required full-course load for faculty changed from 3 to 2.5
Union group CUPE 2220 (Rodman Hall Art Centre) was assumed
1,588 full-course equivalents o ered Double cohort ended
Union group CUPE 4207–Unit 2 (ESL Co-ordinators) was certi ed
Union group CUPE 4207– Unit 3 (ESL Instructors) and I ATSE (Theatre Technicians, etc.) was certi ed
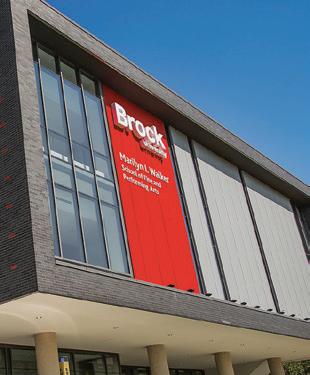
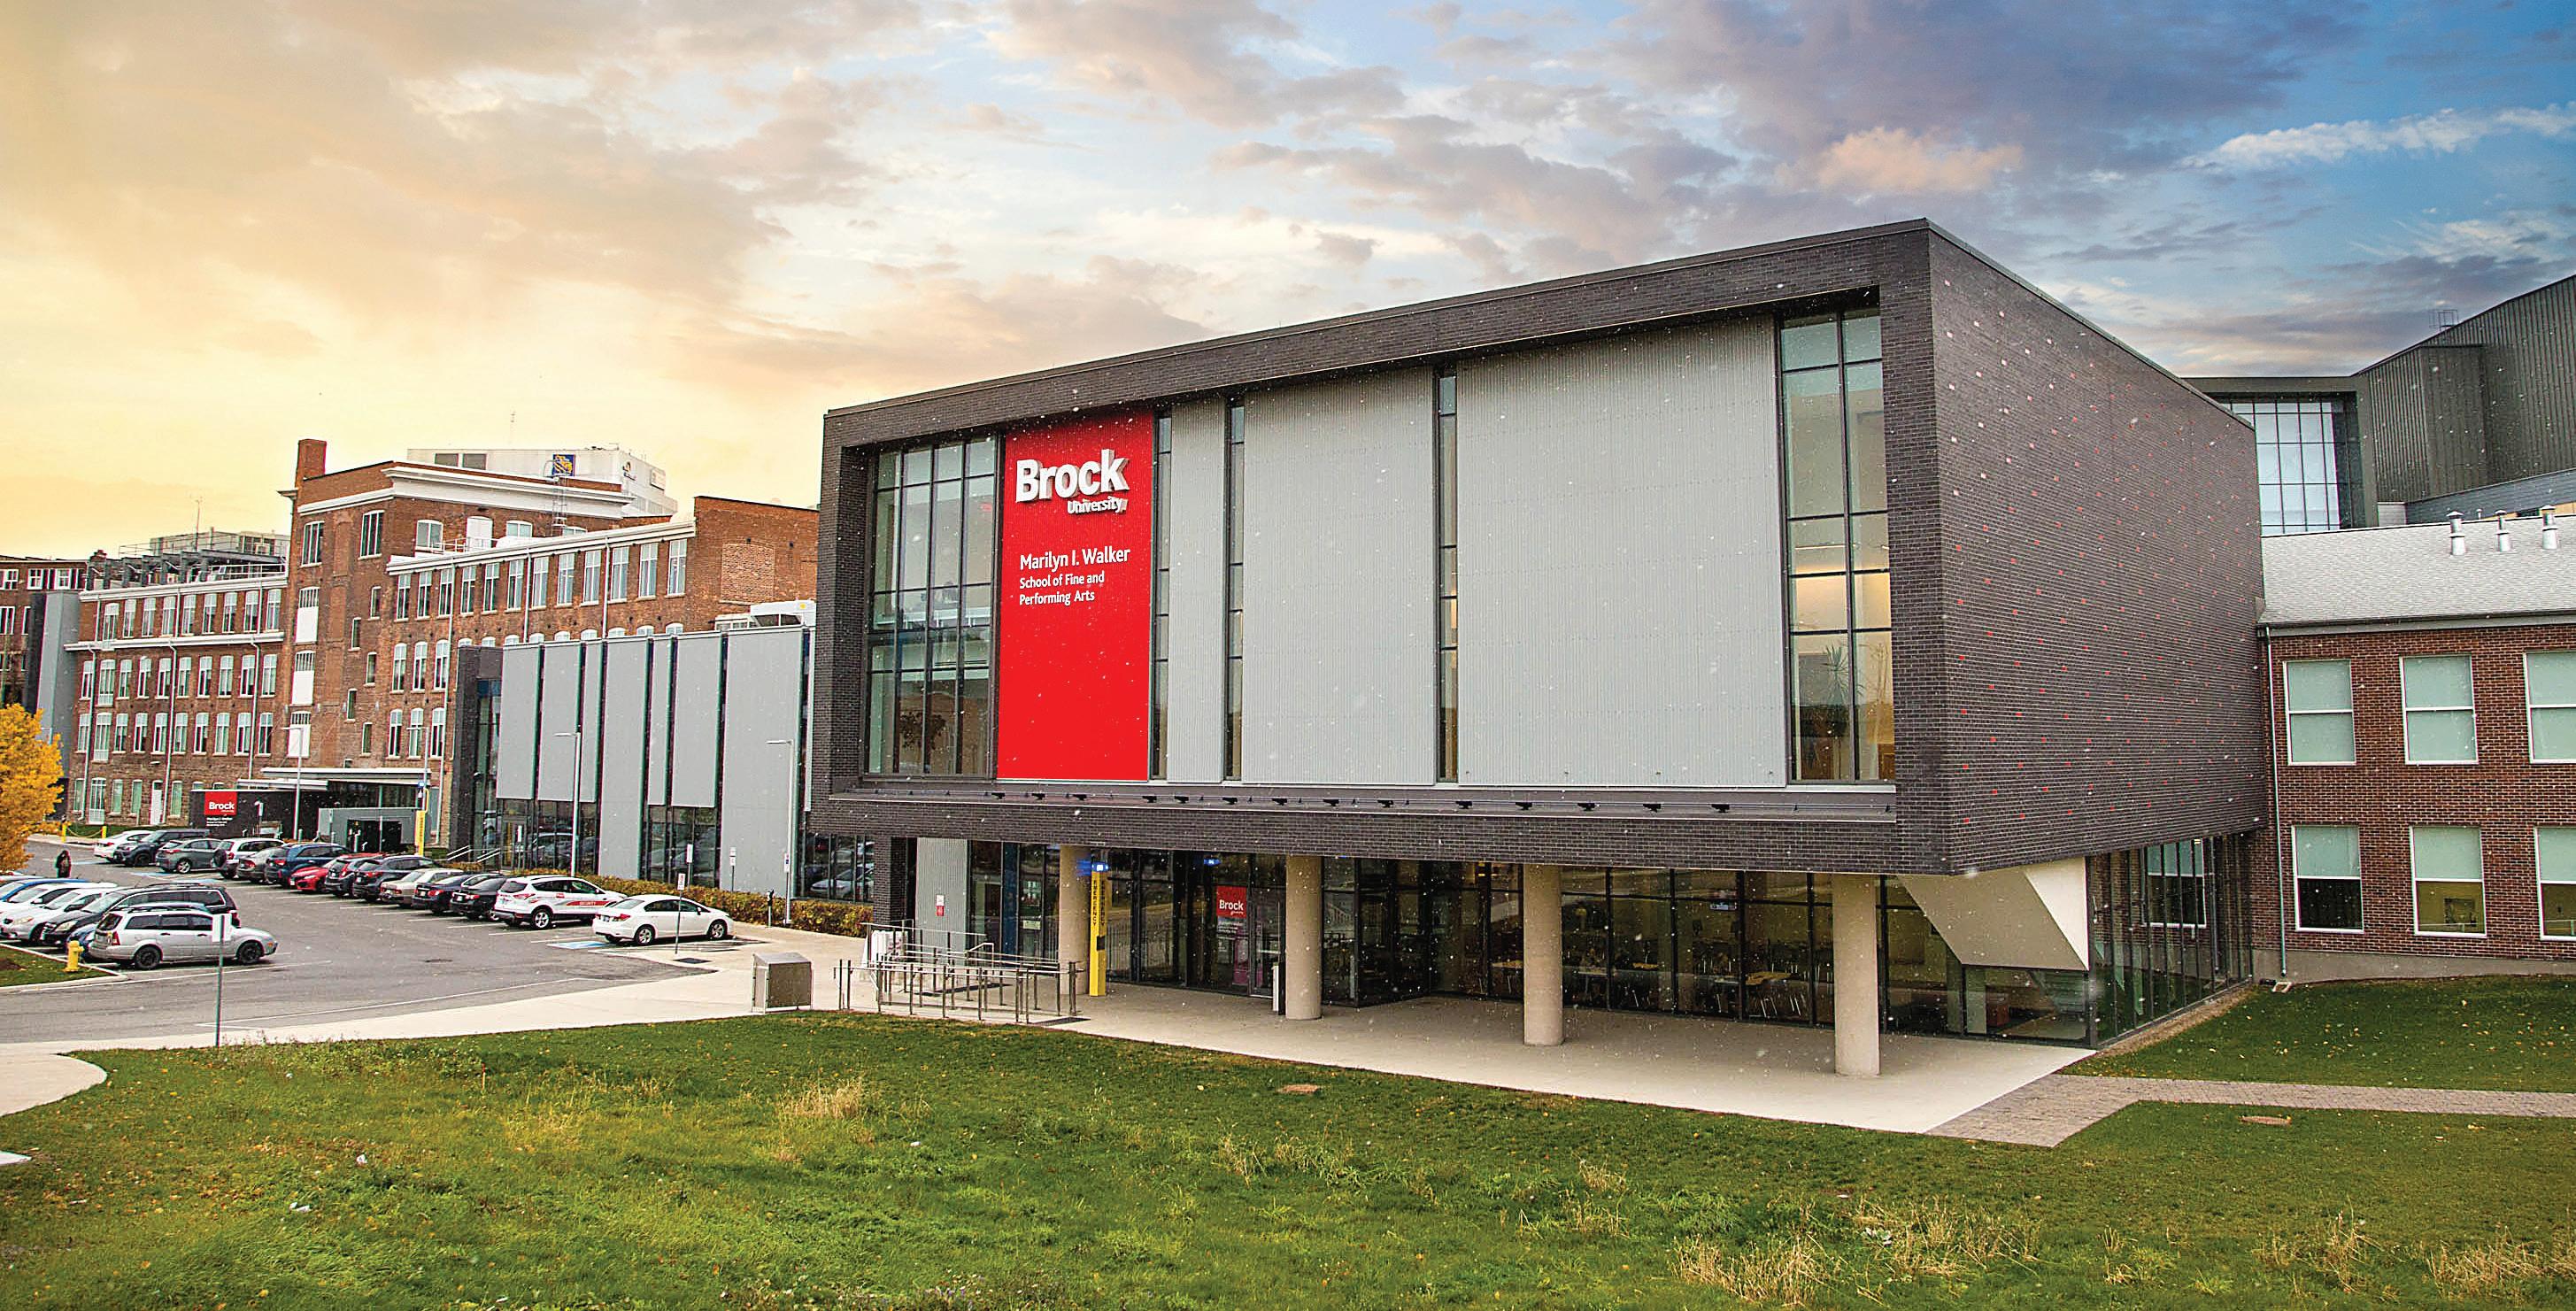
Marilyn I. Walker School of Fine and Performing Arts construction completed
Goodman School of Business expansion and Rankin Family Pavilion substantially completed
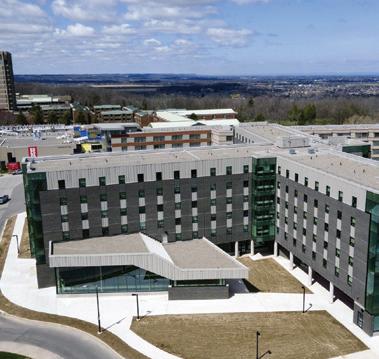
Residence 8 construction completed
Canada Games Park completed
Acquired Schmon Parkway site
Funding budget
The funding budget is used to communicate the revenue targets and expense authority that support the teaching, research, scholarly, creative and service activities of the University. It fundamentally tracks where cash has been allocated. Figure 39 details the funding budget for 2024-25 in comparison to the 2023-24 budget and 2022-23 actuals. Some reclassifications were made to the 2023-24 budget for comparison purposes when the overall funding budget was not impacted. See Appendix B for a reconciliation of these reclassifications.
The 2024-25 budget includes a mitigation target of $10.1 million to be found through a combination of in-year savings as well as the use of the contingency reserve discussed previously in this budget report. This compares to mitigation targets from previous years' budgets, including the $4-million mitigation target as part of the 2023-24 budget. As noted on page 2, the 2023-24 budget included $1.5 million use of contingency reserve reported in inter-fund revenue. For 2024-25 use of the contingency reserve is not included in inter-fund revenue as it is Brock's goal to minimize its use by fiscal year-end, therefore it is shown only as a mitigation target.
Figure 39
Revenue assumptions
Student fees
Student fees include both tuition and fee revenue and represent 49 per cent of total revenue (50 per cent in 2023-24). Student fees are budgeted to be $188.8 million for 2024-25, detailed in Figure 40, which represents a $5.8-million decrease as compared to the 2023-24 budget.
Tuition revenue
Tuition revenue, defined as a fee charged for educational instruction, is budgeted to be $177.7 million, $5.4 million lower than the 2023-24 budget. Figure 41 on the following page details 2024-25 tuition related to credit and non-credit courses as compared to the 2023-24 budget and 2022-23 actuals.
Of the total tuition revenue, $174.6 million relates to credit courses, which is budgeted in the University Global responsibility centre. The tuition for credit courses is detailed by Faculty of major, split by graduate/undergraduate and domestic/international. Total domestic tuition is budgeted to be $111.6 million, which is $4.6 million more than the 2023-24 budget. Total international tuition is budgeted to be $61.0 million, which is $10.9 million less than the 2023-24 budget. The budget also includes $2.0 million for additional tuition related to an effort to increase enrolment during the Spring/Summer term with the objective of further integrating the term as part of the regular academic schedule at the University.
Figure 40: Student fees
Figure 41: Tuition revenue
(1) Represents tuition
Ministry reported enrolment. The figures are based on Faculty
(2) Includes letter of permission, non-degree students and auditors.
(3) At the time of preparing the 2023-24 Budget the specific domestic tuition anomalies were not yet approved by the MCU. The $1.6 million represented an estimate. For the 2024-25 budget, the MCU-approved anomalies are included in the respective Faculties.
(4) Represents tuition related to enrolment which is not included in Ministry reporting.
Note: although Figure 41 details tuition by Faculty of major, the revenue and expense allocation model explained in the Revenue and expense allocation model section of this report has been adopted and records tuition based on where students take their courses (i.e. teaching Faculty).
The previous page includes a reconciliation of the overall change in tuition budgeted for 2024-25 compared to the 2023-24 budget with three main factors. The first is the difference of the 2023-24 budgeted tuition to the 2023-24 actual tuition (estimated at trimester two). This variance of $8.9 million is fully described in the 2023-24 Trimester 2 Report available at brocku.ca/about/university-financials/ The second factor is the $0.3 million reduction due to enrolment change as compared to 2023-24 forecasted actuals. The centrally managed enrolment projection model is described in the ‘Enrolment forecasting’ section of this report starting on page 25. As detailed in Figure 42, these projections resulted in all-in enrolment related to credit courses forecasted to increase 1.1 per cent over 2023-24 forecasted actual enrolment.
The final factor impacting tuition is the tuition rate change impact of $3.8 million as compared to 2023-24.
For an explanation of the tuition fee policies for both government-funded programs and non-government funded programs as well as the approved tuition fee increases for 2024-25 see Appendix D. Tuition rates for domestic students are regulated by the MCU. On Feb. 27, 2024, Brock received a memo from the MCU titled “Supporting a Sustainable Postsecondary Education System,” announcing an extension of the general domestic tuition freeze for at least the next three years. Further, the memo provided institutions the flexibility to increase tuition for domestic out-of-province students up to five per cent per year, as well as those institutions that were approved for tuition increases as part of the 2023-24 tuition anomalies process can continue to increase tuition up to a maximum of 7.5 per cent per year for first-year incoming students and continuing students that started in 2023-24. Brock implemented both of these allowed rate increases, as detailed in Appendix D. Overall, the domestic rate increases contribute $2.3 million of the total tuition rate impact.
International students and other programs that do not receive government grant funding are not regulated by the MCU. For undergraduate international tuition, a new cohort model was introduced in 2022-23, which sees an eight per cent increase each year for Year 1 students only.
Figure 42: All-in student headcount by type (1)
(1) 'All-in' includes letter of permissions, non-degree students, auditors, additional qualifications and certificates. Starting in the 2024-25 Budget Report all-in headcount no longer includes Continuing Teacher Education enrolment. The prior year actuals and budgets have been adjusted for comparability.
Tuition rates are then frozen for four additional years to provide students with a total of five years of fixed tuition rates to assist with budget planning and fiscal stability for their four-year degree program, with one additional year to graduate. After the fifth year, the tuition rate would revert to the incoming Year 1 tuition rate. The cohort model for tuition rate increases for international students represents a response to the insights of Brock University units directly working with international students and recognizing that these students would experience significant benefits from having a direct line of sight for tuition rates for all years of study for their program.
International graduate professional programs, including International Student Programs (ISP) tuition rates will be increased by five per cent over 2023-24. Conversely, the international research-based master's and PhD programs tuition rates will see a reduction of 14.16 per cent over 2023-24. This decrease will bring the tuition closer to the average tuition of Ontario universities. This decrease in tuition rates is combined with a reduction in the PhD fellowship amount to partially offset the reduced tuition revenue. Overall, the net impact of international tuition rates changes is a tuition increase of $1.6 million.
The budgeted tuition related to non-credit courses is $3.1 million. ESL revenue is budgeted to be $1.5 million, which is consistent with the 2023-24 budget. Professional and Continuing Studies are budgeting tuition revenue of $0.8 million for 2024-25, which is an increase of $0.6 million compared to the 202324 budget. Continuing Teacher Education, which is reported as part of the Faculty of Education, constitutes the remaining type of tuition revenue and is budgeted to be $0.8 million.
Enrolment forecasting
Enrolment projections – undergraduate There are two key assumptions in projecting undergraduate enrolment: intake targets for Year 1 and the retention behaviour of current students. For intake purposes, students are classified on the basis of their admission status. Based on observation, each group behaves differently in terms of their retention status: (1) domestic students directly from secondary school, (2) domestic students not directly from secondary school, and (3) international students. Figure 43 displays the undergraduate Year 1 (full-time) intake headcount projections for 2024-25 as compared to prior years.
Figure 43: Year 1 intake headcount (undergraduate)
Intake targets are set through collaboration and consultation with units across the University, including the Faculties. For the purposes of the 2024-25 budget, Year 1 intake is projected to see an increase of 4.8 per cent over 2023-24 actuals, as shown in Figure 43. Year 1 intake is dependent on applications received. As of early April 2024, Brock has seen a year-over-year application growth of 1.4 per cent, continuing several years of growth. Brock's undergraduate applications directly from secondary school are up 3.5 per cent over 2023, as shown in Figure 44, which is over and above the 14.3 per cent growth that occurred last year. Though not uniformly, this rebound is occurring across all Faculties except for the Goodman School of Business, though the growth is primarily among domestic populations.
Figure 44: Domestic applications directly from secondary school
Applicant behaviour remains extremely unpredictable. Numerous factors continue to influence students including increased competition, visa processing delays, new immigration policies including Provincial Attestation Letters and enrolment caps, and disruptions to student mobility caused by economic or geopolitical factors. It is also notable that there is a system-wide trend of prospective students submitting more applications than historical norms, presumably a reflection of a level of uncertainty and a desire to explore more options. In the next phase of the cycle, the emphasis shifts to convert admitted applicants into registered Brock students. A suite of conversion activities is underway. Some highlights include the campus tour program, which welcomed more than 1,000 guests for March Break alone, outbound communications which include more than 8,000 outbound calls to applicants as well as multiple rounds of email and SMS (texting) communication, and Open House which welcomed 4,500-5,000 guests on April 7.
These efforts and activities drive to the applicant confirmation deadline of June 1, followed by the academic summer orientation program Smart Start, which supports students through their transition and course registration process.
(1) Intake in Education is related to the new Bachelor of Arts in Education Studies program that is starting in 2024.
Source: Data was extracted from the PowerBI application details as of March 20, 2024. Figures may differ from prior year as Power BI is a fluid data source.
In Ontario, this cycle has set new benchmarks for applicants from the GTA and Niagara as well as across the province. There is strong growth among students applying directly from secondary schools as well as from other pathways, including university and college transfer populations. International applications have declined, reflecting geopolitical and regulatory uncertainly, however admitted students and students who have accepted their offers of admission are tracking higher than last year. India and China remain the two largest source countries for international applications; however, a renewed international diversification strategy has resulted in a higher proportion of applications coming from other markets (Africa, East Asia, the Middle East and South Asian markets outside of India).
The Year 1 intake figures are then combined with retention and progression rates, as well as movement to and from full-time and part-time status (retention behaviour), to determine a total returning undergraduate headcount. This retention behaviour is determined by reviewing historical enrolment patterns. As an example, Figure 45 shows the return or retention rates of students who entered the University directly from secondary school in 2022 into the 2023-24 year. Note: retention rates by Faculty are detailed in Figure 22 on the The Big Picture pullout.
Figure 45
Source: November 1 PFIS-USER submissions for both 2022 and 2023, and the 2023 academic year Consortium for Student Retention Data Exchange (CSRDE) submission.
After these considerations, for the purposes of the 2024-25 budget, total undergraduate all-in headcount is forecasted to increase by 176 students or one per cent as compared to 2023-24 actual headcount, as shown in Figure 46. The growth in enrolment is seen in almost all Faculties, the largest being the Faculty of Applied Health Sciences and the Faculty of Education. Offsetting these increases is a decrease in forecasted enrolment for the Goodman School of Business. Overall domestic undergraduate enrolment is forecasting an increase of 2.5 per cent as compared to 2023-24 which is offset by a forecasted decrease in international undergraduate enrolment by 12.4 per cent.
Figure 46: Undergraduate all-in headcount
Source: Figures represent the number of students in each Faculty of major on Nov. 1 of each academic year (as per PFIS-USER submissions). In addition, figures also include new entry enrolments as of Feb. 1 for Technological Education programs.
(1) Starting in the 2024-25 Budget Report the Faculty of Education reported enrolment no longer includes Continuing Teacher Education enrolment. The 2023-24 Actual enrolment has been adjusted for comparability.
Enrolment projections – graduate
Graduate enrolment projections are produced with intake targets from the Faculty of Graduate Studies and Postdoctoral Affairs and then combined with historic progression, retention and graduation rates of continuing graduate students. For the purpose of the 2024-25 budget, overall graduate enrolment is forecast to experience an increase of 30 students or 1.7 per cent over actual 2023-24 headcount enrolment. As shown in Figure 47, the Faculty of Applied Health Science, Faculty of Humanities and Faculty of Social Science are forecasting respective growth in graduate enrolment of 38, 17 and 9 additional students as compared to 2023-24. Decreased graduate enrolment is forecasted in the Faculty of Education with 17 students, Goodman School of Business with 10 students, and the Faculty of Mathematics and Science with 7 less students
as compared to 2023-24. As of March 15, 2024, the number of graduate applications are 0.25 per cent higher than this date last year, the number of admitted offers are up 14 per cent and confirmations are more than 60 per cent higher.
For both undergraduate and graduate enrolment once the total forecasted headcount is determined, it is then translated into full-time equivalents (FTEs) based on historical fulltime/part-time student enrolment patterns, which are then combined with the tuition rates to calculate tuition.
Source: Figures represent the number of students in each Faculty of major on Nov. 1 of each academic year (as per PFIS-USER submissions). In addition, figures also include new entry enrolments as of Feb. 1 for certain International Student Programs (ISPs).
Fee revenue
Fee revenue is budgeted to be $11.1 million, which is $0.4 million lower than the 2023-24 budget. Fee revenue includes both ancillary fees and other student fees.
Ancillary fees are established by student referendum, according to the ancillary fee protocol, and agreed to with the Brock University Students’ Union (BUSU) and Graduate Students’ Association (GSA). Some fees can increase automatically (i.e. either each year or after the Consumer Price Index has accumulated to five per cent since the last fee increase). Ancillary fees are all assessed and collected by the University, and are either administered by the University, BUSU or the GSA. Note: only the University-administered ancillary fees are included as part of the funding budget. The setting of ancillary and administrative fees was delegated to the President and VicePresident, Administration at the Dec. 1, 2016 Board of Trustees meeting.
Figure 47: Graduate all-in headcount
University-administered ancillary fees are budgeted to be $7.5 million ($7.3 million in 2023-24). Figure 48 details the ancillary student fees, including noting the department where the fee is reported.
Figure 48: Ancillary student fees
($000s)
(1) $1.6 million is reported in Brock Sports and Recreation and $0.6 million in Student Wellness and Accessibility.
(2) Reported in Brock Sports and Recreation.
(3) Reported in the Financing unit.
(4) Reported in Student Wellness and Accessibility.
(5) Reported in Human Rights and Equity Services.
(6) Reported in the Hadiyaˀdagénhahs First Nations, Métis and Inuit Student Centre.
Other student fees of $3.7 million ($4.3 million in 2023-24) are included as part of fee revenue in the 2024-25 budget. Other student fees include the International Student Recovery Fee, which is offset by a reduction in the MCU operating grants (International Student Recovery), calculated as $750 per international student. This fee is charged to international students and results in $1.61 million ($1.79 million in 2023-24) of revenue in 2024-25. It is reported as part of the University Global responsibility centre.
Also included in other student fees are program specific fees charged by the program in which a student is enrolled. Included in this figure are $1.71 million ($2.02 million in 2023-24) of co-op fees (reported in Co-op, Career and Experiential Education), $0.19 million ($0.28 million in 2023- 24) of ESL ancillary fees for international students (reported in ESL) and $0.17 million ($0.18 million in 2023-24) related to the Business English and Skill Transition fee for International Student Program participants in the Goodman School of Business.
Grant revenue
Grant revenue, as reported in the 2024-25 budget, includes MCU operating grants and other operating and specific purpose grants. Grant revenue represents 28 per cent of total revenue (27 per cent in 2023-24 budget), and is budgeted to be $105.6 million for 2024-25, which is detailed in Figure 49. Grant revenue is budgeted to increase $0.3 million compared to the 2023-24 budget and $3.3 million compared to actual 2022-23.
Figure 49: MCU Operating grants
Ministry of Colleges and Universities Operating grants
As detailed in Figure 49, MCU operating grants include the Core Operating Grant (COG), the Differentiation Envelope and the Special Purpose Operating Grant Envelope, offset by the International Student Recovery, all of which are MCU funded.
Differentiation Envelope
In 2019, the MCU announced that performance/ outcomes-based funding would be implemented starting in 2020-21 as part of the Strategic Mandate Agreements 2020-25 (SMA3) process. The SMA3 links 10 metrics (nine system-wide and one institution specific) to performance/outcomes-based funding through two priority areas – skills and job outcomes and economic and community impact. These metrics are shown in Figure 33 on page 17.
This funding model includes tying a larger portion of funding to metric performance, through the Differentiation Envelope, as described in the 'Budget Environment' section starting on page 15 of this report. Each university’s Differentiation Envelope proportion varies and is capped at the system average. The metrics
tied to the Differentiation Envelope did not impact the grant funding for 2020-21, 2021-22 or 2022-23. The MCU has recently made the decision to move forward with activating performance-based funding starting in 2023-24 at a system-wide proportion of 10 per cent and 25 per cent for 2024-25. For 2024-25, Brock’s Differentiation Envelope is budgeted to be $55.9 million, which represents 61 per cent of the total MCU operating grants. This includes an estimated reduction of $0.07 million related to the performance metrics tied to this grant. Also included in this amount is $2.6 million of additional grant expected to be received for 2024-25 related to the Postsecondary Education Sustainability Fund announced by the MCU on Feb. 27, 2024. This grant is reported in the University Global responsibility centre. It is anticipated that Brock will receive additional funding related to the $903 million increase in the Province's budget; however, no additional funding was assumed in this budget given that no commitment has been received in writing.
Core Operating Grant
The COG represents the portion of the MCU operating grants that are related to enrolment. The COG funding continues to be governed by an enrolment corridor mechanism, with Brock's midpoint weighted grant units (WGUs) multiplied by the global WGU rate to determine the COG. The corridor midpoint includes actual enrolment levels in 2019-20, including graduate spaces (master’s degrees and PhDs) achieved up to target in SMA2, meaning the additional growth beyond 2019-20 levels does not receive additional incremental funding. Brock is budgeting the COG to be $34.5 million in 2024-25, which is reported in the University Global responsibility centre. The budget for the COG was established based on MCU communication to date.
The 2024-25 budget for the COG, in combination with the Differentiation Envelope, represents $90.3 million, which is consistent with the 2022-23 actuals with the exception of the incremental funding for the sustainability fund and the reduction for the metrics performance results. Included in the COG in the 2023-24 budget was $2.1 million of grant revenue related to Teacher Education funding, which has been eliminated by the Province for 2024-25.
Special Purpose Operating Grant Envelope
There is also a third major component of the MCU operating grants, the Special Purpose Operating Grant Envelope, which represents funding by which the government is able to address system priorities, such as initiatives to support Indigenous learners and students with disabilities. For the purposes of the 2024-25 budget, this envelope includes a number of MCUfunded grants, as detailed in Figure 50.
Figure 50: Special Purpose Operating Grant Envelope
• Grant in Lieu of Municipal Taxation: The MCU provides subsidies to universities to pay their municipal taxes. The municipal tax (payment in lieu of property taxes) is based on a charge of $75 per domestic FTE; however, the related grant does not change with enrolment. The 2024-25 tax payments are budgeted to be $1.26 million ($1.23 million in 2023-24) and the grant is budgeted to be $1.10 million ($1.11 million in 2023-24); therefore, $0.16 million is budgeted to be unfunded through this grant. Both the grant revenue related to the Grant in Lieu of Municipal Taxation and the offsetting payment in lieu of property taxes are reported as part of the Utilities, Taxes and Insurance responsibility centre.
• Grants for Students with Disabilities: The MCU provides funding to support a wide range of services for students with disabilities through the Access Fund for Students with Disabilities (AFSD) and the Disabilities Interpreters fund. These services include access to adaptive computer and software learning technology; arranging notetaking for students who are visually impaired; and interpreter services for students who are deaf, deafened and hard of hearing. Brock’s funding for 2024-25 is budgeted to be $0.86 million ($0.86 million in 2023-24). The grant revenue related to these grants is shown as part of Student Wellness and Accessibility.
• The Indigenous Student Success Fund: The MCU supports Indigenous students through funding for student support initiatives, academic enrichment and partnership initiatives. The 2024-25 budget for this funding is $0.34 million ($0.34 million in 2023-24), which is reported in Hadiyaˀdagénhahs First Nations, Métis and Inuit Student Centre.
• Credit Transfer Grant: The MCU funds support for post-secondary education transfer mobility initiatives. The 2024-25 budget for this funding is $0.24 million ($0.25 million in 2023-24), which is reported in The Office of the Registrar.
• Ontario Post-Secondary Access and Inclusion Program: The MCU provides funding to support students that might not otherwise access postsecondary education. The 2024-25 budget for this funding is $0.31 million ($0.31 million in 2023-24), which is reported in Student Life and Success.
• Campus Safety Grant: The MCU provides funding to support sexual violence prevention and campus safety efforts at publicly assisted post-secondary institutions. The 2024-25 budget for this funding is $0.13 million ($0.13 million in 2023-24), which is reported in Human Rights and Equity Services.
• Mental Health Grants: The MCU funds the Mental Health Support for Post-Secondary Education Students Grant and the Mental Health Workers Grant. These grants support mental health initiatives for students. The 2024-25 budget for this funding is $0.14 million ($0.14 million in 2023-24) and $0.10 million ($0.10 million in 2023-24), respectively. Both are reported in Student Wellness and Accessibility.
• Also included in the Special Purpose Operating Grant Envelope is the First Generation Bursary funding and the Ontario Remembrance Scholarship Grant. The grant revenue and their offsetting scholarship and bursary expenses are shown as part of the Scholarship, Bursaries and Fellowships responsibility centre.
International Student Recovery (ISR)
The ISR offsets MCU operating grants by $750 for every undergraduate- and master’s-level international student. This reduction is budgeted to be $1.61 million in 2024-25 ($1.79 million in 2023-24) and is reported in the University Global responsibility centre.
Other MCU and specific-purpose grants
The University receives a number of other MCU grants, not included as part of the ‘MCU operating grants,’ as well as a number of other specific-purpose grants, from other levels of government and other granting agencies, detailed in Figure 51.
51: Other MCU and specific-purpose grants
Figure
Nursing Grant
The 2024-25 budget for the Nursing grant is $6.0 million ($6.2 million in 2023-24). While the MCU has committed to funding increased enrolment in nursing education programs in publicly assisted colleges and universities across the province, uncertainty still exists on how much funding for nursing students will be available. However, it is expected that Brock will be fully funded for all undergraduate enrolment in Nursing for 2024-25. At the time of writing this report, we have received no official communication regarding the funding of the master’s Nursing students, and are therefore budgeting that these will remain unfunded in 2024-25. This grant is reported in the University Global responsibility centre.
Research Support Fund
The Research Support Fund is a Government of Canada funding program to assist Canadian post-secondary institutions in offsetting the cost of administering research awards from the three federal granting councils (Natural Sciences and Engineering Research Council, Social Sciences and Humanities Research Council and the Canadian Institute of Health Research). Brock receives funding to support the indirect costs incurred on Tri-Council-funded research through the program. These costs can include maintenance and utilities of libraries and laboratories, salaries for staff or students who provide research administration support, training costs for workplace health and safety, or the administrative costs associated with getting a patent. The amount is determined by a formula that incorporates a base amount and the average of the last three years of research funding from the three agencies. Brock’s funding is estimated to be $2.7 million for 2024-25 ($2.5 million in 2023-24). This $2.7 million includes $0.06 million related to additional dedicated security research funding provided by the federal government to equip Canadian research institutions and their research teams with the tools and knowledge to secure their research. The Research Support fund is reported as part of the Research Enterprise.
Facilities Renewal Program funds
The provincial Facilities Renewal Program (FRP) funds are intended to supplement post-secondary institutions' own programs that address the ongoing need for maintenance, repair, renovation and modernization of existing facilities. FRP funding also helps ensure that facilities are well maintained and provide a safe environment for faculty, staff and students. On June 7, 2023, the MCU announced that the funding amount for Brock for 2023-24 would be cut by $0.3 million to $3.6
million. Communication related to 2024-25 had not been received at the time of budget preparation, as such the budget for 2024-25 is consistent with 2023-24 actuals at $3.6 million. The grant revenue related to the Facilities Renewal Program funds is reported in the Capital responsibility centre. The specific projects the Facilities Renewal Project Funds are being used for are detailed as part of the capital and related project budget, starting on page 76.
Other specific-purpose grants
Included in other specific-purpose grants are a number of special grants, including the following:
• A number of MCU funded grants that support both graduate and undergraduate student scholarships in the amount of $0.9 million, including Ontario Graduate Scholarships, Queen Elizabeth II program, First Generation Bursaries and Ontario-Ukraine Solidarity. These grants and their offsetting scholarship expenses are included in the Scholarships, Bursaries and Fellowships responsibility centre.
• Funding from the Niagara Region to support capital related spending in 2024-25 of $0.2 million is included in the University Global responsibility Centre.
• Global Skills Opportunity grant of $0.2 million is funded by Employment and Social Development Canada and aims to empower post-secondary institutions to increase the participation of young Canadians in international learning opportunities. The grant is included in Brock International and the Goodman School of Business.
• Canada Summer Jobs grants of $0.5 million are shown in a number of units in the University.
Internal chargebacks
Internal chargebacks represent revenue received by units within the University for services performed or goods received from other units. The offsetting expenses are within the operating costs of those units that received the service. Internal chargeback revenue is budgeted to be $13.7 million in 2024-25 ($11.7 million in 2023-24) and includes the following:
• Charges for utilities from the Utilities, Taxes and Insurance responsibility centre, mainly to Housing Services, of $1.58 million ($1.67 million in 2023-24).
• Charges for printing and binding of $0.73 million ($0.78 million in 2023-24) from Printing and Digital Services.
• Facilities Management charges for services, including salary, custodial, grounds and maintenance chargebacks of $0.78 million ($0.57 million in 2023-24).
• Campus Safety chargebacks of $0.12 million ($0.12 million in 2023-24), mainly to Housing Services.
• Information Technology Services charges of $0.40 million ($0.40 million in 2023-24), mainly to Housing Services.
• Campus Store charges for goods purchased by units within the University of $0.15 million ($0.15 million in 2023-24).
• Conference Services chargebacks of $0.13 million ($0.13 million in 2023-24).
• Animal Care chargebacks, as part of the Research Enterprise of $0.10 million ($0.08 million in 2023-24).
• Faculty of Mathematics and Science chargebacks for Machine and Electronic Shop and Mass Spectrometer/Nuclear Magnetic Resonance charges of $0.07 million ($0.06 million in 2023-24).
Also included in internal chargebacks are interdepartmental transfers of funds to support operations. The 2024-25 budget includes the following:
• Funding from Ancillary Services and Housing Services to support the financing of the debt payments, including the 2020 Bond Debenture in the amount of $5.0 million ($3.2 million in 2023-24). See page 37 for details of the debt financing.
• Funding of the Ancillary Services and Housing Services portion of the capital budget in the amount of $4.1 million ($4.0 million in 2023-24). See page 76 for details of the capital budget.
• Additional interdepartmental transfers include several smaller transfers within and between units related to specific projects and initiatives.
Inter-fund revenue
Inter-fund revenue represents transfers from various funds, including reserves to support operating activities. Inter-fund revenue is budgeted to be $8.2 million in 2024-25 ($12.7 million in 2023-24) and includes the following:
• Endowment funding supporting scholarships, bursaries, and fellowships of $2.68 million ($2.70 million in 2023-24). This revenue is offset by interfund expenses for the same amount. For further information on this transfer, see page 83.
• Transfers from Government of Canada, Canada Research Chairs’ grants to fund a portion of the chair holders' salaries and other costs of $0.80 million ($0.74 million in 2023-24), shown in the Faculty of Social Sciences, the Faculty of Mathematics and Science, Faculty of Applied Health Sciences and the Research Enterprise.
• Transfers from strategic funds of $3.29 million ($5.80 million in 2023-24).
- Included in these transfers are $2.89 million ($4.90 million in 2023-24) from the President; Provost; Vice-President, Research; Vice-President, External and the Central Institutional strategic initiative funds to support various initiatives within the University, including $1.72 million to support Engineering, $0.33 million to support Development and Alumni Relations, $0.32 million to support the rental costs of the temporary site of the Burlington Campus and various other small amounts to support other strategic initiatives in the University.
- Also included in these strategic fund transfers are $0.41 million ($0.91 million in 2023-24) from the Dean’s Strategic Funds to support ongoing operations in the Faculty of Social Science ($0.34 million), Faculty of Applied Heath Sciences ($0.02 million) and Institutional Planning, Analysis and Performance ($0.05 million).
- Included in the 2023-24 budget was $1.7 million of strategic funding supporting Professional and Continuing Studies (PCS). This is not included in the 2024-25 budget as PCS is approaching a selfsustaining model and is no longer drawing from reserves.
• Spending allocations from Marilyn I. Walker School of Fine and Performing Arts Endowment Fund of $0.52 million ($0.54 million in 2023-24), shown in the Faculty of Humanities.
• Spending allocations from other endowments and non-endowed trusts of $0.27 million ($0.30 million in 2023-24), shown in Co-op, Career and Experiential Education, Goodman School of Business and the Faculty of Humanities.
• A number of other small transfers from operating projects, research projects, external research grants and course fee revenue.
• Included in the 2023-24 budget was $1.50 million from the contingency reserve and $0.72 million from the capital project reserve. Intentionally not budgeted in 2024-25, the remaining mitigation to a maximum of $6.1 million will be included in inter-fund actuals from the contingency reserve at year-end.
Other revenue
Other revenue represents revenue from ancillary operations, investment income, sales and services, and asset sale revenue, and represents 17 per cent of total revenue (17 per cent in 2023-24). As detailed in Figure 52, other revenue is budgeted to be $66.4 million, an increase of $0.6 million over the 2023-24 budget and $2.7 million over 2022-23 actuals.
Ancillary revenue
Total ancillary revenue budgeted in 2024-25 is $44.64 million ($40.80 million in 2023-24). This budget represents an increase of $3.84 million over the 2023-24 budget and an increase of $5.96 million over 2022-23 actuals. Housing Services fees are budgeted to be $26.56 million in 2024-25, resulting from a budgeted occupancy rate of 97.0 per cent as compared to the 95.5 per cent occupancy budgeted in 2023-24. Other ancillary revenue is budgeted to grow over the 2023-24 budget by $2.20 million driven by additional revenue expected in 2024-25 from Brock hosting the athletes village for the World Rowing Championships being held in Niagara in 2024. This revenue is shown in Conference Services ($1.6 million) and Dining ($0.9 million). Parking Services is also budgeting an increase in revenue offset by a decline in the Campus Store.
Investment income
The 2024-25 budgeted investment income is $2.20 million ($2.20 million in 2023-24). This represents interest income the University receives on short-term investments. If interest rates remain elevated it is anticipated this revenue line will generate a significant positive variance which will be used towards the in-year mitigation target. The reason that an increase was not built into the budget is interest rates will eventually fall and if an increase is structurally built into the budget then this will create a structural deficit when rates decrease.
Sales and services
Income generated from sales and services represents a wide variety of sources, including the following: Ontario University Application Centre revenue; recreation and youth program revenue, including aquatic centre instructional fees; various service fees charged on student accounts; health insurance reimbursement; intramural fees and Brock Sports Performance Centre fees; affinity revenue; rental income from Heritage Place Plaza and the Schmon Parkway site; revenue from programs, such as Goodman Group programming, BOOST, and international learning programs; co-curricular programming including Med Plus, Law Plus and Fit Link; chargebacks to external units, including utilities; contributions from the pension plan for pension related expenses; contributions from the endowment fund for endowment-related expenses; and student printing fees.
Asset sale revenue
The asset sale revenue budgeted in 2023-24 relates to the sale of the Hamilton campus, which finalized in 2023-24. This was reported in the University Global responsibility centre.
Figure 52: Other revenue
53: Personnel costs
(1) Faculty & Professional Librarians – BUFA members, Associate Deans, Associate Vice-Presidents of Research and Associate Librarian; Admin/ Professional – ongoing administrative/professional and exempt staff; OSSTF – support and technical staff; CUPE 1295 FT – full-time maintenance, trades and custodial staff; SAC – Senior Administrative Council; Other ongoing – CUPE 4207-2, CUPE 4207-3 & IATSE; CUPE 4207 – Unit 1 –instructors, teaching assistants, lab demonstrators, course co-ordinators and marker/graders; Other temporary – all other temporary teaching and non-teaching positions, Faculty overloads and stipend transfers.
Operating cost assumptions
Personnel costs
Personnel costs include salaries/wages, benefits and pension costs and represent 67 per cent of the total budgeted costs (65 per cent in 2023-24). Personnel costs are budgeted to be $262.2 million which is an increase of $6.5 million from the 2023-24 budget, as detailed in Figure 53.
Total full-time equivalent (FTE) salaried staff and faculty members (including BUFA limited-term and instructional limited-term faculty appointments) included in the 2024-25 budget is 1,654, which represents a decrease from the 2023-24 budget of 72 FTEs. The decrease is a result of the University taking steps to address the significant budget shortfall. This decrease in FTEs is mainly seen in Admin/Professional, OSSTF and SAC. FTEs by unit are detailed in the snapshot section on pages 44 to 75.
Benefit and pension costs include employer contributions to the Brock University Pension Plan as well as dental, medical and statutory taxes (CPP, EI, EHT and WSIB). Also included is funding of the University’s pension plan deficit obligation. Both the pension plan obligation and the employee future benefits reserve are more fully described starting on page 35 of this report.
Figures 54 and 55 detail personnel costs for part-time teaching by Faculty and by personnel group. Note: the amounts in these figures include stipend transfers,
which in some cases would have an offsetting amount in another unit of the University. The lower part-time teaching costs as compared to the 2023-24 budget is the result of both a lower enrolment forecast as well as mitigation efforts.
(1) Includes salaries and benefits in teaching Faculties for the following: CUPE 4207 – Unit 1, non-union instructors, BUFA overload, stipend transfers and CUPE 4207 – Unit 3.
55: Part-time teaching by personnel group(1)
(1) The figures above include part-time teaching costs reported in the teaching Faculties only. Budgets
Figure 54: Part-time teaching by teaching Faculty (1)
Figure
Figure
Figure 56 shows personnel costs and personnel costs as a percentage of operating costs prepared in accordance with accounting standards for not-for-profit organizations (NFPS) since 2016-17.
compared to the prior valuation. In addition, current service cost and money purchase payments for the plan total $14.1 million for a total cost to the University of $14.6 million annually. Employees also contribute to the money purchase component of the plan (defined contribution) an additional $8.2 million resulting in an employer to employee funding ratio of 1.8 to 1.0.
(1) Represents figures prepared in accordance in accordance with Canadian accounting standards for not-for-profit organizations (2016-17 to 2022-23), and have been audited by KPMG LLP (independent auditors).
(2) Represents trimester two forecast figures converted to NFPS
(3) Represents budget figures converted to NFPS.
Pension
The pension plan continues to be a topic of interest at our University and for many universities across the province. Our plan’s historical returns are illustrated in Figure 57. Increased diversification of plan assets into infrastructure and real estate assets over the past five years have contributed to investment performance. Every three years, the financial health of the plan is recalculated through an actuarial valuation. The actuarial valuation on the pension plan completed as at July 1, 2022, indicated the plan was 99 per cent funded on a going-concern basis (98 per cent as at Jan. 2020 valuation) and 105 per cent on a solvency basis (106 per cent as at Jan. 2020 valuation). The going-concern deficit improved mainly due to higher interest rates increasing the discount rate that reduces the present value of the plan liabilities. The actuary sets the expected rates of returns for asset mix based on industry best practices guided by the Canadian Institute of Actuaries. The University has no control or influence over these assumptions used by the actuary. The going concern deficit of $5.3 million ($12.7 million as at Jan. 2020 valuation) includes budgeted special payments into the plan of $0.5 million representing an annual savings of $1.0 million
57: Pension Plan as of June 30 pension year end ($000s)
The University sector has launched a jointly sponsored pension plan (JSPP). The University Pension Plan (UPP) became operational January 1, 2020. The UPP is now open to new entrants and work is underway at Brock to evaluate the UPP and other JSPP options available to determine if our current plan or other alternatives offer a more sustainable pension benefits to our members. Pension cost will continue to rise in the future and grow at a faster pace than the University's operating budget as the costs are tied to salary increases which grow on average faster than the overall budget of the
Figure 56: 2016-17 to 2024-25 NFPS personnel costs ($000s)
Figure
University. Figure 58 from an analysis completed by Mercer (Plan Actuary) shows that over time the size of the pension liabilities grow at a faster rate in comparison to Brock’s operating budget. Work is underway to refresh this analysis as part of the ongoing pension plan review with the plan actuary. Salient to the growth in pension costs is the pension stabilization reserve funding of $1.59 million established from 201718 year-end surplus that remains uncommitted due to the recent improvement in the pension valuation. This reserve is budgeted to remain restricted for future pension stabilization as needed.
Additional information on the pension plan may be found at brocku.ca/about/universityfinancials/#auditedpension-statements
Post-retirement benefits
Brock University’s non-pension post-retirement benefits liability as at April 30, 2023 was $29.7 million. Figure 59 describes the nature of these future obligations.
Brock has traditionally had a pay-as-you-go model to fund immediate requirements. For example, in 2023-24, Brock paid $0.39 million related to BUFA’s health-care spending account, as of Feb. 2024. As time goes on, continuation of this practice would impact Brock’s financial sustainability. This would occur as more people retire and the University becomes obligated to pay these benefits, in addition to the benefits of the replacement employee. The reality is these post-retirement costs are similar to Brock’s pension liability, which is funded while employees earning the benefit perform their employment responsibilities. It is in the interest of Brock and its employees that these post-retirement benefits are funded in a similar manner as the pension liability to ensure these future obligations can also be met and do not become an unfunded burden on future budget plans. For these reasons, starting in 2014-15, $0.9 million was reserved annually to begin setting aside assets for this obligation. As of February 29, 2023, this fund has $7.2 million invested representing $4.5 million invested capital and $2.7 million investment income. While the annual contribution of $0.9 million was removed from the budget in 2019-20 for mitigation and remains excluded in the 2024-25 budget, the reserve will remain invested in the sinking fund. This amount is in addition to the pay-as-you-go funds already in the budget. It is important to note that in the Morningstar DBRS credit rating they noted, “Brock’s decision to begin reserving for non-pension post-employment benefits is viewed as a prudent practice, which will gradually address growth in these obligations over time.” Ontario universities vary on how they fund post-retirement benefits. There are some that have a reserve balance that equals the total liability and others with no reserve.
Figure 59
Figure 58: Operating budget vs. pension liability trajectory ($000s)
Operating costs
Non-personnel operating costs (operating costs), including inter-fund expenses, represent 33 per cent of the total budgeted expenditures of the University (35 per cent in 2023-24). Operating costs decreased $7.8 million over the 2023-24 budget due to budget planning mitigation efforts to address our fiscal deficit. Operating costs have been segregated into nine categories. See Figure 60 for a breakdown by category.
payment to Niagara College for the GAME program; consulting, legal and audit fees; liability and property insurance; internet and mobile phone charges as well as additional food service costs related to hosting the athletes village for the World Rowing Championships event in the summer of 2024.
Utilities and taxes
Budgeted utilities and taxes for 2024-25 are $8.8 million ($8.9 million in 2023-24). Utilities include the cost of heating and cooling, hydro, water, and federal carbon and greenhouse gas costs of $7.32 million ($7.52 million in 2023-24). The majority of the University’s utilities expenses, $6.70 million ($6.91 million in 2023-24), are reported in the Utilities, Taxes and Insurance responsibility centre. Included in this amount is the federal carbon and green house gas tax of $1.03 million ($0.81 million in 2023-24). In addition, utility expenses of $0.62 million ($0.60 million in 2023-24) are directly reported in specific units, the majority of which is reported in Housing Services as well as Heritage Plaza. See Figure 61 for a breakdown of the net utilities costs by type. Utilities and taxes also includes $1.44 million ($1.40 million in 2023-24) related to municipal tax, of which the majority is reported in the Utilities, Taxes and Insurance responsibility centre. See page 30 for further discussion on property taxes and the offsetting Grant in Lieu of Municipal Taxation.
Purchased services
Budgeted purchased services for 2024-25 are $18.4 million ($17.9 million in 2023-24). For the purposes of this report, overall purchased services represent the following types of services: contracted services and professional fees, external information technology and telecommunication services, rental/lease costs, and insurance costs. Specific examples of purchased services in the budget include security services; the lease payments for the temporary Burlington Campus, the
to the First Ontario Performing Arts Centre;
Financial expenditures
Budgeted financial expenditures for 2024-25 are $14.7 million ($13.3 million in 2023-24). The University’s external debt principal payments of $3.53 million ($2.91 million in 2023-24) and interest payments of $10.65 million ($9.89 million in 2023-24) are included
Figure 61: Budgeted utilities by type ($ millions)
Figure 60: Budgeted operating costs ($000s)
as part of financial expenditures. Figure 62 details the breakdown of the debt payments. These financial expenditures are reported in the Financing unit and Ancillary and Housing Services. In 2024-25 Ancillary and Housing Services is contributing $9.41 million ($7.65 million in 2023-24) towards the University debt payments, of which $4.43 million ($4.43 million in 2023-24) is reported directly as debt payments and $4.98 million ($3.22 million in 2023-24) is reported as an interdepartmental chargeback to the Financing unit. Refer to the 'Financing section' on page 81 for a discussion on the University’s debt and financing strategies. Also included as part of financial expenditures are banking charges and payment card fees of $0.49 million ($0.48 million in 2023-24), which are reported in units throughout the University.
Scholarships, bursaries and fellowships
Total budgeted scholarships, fellowships, bursaries and student awards are $21.1 million ($24.8 million in 2023-24). Undergraduate entrance scholarship funding, financial need bursaries and other student awards are budgeted to be $11.87 million ($13.59 million in 2023-24). This decrease is due to lower forecasted enrolment, changes to the Brock Scholars funding and a reduction in the general bursaries’ budget, details of these changes are shown in Figure 63. There were two changes to the Brock Scholars funding built in the budget, one of which was to remove the monetary award for students eligible for tuition waivers. These students will still receive the academic recognition on their transcripts. The second change was to eliminate the funding where students who do not qualify for an entrance Brock Scholars award are eligible for a Brock Scholars returning award in Years 2 through 4 if they maintain an 80 per cent average at Brock. These students will still receive the academic recognition on their transcripts. The Brock Scholars funding (both entrance and renewal awards) included in the budget is $8.5 million as compared to $9.6 million in 2023-24.
Repairs and maintenance and capital replacement
Repairs and maintenance and capital replacement costs of $9.3 million ($9.1 million in 2023-24) include $4.94 million ($4.71 million in 2023-24) of costs related to repairs and maintenance of devices, buildings and grounds and their related supplies. Also included are $4.41 million ($4.36 million in 2023-24) of furniture, equipment and software and licence purchases that are not included in the capital and related project budget. Note: funding of the capital and related project budget is reported as part of inter-fund expenses and not as part of repairs and maintenance and capital replacement costs. Repairs and maintenance and capital replacement costs are reported in Facilities Management, Housing Services, Information Technology Services and other units throughout the University.
Graduate student scholarships and fellowships are budgeted to be $7.74 million ($9.71 million in 2023-24). The decrease in graduate funding was driven by removing fellowship funding for major research project (MRP) students with the objective of increasing the research-intensive thesis-based master's student population. To help offset the cost of attracting these thesis-based master's students who would normally have chosen the MRP-based stream, the budget also includes a reduction in the fellowship amount for new incoming thesis-based master's students, both domestic and international. Additionally, the fellowship for International PhDs is also decreasing to align with the decrease in tuition rates, which is discussed in the Student Fees section of this report. Finally, similar to the change in undergraduate funding, graduate students who receive a tuition waiver or are in final stage status (i.e., pay a nominal fee for tuition) will have their fellowship adjusted so that the sum of the fellowship and tuition waiver does not exceed their total cost of tuition.
Also included in the scholarships, fellowships, bursaries and student awards budget is $1.48 million ($1.48 million in 2023-24) of employee benefit student tuition waivers of which $1.28 million is undergraduate and $0.19 million is graduate.
The majority of these student awards are reported in the Scholarships, Bursaries and Fellowships (SBF) responsibility centre. See page 73 for further discussion on the SBF responsibility centre.
Figure 62: Debt payments
Figure 63: Scholarships, Bursaries and Fellowships
Library acquisitions
The budgeted library acquisitions of $5.8 million in 2024-25 ($5.7 million in 2023-24) represent the funding to purchase critical information resources (ejournals, books, ebooks, geospatial data, music, full-text databases, etc.) and discovery/access/dissemination technologies to support teaching and research.
Cost of sales
Cost of sales of $4.2 million in 2024-25 ($4.6 million in 2023-24) represent the cost of purchasing the items for resale by Ancillary Operations mainly related to the Campus Store.
Inter-fund expense
Budgeted inter-fund expenses for 2024-25 are $20.4 million ($29.9 million in 2023-24). Inter-fund expenses represent transfers from the operating budget to other funds within the University, usually representing internally restricted reserves. The 2024-25 budget includes:
• Funding related to the capital and related project budget of $9.06 million ($12.97 million in 2023-24) as outlined on pages 76 to 79 of this report.
• Transfers of $2.08 million ($2.03 million in 2023-24) from the Faculties, the Library and other units for professional expense reimbursements (PER) and $1.00 million ($1.00 million in 2023-24) from the Research Enterprise to Faculty start-up accounts.
• Transfers of $2.68 million ($2.70 million in 2023-24) from the Scholarships, Bursaries and Fellowships responsibility centre to the endowment fund for scholarships (this is offset by inter-fund revenue from the endowment fund).
• Transfers from the Financing responsibility centre of $1.51 million ($1.49 million in 2023-24) to an internally restricted reserve (sinking fund) to support the Zone expansion project financing. As well as additional
contributions to the sinking fund for the 2020 bond and 2005 bond in the amounts of $0.9 million and $0.4 million, respectively. For more information, refer to the ‘Financing' snapshot section of this report on page 72.
• Transfers of $1.91 million ($1.51 million in 2023-24) from the Research Enterprise to the research with no external obligation fund for funding of several important research initiatives, including VPR Research Excellence programs, Cool Climate Oenology and Viticulture Institute (CCOVI), the Match of Minds program, the Chancellor’s Chair and funding the full launch of the Validating, Manufacturing, and Prototyping Institute (VPMI).
• Transfer of $0.4 million ($0.4 million in 2023-24) from Campus Development and Community agreements to a Canada Games park reserve related to the University's requirement to contribute annually into a capital reserve fund held by the Niagara Region for future capital repairs and improvements.
• 2023-24 included a transfer of $7.0 million from University Global to the strategic initiative funds related to the proceeds from the sale of the Hamilton campus.
Other operating costs
Other operating costs represent all other costs not included in the above eight categories, including internal chargeback expenses, travel costs, marketing and advertising expenses, other materials and supplies, membership dues and subscriptions, hospitality costs, postage and courier charges, professional development and training, practicum payments, printing and duplicating costs, conference fees, bad debt expense, and other costs. Also included in the 2024-25 budget is $1.90 million ($1.95 million in 2023-24) of uncommitted strategic/discretionary funds, representing half of a per cent of the budgeted revenue. This fund will be used in 2024-25 to fund a hiring review program to fill roles of critical importance that were eliminated from the budget for mitigation.
Responsibility budget centre snapshots
Figure 64 and the following snapshots present the budgeted revenue and costs of each of the University’s responsibility centres based on each unit’s responsibility for establishing their respective budgets. The division of responsibility centres is not meant to measure each unit’s total revenue impact or fully loaded costs. As such, revenue shown in the Faculties does not include an allocation of global tuition or operating grant revenue. Revenue shown by the responsibility centre only reflects the tuition, fee and grant revenue specifically budgeted in the respective centres as well as any other revenue generated within each centre.
Total costs, as shown in the responsibility centres, include salaries, benefits and direct non-personnel costs (operating costs). Support service costs have not been allocated in these figures. For example, the majority of utility costs are shown collectively as part of the 'Utilities, Taxes and Insurance' responsibility centre on page 72. As detailed in the 'Revenue and expense allocation model' section of this report, the revenue and expense allocation model has been developed and allocates all budgeted net operating costs of the University, including support service costs for each of the six teaching Faculties. The Provost, working with Financial Services, utilizes this model as a planning tool. Refer to page 84 for a full discussion of this model.
It should also be noted that direct externally funded research revenue and matching expenses are not included in the budget to avoid added administration of developing a budget by researchers for funds that have a net zero impact on the budget. However, we recognize the significance of this activity and note that in 2022-23 $14.0 million was spent on external research. See note 17 of the audited financial statements for more detailed information.
The following snapshots also detail the faculty and staff full-time equivalent (FTE) positions within each unit. The FTE figures represent each evaluated salary position included in the budget (i.e. the salary and benefits related to this position are included in the budget) and represent both filled and unfilled positions. The FTE of a faculty/staff member is calculated based on whether they are full-time, part-time, seasonal, etc. For example, an ongoing part-time position that works 17.5 hours per week would be counted as 0.5 FTE; whereas a full-time position would be counted as one FTE.
During 2023-24, there have been a number of changes to units across the University. Reclassifications were made to the 2023-24 budget as reported in the 2023-24 Budget Report in both budget dollars and FTEs for comparison purposes to the 2024-25 budget when the overall funding budget was not impacted. See Appendix B for details of these adjustments.
Funding budget by responsibility centre
Figure 64 details the funding budget by responsibility centre, which in turn are grouped into one of the following categories: Teaching Faculties, Academic Support, Student Specific, Ancillary, Shared Services, Space and Global.
Figure 64: Funding budget by responsibility centre
(1) Includes the following: the offices of the President; the Provost and Vice-President, Academic; the Vice-President, Research; the Vice-President, Administration; the Vice-President, External; the Vice-Provost and Associate VicePresident, Academic; the Vice-Provost, Teaching and Learning, the Associate Vice-President, Students, the Vice-Provost , Indigenous Engagement, as well as the operating costs of the Board of Trustees and Senate.
Teaching Faculties
Faculty of Applied Health Sciences
Applied Health Sciences supports the priorities of the Institutional Strategic Plan: We deliver and develop high-quality undergraduate, graduate and professional programs, which meet the needs of students and the community; we promote and develop strong basic and applied research foci with outstanding researchers, research partnerships and excellent graduate and undergraduate student research opportunities; our expansive experiential education and practicum opportunities for undergraduate and graduate students along with our extensive network of community partnerships work synergistically to enhance the life and vitality of the Niagara region and beyond; and we prioritize curriculum revision, new program development and student/faculty recruitment and support, which fosters inclusivity, accessibility, reconciliation and decolonization. For more information on the FAHS, visit brocku.ca/applied-health-sciences
Note: Revenue includes $0.19 million ($0.19 million in 2023-24) funding related to Canada Research Chairs. See Figure 65-B for a breakdown of operating expenses by type.
Figure 65-B: 2024-25 Operating costs (%)
(1) Full-time equivalent (FTE) faculty/librarians represents Brock University Faculty Association (BUFA) probationary and tenured faculty and Associate Deans (both filled and unfilled positions). LTA/ILTA represents BUFA limited-term and instructional limited-term faculty appointments. Faculty on sabbatical are represented as one FTE.
(2) FTE – staff represents evaluated salaried staff positions and ongoing CUPE 1295 positions (both filled and unfilled).
(3) See Figure 13 in 'The Big Picture' pullout for explanation of the figures reported.
(4) See Figure 14 in ‘The Big Picture’ pullout for explanation of the figures reported.
*Note: BUFA positions, BUFA overload and Associate Deans.
Figure 65-A
Figure 65-C
Goodman School of Business
The Goodman School of Business develops business leaders who are ready to think critically, adapt to changing business landscapes and look beyond geographic boundaries. The School’s vision is to create meaningful, sustainable impact in the classroom, in our community and through our world-changing research. At Goodman, creating exceptional experiences is the foundation of everything we do. We are committed to providing students and faculty the opportunities needed to succeed. With accreditation from the Association to Advance Collegiate Schools of Business (AACSB), the European Foundation for Management Development (EFMD) and CPA Ontario among others, we ensure that our students will receive a level of excellence in business education that meets rigorous standards. Our supportive and collegial environment ensures that our faculty can pursue their research in ways that informs teaching, forwards the interests of our communities, and propels our school’s reputation. At Goodman, students gain a global perspective through international partnerships and develop leadership and work skills through our many clubs, competitions and co-op and experiential learning opportunities. We provide hands-on experiences, both inside and outside of the classroom that will help them chart their own path to success. Beyond the classroom, we are committed to providing intentional support to local businesses and to supplying offerings that address community needs. For more information, visit brocku.ca/goodman
Note: Revenue includes $0.61 million ($0.45 million in 2023-24) of program revenue related to Goodman’s professional and executive programs as well as consulting revenue. See Figure 66-B for a breakdown of operating expenses by type.
66-B: 2024-25 Operating costs (%)
(1) Full-time equivalent (FTE) faculty/librarians represents Brock University Faculty Association (BUFA) probationary and tenured faculty and Associate Deans (both filled and unfilled positions). LTA/ILTA represents BUFA limited-term and instructional limited-term faculty appointments. Faculty on sabbatical are represented as one FTE.
(2) FTE – staff represents evaluated salaried staff positions and ongoing CUPE 1295 positions (both filled and unfilled).
(3) See Figure 13 in 'The Big Picture' pullout for explanation of the figures reported.
(4) See Figure 14 in ‘The Big Picture’ pullout for explanation of the figures reported.
The Faculty of Education (FOE) is a leader in the delivery of academic programs related to learning and teaching across the lifespan. Our academic programs, scholarship and creative activities, and service, are recognized for their excellence and career orientation. We collaboratively offer Indigenous Education programs to support the educational and professional formation of teachers in remote communities and university education pathways for Indigenous adults in communities across Ontario. Our outstanding accredited Teacher Education programs respond to the needs of Ontario's boards of education including in the much-needed field of technological education. Adult Education and Early Childhood Education (ECE) are Brock leaders as fully online programs, drawing in diverse student populations and professionals to complete a university degree while maintaining employment and family responsibilities. While the Early Childhood Education (ECE) program is a degree completion pathway for ECE educators across Ontario and beyond, our advanced certificates and micro-certificates feature Canadian Culture and Education, Leadership in Community-based Education, literacy, and post-secondary education. Our graduate (MEd, PhD) programs provide rigorous academic and professional education for teachers and school, university, college, community and industry leaders. For more information, visit brocku.ca/education
Note: Revenue includes $0.79 million ($0.81 million in 2023-24) of student fees related to Continuing Teacher Education. In 2023-24 student fees of $0.49 million were included related to Adult Education, for 2024-25 these fees are shown in University Global. See Figure 67-B for a breakdown of operating expenses by type.
Funding of professional expense reimbursement (PER) accounts
Other operating costs
Purchased services
Travel and conference fees
Repair and maintenance and capital replacement
Marketing and advertising
Materials and supplies
(1) Full-time equivalent (FTE) faculty/librarians represents Brock University Faculty Association (BUFA) probationary and tenured faculty and Associate Deans (both filled and unfilled positions). LTA/ILTA represents BUFA limited-term and instructional limited-term faculty appointments. Faculty on sabbatical are represented as one FTE.
(2) FTE – staff represents evaluated salaried staff positions and ongoing CUPE 1295 positions (both filled and unfilled).
(3) See Figure 13 in 'The Big Picture' pullout for explanation of the figures reported.
(4) See Figure 14 in ‘The Big Picture’ pullout for explanation of the figures reported.
(5) Starting in the 2024-25 Budget Report the enrolment figures no longer include Continuing Teacher Education. The prior year figures have been adjusted for comparability.
*Note: BUFA positions, BUFA overload and Associate Deans.
Figure 67-A
Figure 67-C
Figure 67-B: 2024-25 Operating costs (%)
Faculty of Humanities
The world has changed utterly in the past few years, and those changes have been most apparent in their impact on the lives and spirits of individual human beings. That's where the Humanities come in. Our researchers and creative practitioners examine the cultural, historical and intellectual frameworks of the world and the human experience, and have significant impact both locally and internationally. We work on figuring out what really happened or is happening, how we can know and what we can do about it.
We are the very embodiment of the Institutional Strategic Plan: Our students have an experience unparalleled in Ontario universities, both in the classroom and beyond, as they engage with the world and consider how to improve it. We enhance the life of our community through creative performances, exhibits and intellectual events; and we actively pursue inclusion and accessibility through our teaching, research, creative activity and service. Along the way, as well, we help inoculate against “Fake News” and extremism by fostering a respect for rigour and truth in our teaching, scholarship and creative activity. For more information, visit brocku.ca/humanities/
Note: Revenue includes $0.52 million ($0.54 million in 2023-24) of spending allocations from the Marilyn I. Walker School of Fine and Performing Arts Endowment Fund. See Figure 68-B for a breakdown of operating expenses by type.
Figure 68-B: 2024-25 Operating costs
(1) Full-time equivalent (FTE) faculty/librarians represents Brock University Faculty Association (BUFA) probationary and tenured faculty and Associate Deans (both filled and unfilled positions). LTA/ILTA represents BUFA limited-term and instructional limited-term faculty appointments. Faculty on sabbatical are represented as one FTE.
(2) FTE – staff represents evaluated salaried staff positions and ongoing CUPE 1295 positions (both filled and unfilled).
(3) See Figure 13 in 'The Big Picture' pullout for explanation of the figures reported.
(4) See Figure 14 in ‘The Big Picture’ pullout for explanation of the figures reported.
BUFA positions, BUFA overload and Associate Deans.
Figure 68-A
Faculty of Mathematics and Science
The Faculty of Mathematics and Science (FMS) develops and delivers programs (many with a co-op option) and courses to provide knowledge and hands-on experiences that serve as a strong foundation for its students. FMS aligns with the Institutional Strategic Plan in many ways, especially by fostering a culture that focuses on multidisciplinary and transdisciplinary approaches (as seen in Neuroscience, Biotechnology, etc.); being a leader in bringing in funding from a wide range of sources to support research infrastructure and capacity; and having researchers' work in a wide range of areas with local and global impact, from pharmaceutical development to grape and wine innovation. FMS is also home to the Yousef Haj-Ahmad Department of Engineering. Starting fall 2024, Brock will be one of only three universities in Canada to offer Integrated Engineering, an approach to engineering education that addresses emerging needs and challenges in the engineering field. For more information, visit brocku.ca/mathematics-science
Note: Revenue includes $1.72 million ($1.59 million in 2023-24) of funding from strategic funds for Engineering and $0.09 million ($0.09 million in 2023-24) funding related to Canada Research Chairs. See Figure 69-B for a breakdown of operating expenses by type.
(1) Full-time equivalent (FTE) faculty/librarians represents Brock University Faculty Association (BUFA) probationary and tenured faculty and Associate Deans (both filled and unfilled positions). LTA/ILTA represents BUFA limited-term and instructional limited-term faculty appointments. Faculty on sabbatical are represented as one FTE.
(2) FTE – staff represents evaluated salaried staff positions and ongoing CUPE 1295 positions (both filled and unfilled).
(3) See Figure 13 in 'The Big Picture' pullout for explanation of the figures reported.
(4) See Figure 14 in ‘The Big Picture’ pullout for explanation of the figures reported.
Brock's largest Faculty offers an exciting array of undergraduate and graduate programs that use different lenses to examine human behaviour and interaction to address urgent social challenges. The diversity of our subject areas encourages students to explore and develop a variety of interests, understand new perspectives and gain the valuable skills they need to change the world, including critical thinking, research, and the analysis and interpretation of data – all of which are essential to confronting the complex issues that societies face today and in the future. Highlights of our strategic investments that promote institutional priorities include programs and research that have a transdisciplinary focus; programming developed and revised in response to educational and career plans of potential students; and experiential education opportunities that bring together students and members of the Niagara community and beyond to exchange knowledge and build professional capacity for the many careers that stem from fields in the Social Sciences. For more information, visit brocku.ca/social-sciences
Note: Revenue includes $0.39 million ($0.35 million in 2023-24) funding related to Canada Research Chairs. See Figure 70-B for a breakdown of operating expenses by type.
(1) Full-time equivalent (FTE) faculty/librarians represents Brock University Faculty Association (BUFA) probationary and tenured faculty and Associate Deans (both filled and unfilled positions). LTA/ILTA represents BUFA limited-term and instructional limited-term faculty appointments. Faculty on sabbatical are represented as one FTE.
(2) FTE – staff represents evaluated salaried staff positions and ongoing CUPE 1295 positions (both filled and unfilled).
(3) See Figure 13 in 'The Big Picture' pullout for explanation of the figures reported.
(4) See Figure 14 in ‘The Big Picture’ pullout for explanation of the figures reported.
70-D: 2024-25 Budget
Figure 70-C
Figure 70-B: 2024-25 Operating costs (%)
Figure
Academic support
Faculty of Graduate Studies and Postdoctoral Affairs
(1) Full-time equivalent (FTE) faculty/librarians represents Brock University Faculty Association (BUFA) probationary and tenured faculty and Associate Deans (both filled and unfilled positions). LTA/ILTA represents BUFA limited-term and instructional limited-term faculty appointments. Faculty on sabbatical are represented as one FTE.
Brock embraces integrative graduate education as a pathway to independence and a breadth of career options built on a foundation of collegial mentorship, collaboration, transparency and merit. Accordingly, our 52 graduate programs embrace contemporary issues, highlighting and pushing the boundaries of current thought, ongoing progress and future developments across and between disciplines. The Faculty of Graduate Studies and Postdoctoral Affairs (the Faculty) has a critical role in meeting the Institutional Strategic Plan’s goal to build research capacity across the University, thereby positioning Brock as a key comprehensive university for the 21st century.
The Faculty is the centralized administrative and academic entity for the University’s graduate programs and therefore operates across all Faculties and is intimately involved in integrative recruitment and retention efforts for both undergraduate and graduate levels. The Faculty aligns with the Institutional Strategic Plan by ensuring these initiatives encourage inclusivity, accessibility, reconciliation and decolonization.
The Faculty oversees all graduate applications, admissions and registration, ongoing enrolment and records, funding, internal and external graduate scholarships and awards, and graduate student essential skills and professional development programming.
In collaboration with Brock’s Graduate Council and the Senate Graduate Studies Committee, the Faculty ensures the development and enforcement of all relevant rules, regulations and policies concerning graduate studies. In collaboration with the Graduate Students’ Association, the Faculty also advocates for graduate student needs and issues on campus. In alignment with the Institutional Strategic Plan, the Faculty hopes to offer a transformational and accessible academic and university experience to our graduate students and enhance the life and vitality of our local region and beyond. For more information, visit brocku.ca/graduate-studies
Note: Revenue includes $0.40 million ($0.39 million in 2023-24) from the Ontario University Application Centre.
Figure 71
Library
Figure 72
(1) Full-time equivalent (FTE) faculty/librarians represents Brock University Faculty Association (BUFA) probationary and tenured faculty and Associate Deans (both filled and unfilled positions). LTA/ILTA represents BUFA limited-term and instructional limited-term faculty appointments. Faculty on sabbatical are represented as one FTE.
(2) FTE – staff represents evaluated salaried staff positions and ongoing CUPE 1295 positions (both filled and unfilled).
The Brock University Library enriches teaching, learning and research at Brock through collaborative expertise, rich content and inclusive spaces. The Library supports student success by providing the competencies, tools and resources that learners need to excel in a changing environment; advances knowledge by providing access to scholarly information and through active engagement in the research lifecycle; and inspires discovery by fostering creative engagement with technology. The Brock University Library includes the James A. Gibson Library; the Map, Data and GIS Library; the Archives and Special Collections; and the Makerspace in the Rankin Family Pavilion. The Library comprises six departments and a staff of 50, of whom 20 are professional librarians. The Brock Library's strategic plan has four strategic pillars highlighting student success, the research lifecycle, community engagement and strengthening capacity. For more information, visit brocku.ca/library
Note: Operating costs include $5.77 million of library acquisitions ($5.75 million in 2023-24).
Centre for Pedagogical Innovation
Figure 73
(1) FTE – staff represents evaluated salaried staff positions and ongoing CUPE 1295 positions (both filled and unfilled).
The Centre for Pedagogical Innovation (CPI), includes teaching and learning advancement and online learning.
CPI fosters a culture of excellence in teaching and learning across the University through supporting instructional staff and critical digital infrastructure.
CPI brings people together to explore effective teaching and learning practices as well as innovative pedagogies, both in the classroom and online. CPI also assists departments and instructors in the design, development and delivery of courses and programs.
For more information, visit brocku.ca/pedagogical-innovation/
Research Enterprise
Figure 74-A
positions (both filled and unfilled).
The Research Enterprise includes the Office of Research Services (ORS), Animal Care Services (ACS), the Office of Research Ethics (ORE), the Brock LINC innovation and entrepreneurship hub, and funding for transdisciplinary research and activities, including the Cool Climate Oenology and Viticulture Institute (CCOVI) and the newly launched Brock-Niagara Validation, Prototyping and Manufacturing Institute (VPMI). (Note: Costs related to the Office of the VicePresident, Research are included in the Academic and Administrative Offices responsibility centre.)
The Research Enterprise supports Brock’s strategic priority of advancing research capacity across the University. The Research Enterprise units continuously strive to enhance service to researchers and the broader community by identifying opportunities for improving process efficiencies and reducing timelines. The 202425 budget includes measures to improve operations through personnel and software advancements, including a focus on guiding research policies and practices through the lens of equity, diversity and inclusion. The Research Enterprise provides a focal point for funders, industry, community groups and researchers to connect and continue to increase awareness of Brock University as a centre of research excellence.
ORS staff assist researchers in crafting grant proposals and administering contracts and funding. A major portion of the ORS budget is devoted to internal funding for research activities. ORE supports research involving humans and ACS supports research involving animals. The Brock LINC aims to foster a culture of creativity and innovation, grow entrepreneurship, and support research innovation and capacity at the University, including through support for commercialization and intellectual property management. For more information, visit brocku.ca/research-at-brock/
CCOVI is Brock’s long-standing flagship transdisciplinary institute. It defines a place within and beyond the University for research and networking to advance the Canadian grape and wine industry. Faculty, students and staff partner with academic communities, federal and provincial government research organizations, and regional grape and wine industry groups across Canada, as well as cool climate wine regions around the world. For information about CCOVI, visit brocku.ca/ccovi/
VPMI is Brock’s newest flagship transdisciplinary institute. It is a collaborative hub connecting Brock researchers and students with industry partners. It is rooted in a state-of-the-art technology adoption centre in the heart of Niagara’s bioproducts and chemical manufacturing clusters, providing industry with technological solutions and access to highly skilled talent while weaving seamless development and implementation of innovation into the production practices and processes of partner companies. For information about VPMI, visit brocku.ca/vpmi/
Brock continues to support several other transdisciplinary research institutes, including Canada-Caribbean Institute; Lifespan Development Research Institute; Niagara Community Observatory; Posthumanism Research Institute and Social Justice Research Institute. Find out more at brocku.ca/ research-at-brock/institutes-and-centres/
Note: Revenue includes $2.67 million of grant revenue related to the Research Support Fund ($2.50 million in 2023-24).
* The
Figure 74-B: 2024-25 total costs (%)
Professional and Continuing Studies (PCS)
75
PCS supports one of the Institutional Strategic Plan’s goals of “Expanding Brock’s lifelong learning opportunities for our students and members of the community.” This includes non-credit program offerings (courses, workshops, micro-credentials and professional certificates) and custom training for organizations, delivered both in person and online. The non-credit offerings designed by PCS support career progression, skill development and personal growth by providing opportunities to broaden perspectives and enrich life through learning.
$1.7 million of strategic funding to offset the start-up costs of PCS was included in 2023-34 budgeted revenue. Without that funding, the net budgeted deficit for PCS would have been $1.9 million. There was no strategic funding included in the 2024-25 PCS budget. The net budgeted deficit in 2024-25 is only $0.1 million, bringing PCS much closer to being a fully self-sustaining unit. For more information about PCS, visit brocku.ca/ce
English as a Subsequent Language (ESL)
Figure 76
ESL supports the Institutional Strategic Plan and Brock’s goals for internationalization. ESL Services is a path for international students and those with English as an additional language (EAL) to gain essential language skills, which either facilitates their successful participation in Brock’s undergraduate programs or provides a Canadian cultural language immersion for visiting international students. For more information about ESL Services, visit brocku.ca/continuing-education/esl/
Note: Brock invested $1.5 million from the contingency reserve to restart this program in the 2023-24 budget.
Figure
Student specific
Office of the Registrar and Enrolment Services
for maintaining the integrity of the University’s student academic record. For information on the Office of the Registrar, visit brocku.ca/registrar
Note: Revenue includes $1.60 million ($1.50 million in 2023-24) from the Ontario Universities' Application Centre and $0.24 million ($0.25 million in 2023-24) in grant revenue related to the Credit Transfer Institutional Grant. Operating costs include $1.28 million ($1.50 million in 2023-24) of contracted services mainly related to international student recruitment commissions.
77-B: 2024-25 total costs (%)
The Office of the Registrar and Enrolment Services (ORES) supports the Institutional Strategic Plan by providing a wide range of enrolment services that include national and international recruitment, admissions, front-line services (Brock Central), central academic advising, registration, curriculum management support, maintenance and enhancement of the student information system, scheduling of timetables and examinations, grade reporting, academic adjudication and degree audit, student transfers and articulation agreements, and Convocation. It issues official academic documents and is responsible
Figure 77
Student Wellness and Accessibility
The team at the Student Wellness and Accessibility Centre (SWAC) are driven by our mission to provide high quality health care, health education, counselling and accessibility supports to our Brock University students. The SWAC department is comprised of Student Health Services, Health Promotion, Personal Counselling Services and the Student Accessibility Services. SWAC services align with Brock’s Strategic Plan by supporting a transformational and accessible academic and University experience; enhancing the life and vitality of our local region and beyond through community partnerships; and fostering a culture of inclusivity, accessibility, reconciliation and decolonization. Operations are supported through grants from BUSU, GSA and MCU. For more information, visit brocku.ca/health-wellnessaccessibility/
Student Accessibility Services supports students with disabilities (short-term and permanent disabilities) including physical disabilities, invisible disabilities, mental health disabilities and learning and sensory disabilities during their time at the University. Staff work with students to develop individualized academic accommodation plans based on documented disability-related needs. They also provide individualized and group support, such as learning strategies.
Student Health Services offers a diverse range of health-care services. Primary care is available to students at the main campus in two locations –Campus Pharmacy and Harrison Hall – as well as the Marilyn L. Walker School of Fine and Performing Arts. Health care services include physical exams, sexual and reproductive health, first aid for injuries, mental health care, injections, prescriptions, vaccinations and referrals to other health professionals and services.
Personal Counselling Services offers students individual, group and crisis counselling. These services are provided by professional therapists employed by Brock as well as contracted through purchase of service agreements with Telus Health.
The Health Promotion team provides information, programming and outreach for students in important aspects of student life, such as stress management, healthy relationships and physical and mental wellness.
Note: Revenue includes $1.29 million ($1.28 million in 2023-24) of student ancillary fees and $1.10 million ($1.10 million in 2023-24) of grant revenue related to a number of MCU grants, including the Access Fund for Students with Disabilities. Operating costs include $1.21 million ($1.27 million in 2023-24) of professional fees and contracted services, including physicians and counselling services.
Figure 78-A
Figure
Student Life and Success
Figure 79-A
For the purposes of the 2024-25 Budget Report, Student Life and Success (SLS) comprises the Black Student Success Centre (BSSC), Faith and Life, Learning Services, Student Life and SLS Operations, and Student Affairs. Student Life and Success shares responsibility with other campus partners for Brock’s strategic priority to offer a transformational and accessible academic university experience. SLS delivers a broad array of programs and services for all Brock students to support this priority and focus our work on five core actions:
1. Creating opportunities and spaces for student connection and community on and off campus.
2. Connecting to and partnering with our local community so that students can contribute and learn as engaged members of the Niagara region.
3. Engaging students in the learning process in support of academic success.
4. Promoting planning, health and safety for student events and engaging students in co-curricular experiential learning.
5. Holistically supporting students to develop critical competencies and signature strengths to flourish at Brock and prepare for life after graduation.
The Black Student Success Centre advances and celebrates Black, African and Caribbean student achievement and success. The BSSC is a welcoming and safe space for Black undergraduate and graduate students to gather, make connections and access key supports designed to support well-being and academic, personal and professional growth and development. The BSSC demonstrates Brock University's commitment towards Black Inclusion under the Scarborough Charter and supports the recruitment and retention of Black students. While the Black Student Success Centre is a Black-affirming space, it warmly welcomes and includes students from all backgrounds.
The Faith and Life Centre sustains a diverse, multifaith community by encouraging cultural and religious literacy, creating opportunities for community building, and offering space for students to ask questions, seek counselling and grow – all vital elements of the student experience.
Learning Services supports students academically as they transition to and progress through their university life. Workshops and drop-in services are available and strategically positioned throughout the year to align with the pressures, and data-informed needs, that students face. Specialized learning programs such as Boost, Bridging and Stride are fine-tuned to unique student populations to support students in a “just-in-time, justfor-me and just-to-improve” methodology and with a prioritized focus on student persistence and success.
Student Life offers programs and services that impact student retention through offerings that connect students to one another, Brock's campus resources and the broader community. Student Life supports the holistic student experience through engagement in cocurricular learning opportunities, campus involvement, leadership development and mentorship, community volunteering, orientation programming, and off-campus living and neighbourhood relations.
Student Affairs is committed to providing a safe living and learning environment that promotes student success. The Student Affairs team is responsible for overseeing several policies and services, including supporting students-at-risk, administering the Student Code of Conduct and offering mediation services.
For more information, visit brocku.ca/student-life-success
Note: Revenue includes $0.31 million ($0.31 million in 2023-24) of grant revenue related to the Ontario PostSecondary Access and Inclusion Program.
Learning Services, Student Life and SLS Operations
Student A airs, BSSC and Faith and Life Centre
Figure 79-B: 2024-25 total costs (%)
Brock International
Figure 80
Brock International supports the Institutional Strategic Plan through the facilitation of strategic global partnerships and support services for Brock students and scholars.
Brock International Services is responsible for:
• Provision of programs, activities and services that support student well-being, success, career transition, settlement and immigration that are specifically tailored to the needs of the international student community.
• Developing partnerships and agreements that increase Brock’s global reach and engagement.
• Increasing access to global learning opportunities for students and scholars through exchange, mobility programs and international co-operation.
• Fostering a culture of inclusivity and community engagement.
For more information on Brock International Student Services, visit brocku.ca/international/
Hadiyaˀdagénhahs First Nations, Métis and Inuit Student Centre
(1) FTE – staff represents evaluated salaried staff positions and ongoing CUPE 1295 positions (both filled and unfilled).
The Hadiyaˀdagénhahs First Nations, Métis, and Inuit Student Centre (the Centre) is a space for all students to feel welcome. The Centre aids in cultural, social and academic supports and is committed to maintaining and enhancing Indigenous students' cultural identity in an academic setting. The Centre's team, and many community partners, work collaboratively to ease the transition to university by providing a safe and supportive environment throughout the learning journey. For more information visit brocku.ca/hadiyadagenhahs
Note: Revenue includes $0.34 million ($0.34 million in 2023-24) of grant revenue related to the Indigenous Student Success Fund and $0.24 million ($0.24 million in 2023-24) of student ancillary fees.
Co-op, Career and Experiential Education
Figure 82-A
(1) FTE – staff represents evaluated salaried staff positions and ongoing CUPE 1295 positions (both filled and unfilled).
Co-op, Career and Experiential Education (CCEE) supports the Institutional Strategic Plan, Brock Academic Plan and Strategic Mandate Agreement with the Ontario government. CCEE is the overarching department for student and new graduate employment, experiential education and career development and prepares job-ready undergraduate and graduate students for today’s diverse and everchanging labour market. The department consists of the following areas: Co-operative Education, Career Education (Campus and Goodman Career Education), Experiential Education and the Gerald. B. Mitchell Centre of Excellence in Career and Experiential Education. This dedicated team of human resource, career development and experiential education professionals work with students, employers, faculty, community members and industry leaders to achieve operational and strategic goals that advance the mission of the University. For more information, visit brocku.ca/ccee
Co-operative Education offers a valuable opportunity for students to enhance their education by acquiring career-related work experience before graduation. Undergraduate and graduate students gain practical experience, develop a network of contacts and obtain a better understanding of careers in their field.
Career Education offers career exploration and development information and resources to support students and alumni. In addition, Career Education provides employers and community members with information and services about on-campus recruiting and talent brand opportunities. Included in the Career Education unit is also Goodman Career Education.
Experiential Education promotes faculty, staff, students and community partners working together to provide opportunities for students to apply their classroom learning through hands-on experience. Undergraduate and graduate students reflect on their experiences to build skills, realize competencies, contribute to the community, prepare for their careers and build beneficial connections. Experiential opportunities include internships, placements, field courses, service learning, labs and more, and are available in every Faculty at Brock.
The Gerald B. Mitchell Centre of Excellence in Career and Experiential Education is a dynamic hub that supports students, employers, community partners and faculty with a specific focus on the future of work. Through research and evidence informed practices grounded in career development and experiential learning theory, the centre establishes and measures career competencies and skills-translation, and develops career curriculum and innovative practices to support undergraduate and graduate students in workintegrated learning programs. The Centre guides career education supports and resources for equity-deserving student groups, staff and employers actively seeking to hire students and new graduates.
Note: Revenue includes $1.71 million ($2.02 million in 2023-24) of co-op student fees. In addition, undergraduate co-operative education students pay tuition (applicable half-credit fee for each work term). However, like the Faculties, the revenue shown in the units does not include the allocation of Global tuition. Also included in revenue is $0.12 million ($0.12 million in 2023-24) of endowment fund from the Dr. Gerald B. Mitchell endowment fund.
Co-op Education
Career Education (Campus and Goodman Career)
Experiential Education
Centre of Excellence
Co-op, Career and Experiential Education – Administration
CCEE Marketing and Events
Brock Sports and Recreation
Figure 83-A
Brock Sports takes a leadership role and engages the community through sporting events and activities, tournaments, community partnerships, and the Badgers Sports Camp programs. Badgers men’s and women’s teams provide more than 700 students with the opportunity to participate in Ontario University Athletics (OUA) and U SPORTS competitions. Brock Sports also runs the Brock Sports Performance Centre and the Brock Sports Medicine Clinic. For more information, visit gobadgers.ca
Brock Recreation provides programming for students including a wide variety of intramural activities, group and individual fitness programs, aquatics, open recreation opportunities, club sport programs for students and community, certification courses and leadership courses. The department also provides community-based programming, including all levels of aquatic programs (learn to swim through competitive club swimming and lifeguard training), camps and
programming for children and youth, school-based programs, and community adult memberships for aquatics and fitness. Brock Recreation is committed to providing an inclusive, accessible and respectful experience for all of its program participants, staff and volunteers while providing employment for more than 500 Brock university students. For information on programming, visit brocku.ca/recreation
Note: Revenue includes $3.89 million ($3.76 million in 2023-24) of student ancillary fees and $5.23 million ($4.04 million in 2023-24) of sales and services revenue, including program/activity and instructional fees related to school-based programs, Youth University camps, aquatics programs, other youth and community-based programming and intramurals, Badgers men’s and women’s teams, and Badgers Sports Camp programs. Operating costs include $0.44 million related to rental/ lease costs ($0.31 in 2023-24), including rental costs for using Canada Games Park.
Brock Sports Brock Recreation
Figure 83-B: 2024-25 total costs (%)
Ancillary
Ancillary Services
Ancillary Services is comprised of Housing Services, Dining Services and Brock Card, Campus Store, Parking Services and Conference Services. Campus Development and Community Agreements, as well as Printing and Digital Services (described on pages 71 and 66 of this report), are also managed as part of Ancillary Services.
Ancillary Services aligns with the University strategic plan by offering a transformational and accessible academic and university experience. Its mission is to provide outstanding services that benefit the University community, with a vision of enhancing the University through engaged experiences. The four areas of focus are University customer experience, university contribution, quality products and services and people and partnerships.
The 2022-23 Fiscal Framework Update provided guidance for Ancillary operations to grow their surplus contribution to the University budget by four per cent each year, to provide a contribution to the capital and related project budget, including funding deferred capital renewal and maintenance (DCRM) reserve, and to fund any existing and additional debt cost associated with Ancillary and Housing Services operations. The budgeted Ancillary contribution for 2024-25 is $7.7 million, representing an increase of 17 per cent over the 2023-24 budget. This budgeted contribution is $0.8 million higher than set out the Fiscal Framework as it includes a one-time incremental contribution from hosting World Rowing's Athletes Village in 2024-25. Ancillary Services' budgeted capital contribution for 2024-25 is $4.1 million which is consistent with the contribution set out in the Fiscal Framework; however, the allocation to a residence reserve is not included in the budget due to the current fiscal challenges in an effort to fund immediate DCRM needs. This budget also includes funding of the debt payments of $9.41 million ($7.65 million in 2023-24), which is consistent with the Fiscal Framework. There remains risk to Ancillary Services capacity to achieve their growth targets with declining enrolment impacting the volume of on-campus activity.
Campus Store
The Campus Store is the primary retailer at Brock University and manages the retail environment on campus. It offers everything from course materials to your favourite Brock or Badger sweatshirt. The Campus Store is committed to leveraging the purchasing power of Brock to ensure it is providing affordable options that meet the needs and expectations of its customers. For more information, visit campusstore.brocku.ca
Note: Operating costs include $4.17 million ($4.56 million in 2023-24) of cost of sales.
Conference Services
With an experienced team of conference co-ordinators, and facilities for every occasion, Brock Conference Services delivers exceptional experiences one event at a time. Focused on the customer experience, conference co-ordinators work with internal and external clients, making Brock University the ideal place to facilitate local, national and international conferences. For more information, visit brocku.ca/conference-services/
Note: Conference Services’ revenue includes $2.2 million related to the World Rowing Championships athletes village in 2024-25.
Parking Services
As the first touchpoint for many campus guests, Parking Services issues permits, manages parking pay systems, facilitates special event parking, carries out parking lot enforcement and reviews ticket appeals on campus. Committed to excellent customer service, Parking Services works with partners across campus as well as local transit providers to ensure a positive, safe and accessible experience for all customers travelling to campus. For more information, visit brocku.ca/parking-services/
Dining Services and Brock Card
Valuing healthy, high-quality and convenient food options to fuel the mind, as well as accommodating special dietary needs, Dining Services operates eight locations on campus as well as catering and vending. Dining Services also manages all food and beverage contracts with external vendors and brings new brands to campus to meet the needs of today's students. Dining Services is committed to providing seamless and comprehensive services and choices while supporting a healthy and sustainable university environment.
The Brock Card is the official identification (ID) card for students, faculty and staff at the University. The Brock Card functions primarily as Brock ID and as a payment card on campus and with community partners. The Brock Card also serves as a campus recreation centre membership card, a transit card (when affixed with a current bus pass sticker), a meal plan card, and a Residence key card as well as to control access to specific areas/buildings on campus.
more information, visit brocku.ca/dining-services/ Figure 84
Housing Services
Brock University is home to nearly 2,800 students during the academic year. There are eight on-campus buildings that offer traditional, townhouse and semisuite housing options. Completion of the newest building, Residence 8, saw the first full cohort of 308 students move in during January 2022.
Based on expected enrolment targets, Residences includes a budget of 97 per cent occupancy for 2024-25. Business development in areas of overnight accommodations and strategic on-campus partnerships, as well as future improvements to enrolment are projected to improve occupancy to 98.5 per cent occupancy in future years.
For more information, visit brocku.ca/housing
Note: Revenue includes $26.56 million ($24.92 million in 2023-24) of housing services fees. Operating costs include $1.82 million ($1.75 million in 2023-24) of housing services annual lease payments; $0.59 million ($0.57 million in 2023-24) of direct utility costs and $1.58 million ($1.71 million in 2023-24) of utility costs charged back to Housing Services; $4.43 million ($4.43 million in 2023-24) of debt payments; and $1.57 million ($1.43 million in 2023-24) of repairs and maintenance and capital replacement costs. Village Residence
85-B: 2024-25 total revenue (%)
Residence
Residence
Figure 85-A
Figure
Shared services
Academic and Administrative Offices
Figure 86
As the University moves forward with the Institutional Strategic Plan, the University’s leadership is taking an active role in advancing the strategic priorities as set out in this plan.
Academic and Administrative Offices, as defined in the 2024-25 budget report, represents a number of the offices of senior administration as well as the operating costs of the Board of Trustees and Senate. The senior administrative offices included are: the President; the Vice-President, Administration; the Provost and VicePresident, Academic; the Vice-President, Research; the Vice-President, External; the Vice-Provost and Associate Vice-President, Academic; the Associate Vice-President, Students; the Vice-Provost, Indigenous Engagement; and the Vice-Provost, Teaching and Learning.
Information Technology Services
87-A
Information Technology Services (ITS) is a trusted partner in the University’s teaching, learning, research and administrative initiatives and in the broader Niagara community. Our mission is to foster collaboration and trust, develop and enhance a reliable technology-rich environment, provide secure and accessible systems, and continue promoting a service-oriented culture within ITS to support the Brock community. ITS is comprised of five teams: Infrastructure Technology, Client Services, Enterprise Transformation Office, Information Security and Enterprise Solutions.
For more information on ITS, visit brocku.ca/ information-technology
Note: Revenue includes $0.40 million ($0.40 million in 2023-24) of internal chargeback revenue related to the Residence Technology Fee. Operating costs include $1.27 million ($1.11 million in 2023-24) of repairs and maintenance and capital replacement costs.
87-B: 2024-25 total costs (%)
Figure
Figure
Financial Services
Office of People and Culture
Financial Services is responsible for the efficient control, budgetary guidance and analytics of the financial activities of the University through development of the Fiscal Framework documents in support of the Institutional Strategic Plan. Financial Services also has shared responsibility for various operating units. Procurement Services, the Student Accounts and Financial Aid (SAFA) office, and Central Receiving and Mail Services are also part of Financial Services. For more information on Financial Services, visit brocku.ca/finance
– staff (1)
(1) FTE – staff represents evaluated salaried staff positions and ongoing CUPE 1295 positions (both filled and unfilled).
The Office of People and Culture (P&C) develops strategy and creates and administers programs, policies and procedures to effectively manage the employee life cycle in the support of a sustainable, high-performing organization.
Through the P&C’s main portfolios of 1) Managerial Advising and Talent Acquisition; 2) Labour and Employment Relations; 3) People Service, Systems and Analytics; 4) Organizational Design and Effectiveness; 5) Health, Safety and Wellness and; 6) Total Rewards and Payroll (including Compensation, Benefits, Pension and Payroll), the P&C team focuses on attracting, retaining and developing the key talent needed to execute against the institution’s four strategic priorities. This office is immediately focused on advancing our equity, diversity and inclusion (EDI) efforts through the development of Brock’s first Equity Census and an Employee EDI Strategy. We are continuing to advance our people strategy, weaving flexibility and innovation into our hybrid work practices, enhancing our learning and development programs, among several other initiatives. As well, P&C continues to play an important role in creating and supporting a safe, welcoming and effective organizational culture. To learn more about the Office of People & Culture and how they support faculty and staff, visit brocku.ca/human-resources/
Figure 88-A
Figure 89
University Marketing and Communications
Figure 90-A
University Marketing and Communications (UMC) provides the strategic direction for Brock University’s brand, marketing and communications efforts. As stewards of Brock’s brand and reputation, UMC tells the Brock story to the University’s many and varied audiences, including students, prospective students, staff and faculty, the community, industry, and the government. UMC’s key responsibilities include brand management, integrated marketing and communications, media relations and public affairs, social media, web and digital content development, and community engagement. For information, visit brocku.ca/marketing-communications
Development and Alumni Relations
Figure 91-A
The departments of Development and Donor Relations and Alumni Relations align with the Institutional Strategic Plan by raising funds for strategic priorities, including funding for the transformational student experience and enhancing research, as well as cultivating outstanding relationships with our alumni.
Development and Donor Relations is responsible for Brock’s philanthropic activity by working with donors who provide support for University priorities, including capital projects, teaching and learning, technology and student support. For more information, visit brocku.ca/development
Alumni Relations is responsible for alumni engagement, maintaining records to stay in touch with Brock’s more than 100,000 alumni, as well as with the volunteer Brock University Alumni Association Board of Directors. For more information, visit brocku.ca/alumni
Figure 91-B: 2024-25 total costs (%)
Printing Services
University Secretariat
Printing Services has been managed through Ancillary Services since May 2023 and provides both internal printing and the management of the fleet of multifunction copiers across campus. This area provides a wide range of print materials to meet academic, administrative and student print requirements. For information, visit brocku.ca/printing
Note: Revenue includes $0.76 million ($0.81 million in 2023-24) of internal charges to other departments.
The University Secretariat supports the Institutional Strategic Plan by working to ensure the University’s two governing bodies (Board of Trustees and Senate) and their committees operate effectively and efficiently by providing governance expertise, research and analysis, and general support. The Secretariat has accountability for the University's policy framework and processes.
For more information on the University Secretariat, visit brocku.ca/university-secretariat
Figure 92
Figure 93
Human Rights and Equity Services
Institutional Planning, Analysis and Performance
Human Rights and Equity Services supports the Institutional Strategic plan as a resource for all members of the Brock community, providing information, education and complaint resolution related to harassment, discrimination, sexual violence, accessibility and bullying. For more information on Human Rights and Equity, visit brocku.ca/human-rights
Note: Revenue includes $0.54 million ($0.50 million in 2023-24) of student ancillary fees. Operating Expenses include $0.15 million ($0.13 million in 2023-24) of contracted and professional fees.
Institutional Planning, Analysis and Performance (IPAP) strives to be recognized as a leader in higher education for developing innovative analytics, informing data-driven decision-making and having an unparalleled culture of data governance and accountability. Through the collection, evaluation, and organization of enrolment, survey and other institutional data, we translate campus data into useful information for the government, the Brock community and the general public. IPAP also provides analytics to support Brock's leaders in their pursuit of improving institutional effectiveness and overall student success. For more information, please visit brocku.ca/institutional-analysis
Figure 94
Figure 95
Brock University welcomed the community to campus April 8 2024, to experience a variety of educational exhibits and activities, in addition to witnessing the total solar eclipse on Alumni Field.
Office of Government and Community Relations
Figure 96
The Office of Government and Community Relations builds relationships at all levels of government and with valued community partners to advance Brock University's strategic priorities and to raise awareness about the University's unique areas of strength by:
• Monitoring and providing advice on public policy and programs.
• Developing, building and broadening relationships with elected representatives, non-elected officials and community partners.
• Supporting Brock’s government advocacy
• Acting as a liaison and central point of contact
• Co-ordinating strategic communications and engagement.
• Facilitating government and community partner visits to Brock’s campus.
• Engaging with sector associations, including Universities Canada and the Council of Ontario Universities (COU).
• Matching community needs with University expertise to build community capacity.
• Partnering with community partners across the Niagara region and beyond to help solve problems, generate research solutions and co-create knowledge.
For more information on the Office of Government and Community Relations, visit brocku.ca/government-relations
Internal Audit and University Risk Management Legal Services
98
Internal Audit independently assesses the strength of the University’s risk-management and control processes. We support the achievement of the University’s guiding value of ensuring sustainable, accountable and transparent stewardship of public and private resources through traditional risk and controlbased reviews, assurance and compliance audits, project oversight and support, and investigations. University Risk Management, which includes the management of Brock’s insurance portfolio, supports the management of risks through a framework that identifies, assesses, monitors and reports on the status of the University’s principal risks. For more information, visit brocku.ca/internal-audit
The University’s Legal Services unit provides legal advice and support to the University to advance the mission and strategic priorities of the University while mitigating legal risks and promoting compliance with all legal and regulatory requirements. As part of this mandate, the Legal Services unit includes investigations services, managing and conducting investigations into allegations of harassment and discrimination. The Legal Services unit also oversees the administration of the University’s Freedom of Information and Protection of Privacy Act responsibilities and manages the University’s records management program. For more information, visit brocku.ca/legal/
Figure 97
Figure
Space
Facilities Management
Figure 99
Facilities Management supports the Institutional Strategic Plan by providing an exceptionally clean, safe, accessible and well-maintained physical environment for the University community by planning and developing services that are sustainable and supportive of academic excellence, including the sustainable operation of our District Energy System; facility maintenance; ground maintenance; capital planning,
design and construction; project management; code and bylaw compliance; and cleaning and nonhazardous waste management. For more information, visit brocku.ca/facilities-management
Note: Revenue includes $0.78 million ($0.57 million in 2023-24) of revenue related to internal charges to other departments within the University, mainly salary chargebacks. Operating costs include $2.16 million ($2.15 million in 2023-24) of repairs and maintenance and capital replacement costs and $1.20 million ($1.43 million in 2023-24) of contracted services and professional fees, including maintenance, custodial and grounds contracted services. Utilities costs are not included in the Facilities Management budget and are reported as part of the 'Utilities, Taxes and Insurance' responsibility centre on page 72.
In addition to the budget reported in the Facilities Management responsibility centre, Facilities Management capital projects are budgeted in the Capital responsibility centre. Details of these expenditures can be found starting on page 76.
Campus Safety Services
Figure 100
(1) FTE – staff represents evaluated salaried staff positions and ongoing CUPE 1295 positions (both filled and unfilled).
Campus Safety Services is a dedicated team of experienced and skilled professionals who ensure the safety and security of the Brock Community along with all of its campuses and properties. We align our goals and objectives with the Institutional Strategic Plan to ensure the campus experience is engaging and meets the needs of our students, faculty, staff and visitors. We provide individual personal safety planning, threat assessments, teaching and learning opportunities, mentorship, and support to meet the needs of the entire Brock community. Campus Safety is closely connected and in partnership with all external emergency responders to our campus in order to train and respond together for emergency preparedness and awareness. Campus Safety Services continues to work closely with all emergency responders and the Niagara Region Public Health unit. For more information on our services, videos and safety applications, visit brocku.ca/campus-security
Note: Operating costs include $0.96 million ($0.95 million in 2023-24) of contracted security services.
Campus Development and Community Agreements
Figure 101
FTE – staff (1) 0.2 0.2
(1) FTE – staff represents evaluated salaried staff positions and ongoing CUPE 1295 positions (both filled and unfilled)
Campus Development includes the rental revenue and related expenses for Heritage Plaza, which houses McDonald's, Tim Hortons, The Campus Pharmacy and Medical Clinic, and other retailers. Community Agreements include payments for community events, the First Ontario Performing Arts Centre, and a transfer to BUSU for transit funding. Also part of this portfolio is budget related to the proportionate consolidation and other expenses for Canada Games Park in which Brock University is one-quarter owner and one-third operator.
Utilities, Taxes and Insurance Financing
Figure 102-A
103
The Utilities, Taxes and Insurance responsibility centre includes all centrally billed utility costs of $6.70 million ($6.91 million in 2023-24), including $1.03 million ($0.81 million in 2023-24) of federal carbon taxes.
This represents the majority of the University's total utility costs of $7.32 million ($7.52 million in 2023-24).
See Figure 61 on page 37 for details of utility costs. The remaining utility costs are billed directly to operating units. As detailed in Figure 102-B, offsetting these utility costs are chargebacks to Housing Services and external units to the University.
As further detailed in Figure 102-B, included in operating costs are municipal taxes (payment in lieu of property taxes), offset by the Grant in Lieu of Municipal Taxes. For more details, see page 30. The remaining operating costs are made up of repairs and maintenance and capital replacement costs, the majority of which are related to the University's central utilities building, insurance costs, contracted services and professional fees, and other operating costs.
The Financing responsibility centre includes the portion of the principal and interest payments of the University’s external debt which is not included in Housing Services or in Ancillary Services. The budget includes principal payments of $2.07 million ($1.55 million in 2023-24) related to debt for 3401 Schmon Parkway as well as for the loan budgeted to be renewed at $25 million (increase from $14.4 million) to fund capital for engineering and research related projects such as the Clean Agriculture for Sustainable Production (CASP) field infrastructure project. Interest of $7.68 million ($6.81 million in 2023-24) related to the debt for the 2045 $93-million debenture (2005 bond), the 2060 $125-million debenture (2020 bond), 3401 Schmon Parkway and the budgeted renewed loan were included in the budget. Also included in this responsibility centre are additional contributions to the sinking fund for the 2020 bond and 2005 bond in the amounts of $0.9 million and $0.4 million respectively ($0 in 2023-24).
For details on all interest and principal payments included in the budget, see Figure 62 on page 38. For a breakdown of the debt and more information on Brock’s financing strategies and all debt outstanding, see page 83.
The revenue in the Financing responsibility centre in the 2024-25 budget represents the Zone expansion student ancillary fee of $1.51 million ($1.49 million in 2023-24), which is being transferred to an internally restricted reserve (sinking fund) as part of inter-fund expenses to support the repayment of the Zone Expansion financing. Also included is a transfer from Ancillary and Housing Services to fund $4.98 million ($3.22 million in 2023-24) of the University debt payments.
Figure
Scholarships, Bursaries and Fellowships
The Scholarships, Bursaries and Fellowships budget supports the Institutional Strategic Plan by helping and supporting students in attending the University. This unit represents the majority of Brock’s undergraduate and graduate scholarships, bursaries and fellowships (SBFs). Of the total SBFs reported in this unit, $14.98 million ($16.70 million in 2023-24) relates to support for undergraduate students and $8.53 million ($10.51 million in 2023-24) relates to support for graduate students, including endowment-allocated scholarships and student awards. The decrease in this budget is in response to Brock's fiscal situation driven from high rates of inflation on personnel and other expenses outside of Brock's control coupled with limited flexibility on revenue due to government policies.
Undergraduate
The undergraduate SBFs can be split into four main types: University-funded, those funded by government grants, student tuition waivers and those funded by endowments.
Total budgeted undergraduate University-funded SBFs of $11.42 million ($13.18 million in 2023-24) are either merit-based or need-based.
• Merit-based awards are budgeted to be $9.98 million ($11.33 million in 2023-24). Merit-based awards include Brock Entrance Scholars Awards of $2.94 million ($3.12 million in 2023-24) and renewals of those scholarships of $5.56 million ($6.49 million in 2023-24) as well as a number of other awards, including the International Student Ambassador Award, the Niagara Principal’s Scholarship, Athletic Excellence Awards, etc.
• Need-based awards are budgeted to be $1.43 million ($1.85 million in 2023-24). These include funding related to the MCU requirements of the Student Access Guarantee (SAG), which requires all colleges and universities that receive public funding
to provide enough financial aid to cover a student’s assessed needs for expenses directly related to his or her program that are not fully met by OSAP. Also included in need-based awards is Brock’s bursary assistance of $0.40 million ($0.90 million in 2023-24) as well several other specialty awards, including the Student International Mobility Awards, Emergency Bursaries, etc.
• Undergraduate student tuition waivers for Brock faculty and staff and their dependents are budgeted to be $1.28 million ($1.28 million in 2023-24).
Total grant-funded undergraduate SBFs for 2024-25 are budgeted to be $0.21 million ($0.14 million in 2023-24), which are directly offset with grant revenue.
The funding budget includes the endowmentallocated spend related to scholarships and student awards. The undergraduate portion for 2023-24 is $2.08 million ($2.09 million in 2023-24). This support is shown in the budget as an inter-fund expense, with an offsetting inter-fund revenue of the same amount.
The following chart details the proportion of the total undergraduate SBFs (in this unit) by type.
Figure 104-A
Brock Scholars and renewals
Figure 104-B: 2024-25 undergraudate scholarships, bursaries and student awards (%)
Graduate
The majority of graduate SBFs are in the form of University-funded fellowships of $5.53 million ($7.51 million in 2023-24). Other graduate SBFs of $1.17 million ($1.02 million in 2023-24) include University-funded entrance scholarships and awards for excellence, research awards and bursaries. In addition, there are scholarships funded two-thirds by the MCU in the amount of $1.02 million ($1.02 million in 2023-24) with an offsetting grant revenue of $0.68 million ($0.68 million in 2023-24).
Also included in graduate SBFs are student tuition waivers for Brock faculty and their dependents and Brock staff, which are budgeted to be $0.19 million ($0.19 million in 2023-24).
As previously mentioned, the funding budget includes the endowment-allocated spend related to scholarships and student awards. The graduate portion for 2024-25 is $0.61 million ($0.62 million in 2023-24). This support is shown in the budget as an inter-fund expense with an offsetting inter-fund revenue of the same amount.
Capital
The Capital responsibility centre represents the total funding of both the Facilities Management projects of $4.20 million ($8.21 million in 2023-24) and the Information Technology Services projects of $4.86 million ($4.77 million in 2023-24) in the capital and related project budget. Offsetting these costs is the contribution from Ancillary and Housing Services to the capital and related project budget of $4.06 million ($4.04 million in 2023-24). Also included in revenue is Facilities Renewal Program Funds of $3.58 million ($3.85 million in 2023-24) with the balance of the capital and related project budget of $1.42 funded from other global operating revenue. See page 31 for a discussion of these funds. See pages 77 to 81 for details of the capital and related project budget.
University Global
University Global represents those costs and revenue that are University-wide and are not budgeted for by any Faculty or department, including the majority of student tuition, MCU operating grants and anticipated salary increases that haven’t yet been awarded. University Global also includes $1.90 million, representing 0.5 per cent of overall revenue ($1.95 million in 2023-24), of unallocated funding to support the Institutional Strategic Plan. These funds will be distributed to Faculties or departments throughout 2024-25 for identified strategic position replacements. Full details of the University Global costs and revenue are described below.
Revenue for University Global includes the following:
• Tuition of $174.57 million ($180.05 million in 2023-24) as detailed in Figure 41 on page 24.
• Grant revenue of $94.96 million ($94.76 million in 2023-24) as follows:
– Core operating grant of $34.48 million ($41.44 million in 2023-24) – see page 29.
– Differentiation envelope of $55.87 million ($48.42 million in 2023-24) – see page 28.
– Nursing grant of $6.03 million ($6.19 million in 2023-24) – see page 31.
– Niagara Region Brock LINC grant of $0.20 million ($0.50 million in 2023-24) – see page 31.
– An offset to grant revenue of $1.61 million ($1.79 million in 2023-24) due to International Student Recovery Fee – see page 30.
• International Student Recovery Fee of $1.61 million ($1.79 million in 2023-24), which offsets the reduction mentioned above in grant revenue – see page 28.
• Interest on short-term investments of $2.20 million ($2.20 million in 2023-24) – see page 33.
• Other revenue of $4.25 million ($2.88 million in 2023-24) which includes student interest income and an estimate of unclaimed student credit balances.
• Included in the 2023-24 budget was asset sale revenue in the amount of $6.87 million, as well as $0.13 million of imputed interest, related to the sale of the Hamilton campus. This $7.0 million was offset by an allocation of $7.0 million to the strategic fund to be used to support strategic priorities including the new Burlington campus.
• Also included in the 2023-24 budget was inter-fund revenue from contingency reserve of $1.50 million to support the English as a Subsequent Language (ESL) program.
Personnel costs for University Global includes $2.43 million ($6.42 million in 2023-24) related to salary and wage increases that are anticipated but not yet awarded or negotiated. Note: The salary and wage increases that were anticipated but not yet awarded or negotiated included in the Global responsibility unit in the 2023-24 Budget Report have since been allocated to the respective units and are therefore reported as such in this Budget Report. See Appendix B for further details. University Global also includes other personnel costs not allocated to any department of $0.92 million ($0.40 million in 2023-24). Offsetting these costs are budgeted savings from voluntary vacation buy back of $0.14 million ($0.18 million in 2023-24).
Operating costs for University Global include the following:
• Strategic funding to support the Institutional Strategic Plan in the amount of $1.90 million ($1.95 million in 2023-24), representing half a percent of budgeted revenue.
• Other operating costs of $3.72 million ($2.19 million in 2023-24), which includes University memberships, allowances for uncollectable funds, payment to Niagara College related to its share of the GAME program and other University-wide expense items.
• In the 2023-24 budget is funding of $7.0 million to the strategic fund related to the sale of the Hamilton campus.
Figure 106
Capital and related projects budget
Background
The capital and related project budget was presented to the Board of Trustees for approval at the meeting on May 2, 2024, after input gathering from across the Brock community. This timing represents a delay in the normal approval process where the capital and related project budget is usually approved in December. Approving the capital and related projects budget in late November or early December allows Facilities Management and Information Technology Services time to start planning the projects so, where possible, they can be accomplished in the spring and summer when the campus is less busy, as well as to ensure there is sufficient time to obtain competitive pricing.
The delay for this year was as a result of recognizing the need for further review of the capital and related project budget given the significant budget challenges facing the University. As such, it was decided to instead present this capital and related project budget to the Board for approval as part of the full operating budget. At this time, it is expected that the timing delay this year will not have a significant impact on the team’s ability to complete the projects during 2024-25 due to the reduced scope of the project plan.
The process to develop this capital and related project budget began in the summer of 2023, when Facilities Management and Information Technology Services first published proposed projects and sought input. Further discussions were held at committee levels, including the Senate Information Technology and Infrastructure Committee and the Senate Planning, Priorities and Budget Advisory Committee.
Information and updates on the 2023-24 capital and related projects can be found in the 2023-24 trimester reporting at brocku.ca/about/university-financials. A key feature of this capital and related project planning is that any unspent funds of the 2023-24 capital and related projects budget will be reserved at April 30, 2024, and be moved into fiscal 2024-25 so the projects can be completed.
Capital and related projects overview
The 2024-25 capital and related projects budget (capital plan) is $9.06 million (Information Technology Services Projects – $4.86 million; Facilities Management Projects – $4.20 million). The specific projects are detailed in Figures 109 and 110.
As shown in Figure 107, the funding of the capital plan is made up as follows: $5.48 million is funded by the operating budget, both ancillary ($4.06 million) and other global revenue contributions ($1.42 million), and $3.58 million is funded from Facilities Renewal.
Ancillary Contribution –$4.062 million
Facilities Renewal Program –$3.579 million
Other global revenue contributions – $1.417
It is important to note that the 2022-23 Fiscal Framework set out targeted capital plan funding of $14.85 million for 2024-25. Due to the current financial environment, $5.79 million of funding from global revenue sources for the capital plan was removed from the 2024-25 capital and related projects budget.
The 2024-25 capital and related projects budget identifies key areas of investment, including the District Energy Water Supply replacement ($2.57 million), the funding of which was previously approved by the Board of Trustees on May 4, 2023, core subscription and strategic student solutions ($2.12 million), Identity Access Management and Security Operations center ($1.0 million), Learning Management System ($0.57 million), and road repairs and maintenance ($0.50 million). The capital plan includes $4.07 million in deferred capital renewal and maintenance (DCRM) spending.
The primary driver informing much of the Facilities Management campus planning regarding DCRM has been the condition assessment currently performed by SLAM Technologies Inc, through the Council of Ontario Universities (COU), which maintains a common
Figure 104: Capital Budget funding source (%)
Figure 107: Capital Budget funding source (%)
reporting tool to track facilities conditions across Ontario universities for DCRM reporting. In 2019-2020, Ontario universities conducted a data harmonization to ensure the data is now calculated in a consistent manner with other broader public sector organizations.
The condition assessment report (May 2023) by SLAM Technologies Inc. determined the University has $385 million in DCRM requirements (including residences) that have accumulated over a number of years. Although this level of maintenance is not obviously apparent when walking the halls of the University, the reality is that much of the DCRM is related to roofs, HVAC, electrical, plumbing and accessibility. An important observation is that this DCRM figure does not include information technology. The specific classifications of areas of DCRM are included in Figure 108.
The Facility Condition Index (FCI) metric provides a methodology to determine the relative condition of a single building, group of buildings or total facilities and is calculated by dividing the DCRM backlog by the current replacement value. The lower the FCI, the better the condition. Brock’s backlog of DCRM items, as described below, results in the FCI for Brock of 0.25, which translates to “Poor” (an FCI > 0.15).
Looking back over the past years, the turning point of the capital program really occurred when the Board of Trustees endorsed a motion to invest $6 million in deferred maintenance (now termed DCRM) in the 2014-15 budget. The intent of the $6-million contribution was to at least maintain DCRM and FCI at its current level. The 2022-23 Fiscal Framework re-established the commitment to fund DCRM of at least $6 million annually. While the DCRM spending included in the 2024-25 capital and related project budget of $4.1 million does not meet this fiscal framework target, DCRM projects were prioritized and it was ensured that the full Facilities Renewal Program funding was utilized.
In addition to the 2024-25 capital and related projects budget, other units maintain significant capital replacement and repairs and maintenance budgets. The Facilities Management budget has $2.16 million in capital replacement and repairs and maintenance costs, Housing Services has $1.57 million, other Ancillary Operations have $0.96 million, the Information Technology Services budget has $1.27 million and other units across the University have a total of $3.39 million included as part of their operating costs. These budgets support building, mechanical, electrical and ground maintenance projects ranging from elevator maintenance to door repairs to upgrades in equipment and technology.
Source: SLAM Technologies Inc. Facility Asset Condition Database. (1) Satellite campuses: Includes Brock Research and Innovation Centre and the Marilyn I. Walker School of Fine and Performing Arts.
Funding of $1.3 million remains available for use in 2024-25 for work to progress on a new Student Information System (SIS) project. This funding remains unspent from prior year capital funding envelope allocations towards this initiative. While it was originally planned to increase the funding allocation to SIS in 2024-25, the fiscal constraints on the University have temporarily limited this possibly. It is important to note that work will be progressing on an SIS project albeit at a moderated pace.
Figure 108: COU VFA Data (as at May 2023)
Financing
Figure 111 details the current and projected external debt of the University, which is within financial metric ranges of the University’s current credit rating. The 2022-23 Fiscal Framework Update continued with the holistic approach to Brock’s capital financing strategy that allows for decisions to be made in support of strategic priorities in a fiscally sustainable manner. Maintaining the University’s credit rating at A (high) or better is a strategic priority that remains in the Fiscal Framework. The impact on the University’s credit rating will be considered for any new debt and will be supported by a complete repayment plan, including Board-approved assumptions for sinking fund strategies if required.
Morningstar DBRS maintained Brock’s credit rating on Feb. 22, 2024, with the Issuer Rating and Senior Unsecured Debentures rating of “A (high)”, with a trend of “Stable”. The continued trend of “Stable” reflects Morningstar DBRS’s positive outlook regarding Brock’s financial sustainability and is the result of the prudent fiscal measures taken across the University throughout the year. Morningstar DBRS does note in
Outstanding debt
their Rating Report that a future “negative credit rating action could arise from a significant and sustained deterioration in operating results or from a material increase in financial leverage.”
Brock secured additional debt financing of $15.5 million on June 27, 2022, to fund the acquisition of 3401 Schmon Parkway from Enbridge Inc. The loan includes a fixed interest rate of 3.91 per cent through an interest rate swap agreement, locked in for 5 years, amortizing over a fifteen-year period. Another loan with Scotiabank is due to be paid in full June 2024 with principle outstanding of $14.4 million. Currently it's budgeted that the loan will be renewed at $25 million to fund capital for engineering and research related projects such as the Clean Agriculture for Sustainable Production (CASP) field infrastructure project. Estimated interest and principal debt payments have been included in the 2024-25 budget. The debt forecast is within financial metric ranges of the University’s current credit rating; however, total debt outstanding is approaching the upper limits of the A rating.
(1) Fiscal full-time enrolment (FFTE). For a definition, refer to page 86. Note: April 30, 2022, FFTE figures have
and
by 91 as they had to be resubmitted to the Ministry following an enrolment audit. Forecasted FFTEs beyond 2023 have not been updated from the 2022-23 Fiscal Framework.
Figure 111:
The existing sinking funds for the Series A Debenture issued in 2005 and the Series B Debenture issued in 2020 continue to grow ahead of schedule due to strong investment returns. The existing sinking funds require operating budget contributions to begin in 2024-25, which have been included in the budget. The operating budget contributions accelerate in 2028-29 with the debt cost for the Sunlife Residence Loan being repurposed into the sinking fund when it is fully repaid.
Brock’s debt strategy is analyzed in Figure 112, which compares Brock’s key debt metrics to that of other universities in our comprehensive category as well as the MCU financial sustainability metric minimums.
Figure 112: Financial health metrics
Appendix F provides full definitions for each financial health metric.
The following details a high-level explanation of our debt metrics.
• The first two ratios describe how Brock utilizes a greater proportion of its annual operating expense to fund debt obligations.
• The interest coverage ratio measures the ability to fund interest charges from cash generated through operations. It remains above the guidance of 2.00 set by the Board of Trustees and above the ratio of 2.50 considered to be the standard by Morningstar DBRS for Brock’s current credit rating of A (high).
• The viability ratio is essentially how much of the institution’s debt could be paid off with expendable resources. The average institution in our category could pay all its debt with expendable resources, whereas Brock can only pay off 38 per cent and is therefore vulnerable to unplanned events.
(1) Calculated using financial information from 13 comprehensive universities. Certain 2022 metrics have been updated due to revisions in certain universities' financial statements.
(2) The $20-million repayment of the Roy and Lois Cairns Health and Bioscience Research Complex load during 2022-23 causes the one-time swing in this metric.
Endowment summary
The funding budget includes the full endowment-allocated spend related to undergraduate and graduate scholarships and student awards. This support is shown in the funding budget as a funding source (interfund revenue) with the offsetting expense (inter-fund expense). The endowment fund policy can be found at brocku.ca/policies/
The full activity of the endowment for the past three years is shown in Figure 113. Figure 114 details the 2024-25 approved endowment spending of $3.6 million, which includes both the student awards spending allocations as well as the operating and capital.
113
Figure 114
Includes the MIWSFPA endowment spending allocation, which can be used for both capital and operating.
Figure 115 details the Top 10 endowments as of April 30, 2023. Due to the timing of preparing and approving this budget, the information presented is as of April 30, 2023. This information will be updated for April 30, 2024 and incorporated into the University’s 2023-24 Annual Report.
Figure 115: Top 10 endowments (April 30, 2023)
Figure
Revenue and expense allocation model
The revenue and expense allocation model was developed through a consultative process with allocation methodologies approved by the Deans and the Provost. The model has three key functions to support academic and financial planning of the University:
1. Enhances the understanding of how revenues are generated and how costs are incurred and allocated at the Faculty level in a transparent manner.
2. Supports longer-term resource allocation decisionmaking for academic units.
3. Establishes an incentive mechanism to ensure yearend surplus funds are allocated to the Faculties and to support institutional strategic priorities.
The model has certainly improved understanding of University activities from a financial perspective and reinforces the interdependence of all Faculties and support units, building a culture of unity. Unspent funding is allocated back to Faculties in accordance with the terms of reference approved by the Provost and Deans. These allocations support strategic priorities of the Faculties consistent with the Institutional Strategic Plan.
Figure 116 is a visual representation of the 2024-25 budget using the details of the revenue and expense allocation model shown in Figure 117. This model reports the full operating budget and portrays expenses as a percentage of revenues allocated to each Faculty and in total. The model identifies two Faculties generating net positive contributions and four Faculties requiring additional funding from these positive contributions to support their operations. Through guidance from the Strategic Academic Leadership Team (SALT), this model reports all tuition allocated to the course students take and the Faculty the course belongs to, regardless of a student’s home Faculty. Taking a student-centric approach, allocating tuition based on a 100 per cent students-in-seats model, facilitates the ongoing review of academic program requirements and supports increased flexibility in programs for students to take additional elective credits.
Going forward, the model will continue to be evaluated and adjustments to the model will be made, in consultation with the SALT, where appropriate to ensure the model is meeting its goals as well as supporting the Institutional Strategic Plan.
Figure 116: 2024-25 Budget costs as a percentage of total revenue
(1) See page 42 for units included in Space Costs. Note: Space Costs are allocated directly to Faculties in this section. The space costs related to Academic Support, Student Support and Shared Services units are included in the respective lines in the allocation model. (2) Excludes Research Support Fund grant revenue as shown separately as part of revenue. (3) See pages 42 and 43 for details of units included in these categories.
Appendix A
Enrolment definitions
The following are measures of enrolment, as reported in this budget report.
• All-in enrolment: Includes degree-seeking, non-degree-seeking and certificate programs.
• Degree-seeking: A student seeking either a bachelor’s degree, a first professional degree, or a graduate master’s or PhD degree.
• Non-degree-seeking undergraduate: Those on a Letter of Permission, those auditing a course/ program or someone enrolled in undergraduate courses but with no program declaration.
• Full-time equivalent (FTE) enrolment: One undergraduate fiscal FTE (FFTE) represents a student whose study load in the fiscal year is equal to the normal full-time study load for their program and level of registration in the academic year. Undergraduate student FFTEs are summed over all academic terms. One graduate FTE is based on the registration level, full time or part time, of a student for an academic term; full time = 1.000 FTEs, part-time = 0.300 FTEs. Graduate student FTEs are summed over Fall and Summer academic terms; This methodology aligns with the studentbased FTEs reported to the Ministry and ensures that a single student, whether undergraduate or graduate, is treated equally as a full-time equivalent. Undergraduate FFTEs and graduate FTEs, when considered in combination, are termed FTEs. Note: certain new-entry winter registrations were also added to FTEs to more accurately reflect actual and budgeted tuition.
• Fiscal full-time equivalent (FFTE) enrolment: Graduate FFTEs are equal to graduate FTEs; however, they are summed over all academic terms. Undergraduate FFTEs and graduate FFTEs, when considered in combination, are termed FFTEs.
• Eligible FTEs: Those that are associated with programs or students that are approved by the Ontario government for funding purposes. Certain categories of students are ineligible (international, additional qualification and co-op on work term being the three largest groups).
• Headcount enrolment: A snapshot of the number of individuals who are attending the University at a particular point in time, usually Nov. 1 of each Academic Year, and the response to the commonly asked question: “How many students does Brock have?”
• Weighted grant units (WGUs): WGUs are used in reporting enrolment to the Ontario government for funding purposes and represent a weighted enrolment measure. The WGUs for Brock University range from 1.0 for General Arts to 3.2 for PhD students.
Appendix B
Summary of budget adjustments
As a result of certain changes in preparing the 2024-25 budget as well as changes that occurred during the 2023-24 year, reclassifications were made to the 2023-24 budget as reported in the 2023-24 Budget Report for comparison purposes when the overall funding budget was not impacted. Figures 118 and 119 detail these reclassifications by function and by responsibility centre with the most notable reclassifications highlighted with explanations. Faculty and staff full-time equivalent (FTE) impacts related to the adjustments are also shown in Figure 119.
Reclassifications by function
• During 2023-24, budgets for positions of $0.99 million were established and funded from additional strategic reserve funds of $0.21 million (offset in inter-fund revenue), operating strategic funds of $0.73 million (offset in other operating costs) and $0.05 million offset in additional grant funding.
• During 2023-24 the Office of the Ombudsperson moved into an operating project account as part of internally restricted reserves. This changed budgets in the operating fund as follows: $0.12 million decrease in student fees, $0.11 million decrease in personnel costs and a decrease of $0.01 in operating costs.
• Included in the 2023-24 budget was funding for Campus Safety Services from Student Health Services and Housing Services. The chargeback of these costs to these units was removed and instead the costs are funded directly to Campus Safety Services. This changed budgets as follows: decrease in internal chargeback revenue of $0.42 million offset by a decrease in internal chargeback expenses (shown in other operating costs) of $0.42 million.
Figure 118: Reclassifications by function
Figure 119: Reclassifications by responsibility centre
Faculty of Applied Health Sciences (29,139) (1,190) (30,329) 0.9
Goodman School of Business (28,666) (1,139) (29,805)
Faculty of Education (18,177) (705) (18,882) (3.6)
Faculty of Humanities (22,944) (1,057) (24,001) 1.7
Faculty of Mathematics and Science (24,143) (978) (25,121)
Faculty of Social Sciences (39,170) (1,727) (40,897) 0.7
Total Teaching Faculties (162,239) (6,796) (169,035)
Academic Support
Faculty of Graduate Studies and Postdoctoral Affairs (1,672) (153) (1,825) 1.0
Library (11,593) (212) (11,805)
Research Enterprise (3,079) (74) (3,153)
for Pedagogical Innovation (1,003) (23) (1,026) 0.2
and
English as a Subsequent
Wellness and
(313)
(2,381) (51)
International (1,705) (154) (1,859) Hadiyaˀdagénhahs First Nations, Métis and Inuit Student Centre (6) (6)
(1) Agrees to the 2023-24 Budget Report.
Reclassifications by responsibility centre
• During 2023-24, $8.7 million of personnel rate increases were allocated out from the University Global responsibility centre to other units as these specific amounts were not known at the time of preparing the 2023-24 budget. This total related to salary increases to administrative/professional, BUFA, CUPE 4207 Unit 2 and 3, IATSE and SAC staff.
• During 2023-24, budgets for positions of $0.73 million were established and funded from the operating strategic fund in the following units, with the noted increases to their budgets: Faculty of
Figure 119: Reclassifications by responsibility centre (cont'd)
Shared Services Academic and Administrative Offices (6,074) (316)
Education
$0.12 million; Faculty of Humanities $0.03 million; Faculty of Graduate Studies and Postdoctoral Affairs $0.07 million; Office of the Registrar $0.08 million; Student Life and Success $0.07 million; Brock International $0.9 million; Senior Academic and Administrative Team $0.11 million; University Secretariat $0.07 million; Internal Audit and University Risk Management $0.9 million offset by a decrease in University Global of $0.73 million. In addition, positions moved from People and Culture to Human Rights and Equity Services ($0.08 million) as well as from University Global to the Senior Academic and administrative team ($0.02 million) during the year.
• During 2023-24, funding to Campus Safety Services from Student Wellness and Accessibility and Housing Services was unwound. This resulted in a $0.35 million increase to the Campus Safety Services budget, a $0.28 million decrease to the Housing Services expenses and a $0.07 million decrease to the Student Wellness and Accessibility budget.
• During 2023-24, funding to support faculty relations legal costs was added to the Senior Academic and Administrative team budget from the operating strategic fund in University Global in the amount of $0.09 million.
• For purposes of the 2024-25 budget, English as a Subsequent Language, with a net budget of $0.14 million, was separated from Professional and Continuing Studies for more detailed reporting.
Appendix
C
Reconciliation of funding budget to financial statements
The University’s funding budget is prepared on a funding basis, which represents committed cash. The funding basis should not be confused with the audited Financial Statements, which are prepared in accordance with accounting standards for not-forprofits (NFPS). To allow for comparison to the annual Financial Statements, the budget has also been prepared based on the NFPS. To accomplish this task, certain accounting entries and reclassifications are required to be applied to the funding basis budget to correctly reflect the NFPS. Figures 120 and 121 detail these entries, with the following explanations. Assuming the mitigation target of $10.1 million is achieved through expense reductions or revenue increases, the impact on the NFPS results would be favorable by the same amount, meaning the deficit would be $13.9 million.
NFPS Adjustments
1. Course fees – Course fee revenue, along with the offsetting spending, is included as part of the NFPS Financial Statements. This revenue and spending is not recorded on a funding basis. An estimate of the 2024-25 course fee spending, along with the offsetting revenue, has been added to the funding basis.
2. Student fees (for capital) – Student fees received by the University to fund capital purchases, specifically the Zone Expansion fee, are included as part of deferred capital contributions in the NFPS financial statements and amortized into revenue over the useful life of the capital item it funded. However, on a funding basis, they are reported as student fee revenue. The adjustment removes the 2024-25 budget for the fee.
3. Capital Grants – The Facilities Renewal Program Funds received by the University are used for
capital purchases and are included as part of deferred capital contributions in the NFPS Financial Statements and later amortized over the useful life of the capital items it funded. However, on a funding basis, this grant is recorded as revenue. The adjustment removes the 2024-25 budget for the Facilities Renewal Program Funds.
4. Research, including fellowships – Research grants for restricted purposes and the offsetting research expenses, including fellowships, have not been included as part of the funding budget; however, they are included as part of the NFPS Financial Statements. An estimate has been added as part of the NFPS adjustments based on the average of the prior three years’ actual figures (2020-21 to 2022-23).
5. Amortization – Amortization is a non-cash expense and is therefore not included in the funding basis. For NFPS purposes, capital asset amortization is recorded to reflect the usage of capital assets, and amortization of deferred capital contributions (restricted external donations and grants) is amortized over the useful life of the assets they have funded. The 2024-25 forecasted amortization figures are added as part of the adjustments.
6. Endowment and trust spending – Spending in the endowment fund and non-endowed trust fund, mainly in the form of scholarships, is included as an expense, with an offsetting revenue as part of the NFPS Financial Statements. This spending is not recorded as part of operating expenses on a funding basis (with the exception of inter-fund transactions). The approved endowment spending for 2024-25 and an estimate of the 2024-25 trust spending along with the offsetting revenue have been added as part of the adjustments.
7. Principal payments – Principal payments of longterm debt represent cash outflows and therefore are recorded as expenses on a funding basis. These payments are not considered expenses in the NFPS Financial Statements as they reduce a liability. The 2024-25 budgeted principal payments have been eliminated as part of the NFPS adjustments.
8. Capital purchases in operating – Capital purchases made as part of operating spending are recorded as an expense on a funding basis, while they are recorded as an asset in the Statement of Financial Position for NFPS purposes. The adjustment removes the purchases the University expects to capitalize as part of 2024-25.
9. Non-capital purchases in capital and related project fund – Non-capital purchases (including personal costs) made in the capital and related project fund are reported as an expense in the NFPS Financial Statements but are not recorded in the funding basis as the expense would have been recognized upon funding the reserve. The adjustment adds the non-capital purchases estimated to be made in 2024-25.
10. Post-retirement benefits – The adjustment represents an estimate of the actuarially determined adjustment to employee future benefits related to current service. An adjustment is required because this amount represents an expense in the NFPS Financial Statements; however, since it doesn’t reflect a cash outflow, it is not recorded in the funding basis.
11. Pension – The NFPS adjustment represents the estimated paydown of the pension liability if the actuarial assumptions are met. The amount is recorded as a funding expense in the budget; however, the NFPS Financial Statements do not require this amount to be expensed as it is shown as a reduction to the pension liability.
Internal chargebacks
Internal chargeback revenue and the offsetting expenses of $13.7 million are included in the funding basis; however, they are eliminated in the NFPS Financial Statements as they represent internal charges between departments.
Inter-fund Transfers
Activity, including expenses and externally-funded revenue in the internally restricted funds, is recorded as part of the NFPS Financial Statements. For the purposes of the budget, the net change in these reserves are assumed to be negligible. However, the transfers to and from these funds are reported on a funding basis as they represent committed cash transactions. The budgeted inter-fund revenue of $8.2 million and interfund expenses of $22.2 million are eliminated as part of NFPS Financial Statements as they only represent internal movement of funds. Refer to pages 32 and 39 for explanations of these transfers.
Appendix D
Tuition fee policy, governmentfunded programs
On Feb. 27, 2024, the MCU released a memo titled “Supporting a Sustainable Postsecondary Education System” which included tuition fee framework for 2024-25 for domestic students in Ontario. The framework set out the following:
1. Continue the tuition fee freeze for domestic students at 2023-24 levels (applicable for all years of study).
2. Provides institutions the flexibility to increase tuition fees for domestic out-of-province students up to 5 per cent (applicable for all years of study).
3. Continue to increase tuition up to a maximum of 7.5 per cent per year for first-year incoming students and continuing students that started in 2023-24 that were approved as part of the 2023-24 tuition anomalies process.
Brock University will increase the tuition fees for undergraduate domestic out-of-province students by 5.0 per cent; however, this increase will not be implemented for graduate students. Brock will also increase tuition by 7.5 per cent for the 2024-25 incoming students and continuing students that started in 2023-24 in the programs that were approved for tuition anomalies. The fee changes for the 2024-25 academic year are detailed in Figure 122.
International students in undergraduate and graduate programs and cost-recovery programs are not eligible for provincial government funding, and therefore universities are not governed by the government’s tuition policy in setting tuition rates for this student group. A differentiated approach is taken to account for demand after benchmarking to fees charged at other Ontario universities. Starting in 2022-23, a cohort model was introduced for undergraduate international tuition rates where each year, Year 1 students see an eight per cent increase followed by rates frozen for four additional years. Figure 123 details the 2024-25 non-government-funded program rates that were proposed to and approved by the Board of Trustees in December 2023. Graduate research program tuition is decreased by 14.16 per cent and other graduate programs as well as ISP programs are increasing 5.0 per cent.
The Brock-Niagara Validation, Prototyping, and Manufacturing Institute (VPMI) is a collaborative hub connecting Brock researchers and students with industry partners. It integrates technical expertise and innovation at Brock University with “upstream” scientific equipment partners and “downstream” southern Ontario businesses.
Appendix F
Financial health metrics definitions
Figure 125
Metric
Primary reserve ratio
Debt burden ratio (Non-cash basis)
Interest burden %
The primary reserve ratio compares expendable net assets to total expenses and provides an indication of an institution’s financial strength and flexibility by determining how long the institution could function using its expendable reserves without relying on additional net assets generated by operations.
Expendable Net Assets include unrestricted surplus (deficit), internally restricted net assets, and internally restricted endowments, adjusted for the non-cash component of employee future benefits.
The debt burden ratio measures how an institution utilizes a greater portion of its annual expenditures to fund debt obligations. The ratio is calculated by dividing total current debt obligations, which include interest expenses and principal payments, by operating expenses.
The Interest burden ratio compares the level of current debt service with the institution's total expenses. It is an indicator of debt affordability as it examines the percentage of total expenses used to cover an institution’s cost of servicing its debt. The ratio is calculated as interest expense over total expenses (adjusted for amortization of capital assets).
Primary reserve ratio = expendable net assets/ total expenses
Interest coverage ratio
Viability ratio
Net operating revenues ratio
Interest coverage ratio measures how many times an institution could pay its current interest payment with its available earnings. The ratio is calculated by dividing earnings before interest, depreciation and amortization (EBIDA) during a given period by the amount an institution must pay in interest on its debts during the same period.
The viability ratio is a basic determinant of an institution’s financial health as it provides an indication of the funds on hand to settle its long-term obligations. It is calculated as expendable net assets over long-term debt.
Expendable net assets include unrestricted surplus (deficit), internally restricted net assets and internally restricted endowments, adjusted for the non-cash component of employee future benefits.
Long-term debt is total external long-term debt as disclosed in the institution’s financial statements without adding the current portion that may be included in accounts payable.
The net operating revenues ratio provides an indication of the extent to which institutions are generating positive cash flows in the long run to be financially sustainable. The ratio is calculated as cash flow from operating activities over total revenues.
Debt burden ratio = (interest expense + principal payments)/ total expenses
Interest burden ratio = interest expense/ (total expenses –amortization)
Interest coverage ratio = EBIDA/interest expense
Viability ratio = expendable net assets/ long-term debt
Net operating revenues ratio = cash flow from operating activities/total revenues
Brock University Niagara Region
1812 Sir Isaac Brock Way St. Catharines, ON L2S 3A1 Canada