Report
1, 2023 to August 31, 2023
2023-2024 Trimester 1
May


Executive summary
Brock, along with the entire sector, continues to face ongoing fiscal challenges, many of which derive from government policy outside our control. Cost containment measures have been utilized over many years to address policies such as the 10 per cent domestic tuition rate reduction and subsequent tuition freeze, followed by the impacts of the global pandemic. The University has demonstrated its ability to manage costs effectively, despite continuing constraints. With that said, additional steps will be necessary to ensure a balanced fiscal plan for future years. Brock will address this challenge and will continue to deliver on its strategic priorities.
The results of Trimester One estimate an overall revenue shortfall versus budget of $7.2 million, or 1.8 per cent of the total revenue budget. These results are challenging; however, the shortfall is within the range in which continuing with thoughtful spending practices can result in balanced fiscal results. While the focus in Trimester One is on revenue estimates, Financial Services also analyzed expenses and identified capacity within various expense categories to generate sufficient mitigation to offset the current year revenue shortfall.
Reviewing the fiscal results of Trimester One, we note that student fees, while still a moving target at the time of writing, are forecasted to be down versus budget by $5.9 million or 3.0 per cent. The student fee revenue shortfall is largely attributed to lower than anticipated international enrolments. International student enrolment is below target by 62 students or 2.5 per cent, and domestic student enrolment is below target by 151 students or 0.9 per cent.
Grant revenue is also below budget because of four special purpose grants. The budget plan for 2023-24 anticipated the Province would begin funding teacher education students at current enrolment levels, recognizing that the grant has been capped at 736 full-time equivalent (FTE) students for many years (vs. actual enrolment in 2022-23 of 947 FTEs). Subsequent to the budget being approved, the Province committed to one-time funding for an additional 192 FTEs, which leaves 184 budgeted FTEs unfunded, resulting in a $0.9 million shortfall to budget. The level of Nursing expansion grant is less than budget due to lower enrolment, resulting in a $1.0 million shortfall. The remaining $0.4 million variance is attributed to unanticipated changes to capital grants. Ancillary revenues and investment income were favourable to budget, offsetting the tuition and grant shortfall by $1.1 million.
The 2023-24 operating budget included a mitigation plan of $4.0 million to achieve a balanced result; therefore, this updated revenue forecast increases the mitigation target to $11.1 million. Work is underway to address this shortfall, with the goal of achieving balanced fiscal results by year-end.
This report contains certain forwardlooking information. In preparing the Trimester 1 Report, certain assumptions and estimates were necessary. They are based on information available to management at the time of preparing the forecast. Users are cautioned that actual results may vary.
Throughout the text in this report, financial values have been rounded to the nearest thousand unless otherwise stated.


2 2023-24 Trimester 1 Report A CLOSER LOOK
Photo collage on page 3: Students Experience: JUNE 22, 2023 –A group of Brock University undergraduate Health Sciences students and Master of Professional Kinesiology students travelled to Africa in May to engage in a robust work-integrated learning opportunity as part of experiential education courses HLSC 4F93 and KINE
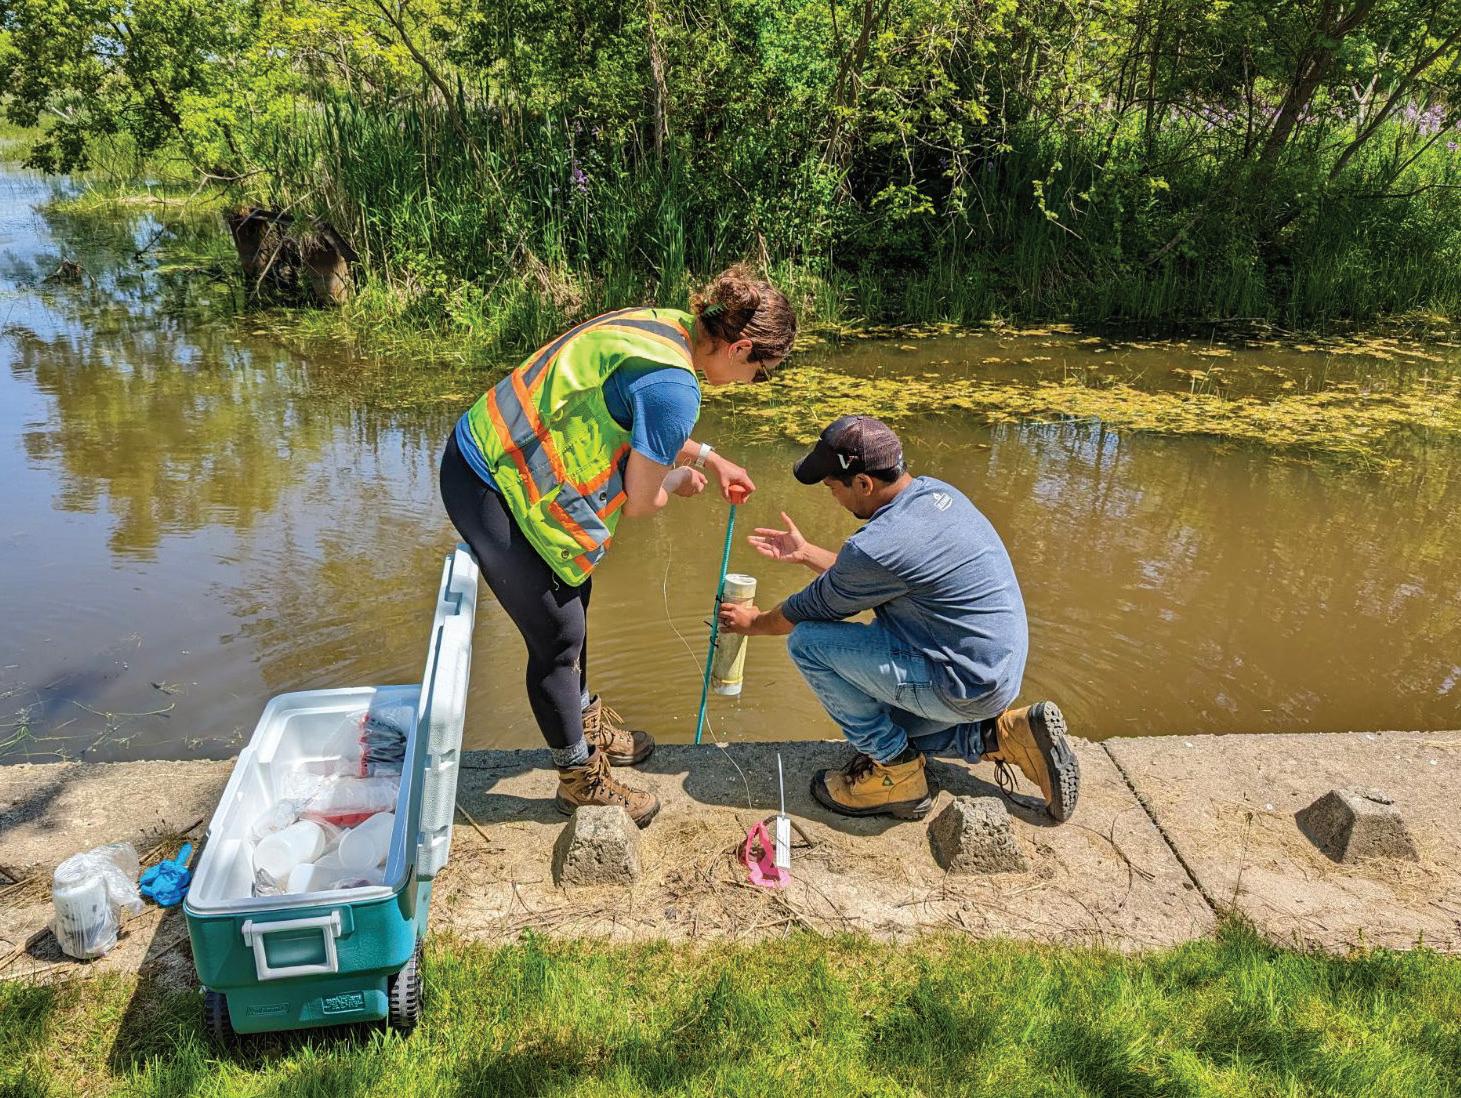
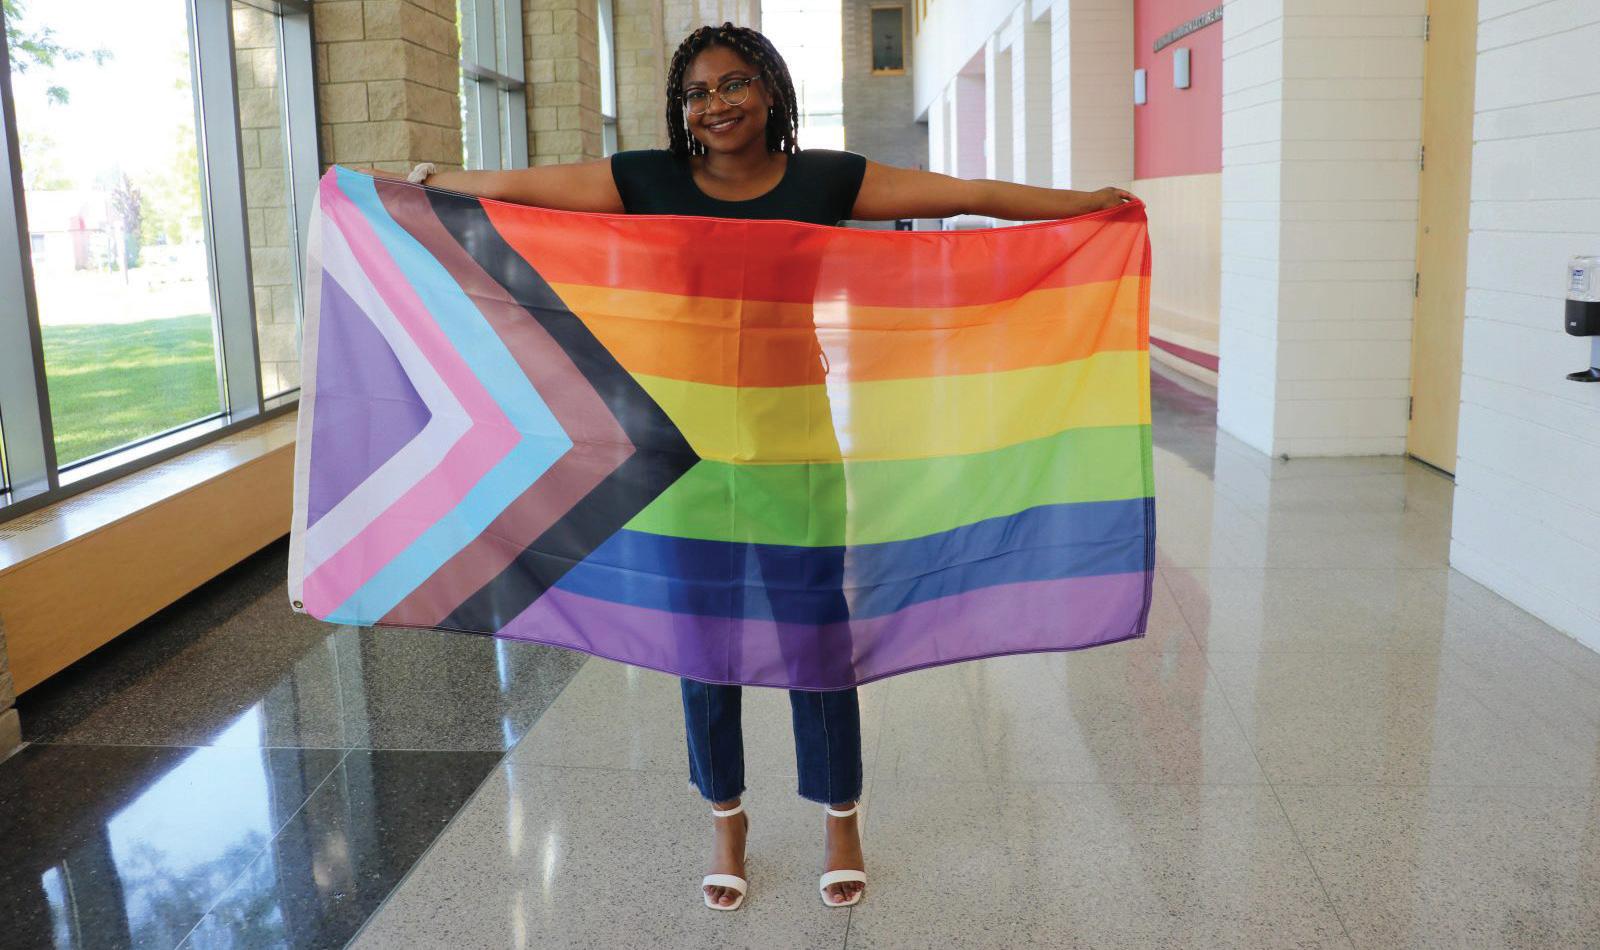
Research: AUGUST 15, 2023 –Brock researchers Kelly Biagi and Vaughn Mangal gathered samples from the Wignell Drain near Lakeshore Road in Port Colborne to examine contributing factors of algae blooms. Community Engagement: MAY 18, 2023 –Brock gave back with scholarships to 66 Niagara high school grads. Inclusivity: MAY/JUNE 29, 2023 –Eve Nyambiya, Pride Committee Member and Brock’s Gender and Sexual Violence Education Co-ordinator, displays Brock’s all-inclusive flag, preparing for an array of activities that took place at Brock in June, during the global celebration of Pride Month. Contents Executive summary 2 Our financial health Financial results 3 Taking a closer look at some of the numbers 4 Overview 4 Review of overall revenue 4 Revenue forecasts by unit 7 Anticipated savings and cost pressures 9 Treasury 10 Our debt 12 Pension 14 Capital 15 Funding forecast presented in accordance with NFPS 16 Reserves 17 Appendix 1 18 Multi-year financial results on a funding basis 18
5P03.
Financial results
The following table illustrates the trimester one revenue forecast for the University compared to budget. The information is presented on a funding basis, which represents committed cash, and based on the audited financial statements prepared in accordance with accounting standards for not for-profit organizations (NFPS). A reconciliation of the two presentations can be found on page 18


2023-24 Trimester 1 Report A CLOSER LOOK
Inclusivity Community Engagement Research
Experience 3 Our financial health Figure 1 ($000s) Funding NFPS 2023-24 Forecast 2023-24 Budget Difference better/(worse) 2023-24 Forecast 2023-24 Budget Difference better/(worse) Revenue Student fees 188,706 194,607 (5,901) 187,919 193,820 (5,901) Grant revenue 102,951 105,254 (2,303) 99,372 101,401 (2,029) Internal chargebacks 11,685 11,697 (12)Inter-fund revenue 12,605 12,605 -Research revenue - 12,222 12,222Other revenue 66,850 65,786 1,064 74,713 73,863 850 Total revenue 382,797 389,949 (7,152) 374,226 381,306 (7,080) Operating costs Personnel costs (255,334) (255,334) - (258,679) (258,679)Inter-fund expenses (29,879) (29,879) -Other operating costs (108,724) (108,724) - (142,530) (141,055) (1,475) Total operating costs (393,937) (393,937) - (401,209) (399,734) (1,475) Funding deficit – before mitigation (11,140) (3,988) (7,152) (26,983) (18,428) (8,555) Board approved 2023-24 budget mitigation(1) 3,988 3,988 - 3,988 3,988T1 forecasted revenue shortfall mitigation(1) 7,152 7,152 7,152 7,152 Funding surplus/(deficit) - - - (15,843) (14,440) (1,403)
Funding operating costs
Student
(1) For NFPS purposes it was assumed mitigation would be found in offsetting expense reductions.
were not forecasted as part of trimester one. As such, the 2023-24 budget was used.
Taking a closer look at some of the numbers
Overview
The 2023-24 trimester one forecast estimates an updated budget mitigation target of $11.1 million based on revised revenue estimates. In addition to the $3.9 million mitigation target established in the 2023-24 budget, an additional $7.2 million mitigation is a result of forecasted enrolment and other revenue shortfalls. In the past, controls on spending to reduce expenses from what was allowed for in the budget has successfully led to positive fiscal results.
Input and recommendations for future budget decisions are encouraged and may be emailed to budgetreport@brocku.ca
Review of overall revenue
As shown in Figure 2, overall revenue is forecast at $382.8 million versus the budget of $389.9 million, showing an unfavourable variance of $7.2 million, driven mainly by forecasted shortfalls in student fee revenue and grant revenue, offset by gains in investment income and other revenue. These variances will be discussed in the following sections.

MAY 12, 2023:

4
188,706 194,607 187,658 102,951 105,254 102,306 11,685 11,697 11,605 12,605 12,605 7,785 66,850 65,786 63,702
Actual Total $373,056
Forecast Total $382,797
Budget
$389,949 Student fees Grant revenues Internal chargebacks Inter-fund revenue Other revenue
2022-23
2023-24
2023-24
Total
2023-24 Trimester 1 Report A CLOSER LOOK
Figure
2: Revenue ($000s)
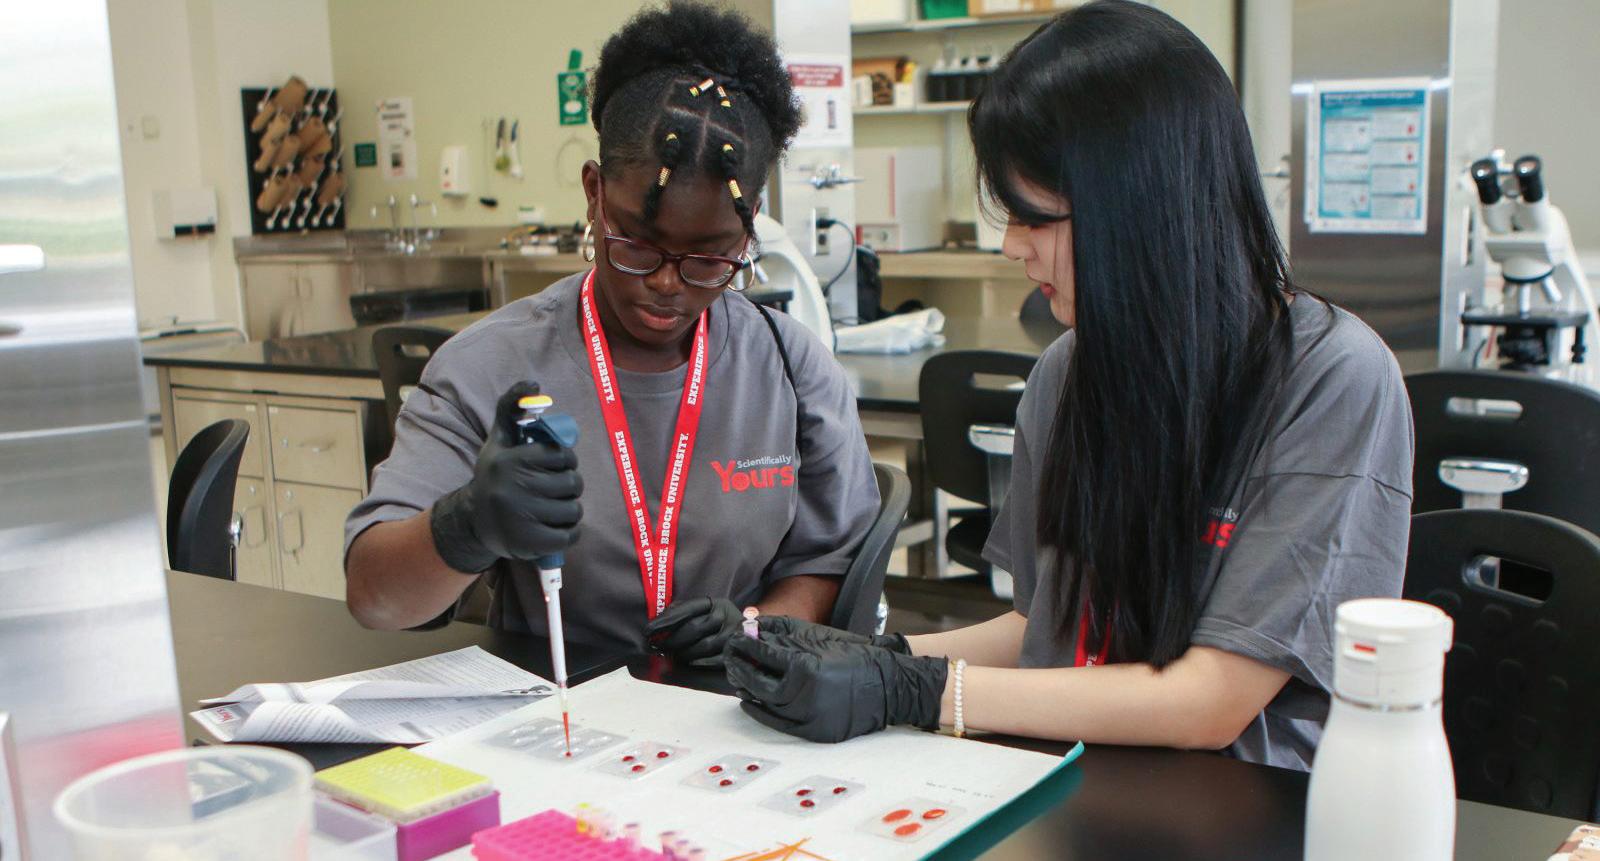
More than 100 Grade 10 and 11 students from across Ontario participated in Brock University’s Scientifically Yours conference. Notre Dame College School student Ibukun Akin-Francis (left) and Ridley College student Jaya Wang analyzed blood types as one of six STEM project sessions each student experienced over the two-day event.

Student fees and enrolment
As shown in Figures 3 and 4, overall enrolment is forecast to be lower than budget, with 213 less students. Proportionally the largest shortfall was seen in undergraduate international students, forecast 4.7 per cent less than budget or 86 students, followed by graduate domestic students 1.0 per cent less than budget or 11 students, and undergraduate domestic students 0.9 per cent less than budget or 140 students. In contrast, graduate international enrolment is forecast 3.9 per cent above budget or 24 students.
The lower enrolment forecast translates into overall student fee revenue showing a negative variance to budget of $5.9 million. Much of the decline versus


budget is seen in undergraduate international tuition ($4.1 million lower than budget) as shown in Figure 5.
The 2023-24 budget also included an estimate of $1.6 million in additional tuition revenue related to the 2023-24 Tuition Fee Framework released by the MCU on March 2, 2023, which allowed universities to submit applications for ministry approval of domestic tuition fee increases in certain regulated programs based on identified criteria. For the purposes of the 2023-24 budget, it was anticipated that most programs where applications were submitted would receive approval to increase tuition for incoming students by 7.5 per cent in 2023-24, with the teacher education and sport management program tuition rates expected to move to
1)
2023-24 Trimester 1 Report A CLOSER LOOK 5
Faculty 2023-24 Forecast 2023-24 Budget Difference – better/ (worse) 2022-23 Actual Difference – better/ (worse) Domestic International Total Domestic International Total Faculty of Applied Health Science 4,216 223 4,439 4,191 200 4,391 48 4,382 57 Goodman School of Business 2,173 822 2,995 2,210 845 3,055 (60) 3,173 (178) Faculty of Education 1,696 60 1,756 1,793 66 1,859 (103) 1,792 (36) Faculty of Humanities 1,841 95 1,936 1,888 97 1,985 (49) 1,968 (32) Faculty of Mathematics and Science 2,008 526 2,534 1,941 532 2,473 61 2,420 114 Faculty of Social Science 4,637 661 5,298 4,651 709 5,360 (62) 5,348 (50) No Faculty 52 52 100 100 (48) 106 (54) Total headcount 16,623 2,387 19,010 16,774 2,449 19,223 (213) 19,189 (179)
Figure 4: All in student headcount by Faculty (1)
Represents student headcount full-time (FT) and part-time (PT). For a definition refer to pg 88 of the 2023-24 Budget Report. The enrolment forecast used for the budget and forecast is 'all-in' and includes letter of permissions, non-degree students, auditors, additional qualifications, and certificates.
Type 2023-24 Forecast 2023-24 Budget Difference – better/(worse) 2022-23 Actual Difference – better/(worse) # % # % Undergraduate – domestic 15,503 15,643 (140) (0.9%) 15,601 (98) (0.6%) Undergraduate – international 1,751 1,837 (86) (4.7%) 1,797 (46) (2.6%) Graduate – domestic 1,120 1,131 (11) (1.0%) 1,139 (19) (1.7%) Graduate – international 636 612 24 3.9% 652 (16) (2.5%) Total 19,010 19,223 (213) (1.1%) 19,189 (179) (0.9%)
Figure 3: All in student headcount by type (1)
MAY 26, 2023: Brock gets a $2.9-million boost in federal funding from Environment and Climate Change Canada to support low-carbon goals. In photo: Brock University mechanics in the Central Utilities Building engine room. From left: Kassim Tufail, James Doran and Brian Forbes.
the professional program rate immediately. Subsequent to the finalization of the budget, on May 12, 2023, the University received approval from the MCU to increase tuition rates for all of the programs for which Brock applied with rate increases ranging from 24.4 per cent up to 111.3 per cent depending on the program. This was great news and a credit to the significant advocacy work by the Brock team with the MCU. Each of these substantial increases were capped at 7.5 per cent annually, which resulted in an updated estimate of additional tuition revenue of $0.8 million for 2023-24 versus the $1.6 million budgeted. It’s interesting to note that it will take over 10 years to fully recognize certain approved increases, given the 7.5 per cent annual cap.
Figure 6 details global tuition by session – spring/ summer and fall/ winter for the forecast and the past two years. Traditionally spring/summer is budgeted to be flat year over year. However, less enrolment occurred in the spring session of 2023 compared to 2022 which resulted in a $1.2 million shortfall.
As shown in Figure 5, English as a Subsequent Language (ESL) IELP and SELP program tuition revenue is forecast $0.3 million below budget; however, expenses are variable with this program and the net impact will be mitigated with reduced part-time teaching costs. The fee revenue forecast is $0.6 million below budget driven by co-op fees resulting from lower enrolment, as well as the addition of new budgeted co-op fees being postponed.
6
($000s) 2023-24 Forecast 2023-24 Budget Difference better/ (worse) Tuition revenue(1) Undergraduate – domestic Faculty of Applied Health Sciences 24,369 24,460 (91) Goodman School of Business 16,127 16,142 (15) Faculty of Education 8,816 8,412 404 Faculty of Humanities 10,797 10,986 (189) Faculty of Mathematics and Science 12,586 12,179 407 Faculty of Social Sciences 25,747 25,771 (24) Other (2) 225 310 (85) Total undergraduate – domestic 98,667 98,260 407 Graduate – domestic Faculty of Applied Health Sciences 3,076 2,532 544 Goodman School of Business 1,283 1,372 (89) Faculty of Education 799 992 (193) Faculty of Humanities 327 391 (64) Faculty of Mathematics and Science 497 632 (135) Faculty of Social Sciences 2,148 2,314 (166) Total graduate – domestic 8,130 8,233 (103) Total domestic 106,797 106,493 304 Undergraduate – international Faculty of Applied Health Sciences 6,039 5,328 711 Goodman School of Business 13,290 14,972 (1,682) Faculty of Education 475 696 (221) Faculty of Humanities 2,189 2,387 (198) Faculty of Mathematics and Science 13,738 13,798 (60) Faculty of Social Sciences 14,629 17,310 (2,681) Other (2)Total undergraduate – international 50,360 54,491 (4,131) Graduate – international Faculty of Applied Health Sciences 530 455 75 Goodman School of Business 12,493 12,811 (318) Faculty of Education 608 695 (87) Faculty of Humanities 432 424 8 Faculty of Mathematics and Science 1,604 1,736 (132) Faculty of Social Sciences 1,459 1,341 118 Total graduate – international 17,126 17,462 (336) Total international 67,486 71,953 (4,467) Total undergraduate and graduate tuition 174,283 178,446 (4,163) Continuing Teacher Education –Additional Qualifications (AQ) 760 808 (48) Adult Education 522 487 35 Intensive and Short-term English Language Programs (IELP & SELP) 1,136 1,470 (334) Professional and Continuing Studies 250 250Total tuition revenue before tuition anomalies 176,951 181,461 (4,510) Domestic tuition anomolies 812 1,600 (788) Total tuition revenue 177,763 183,061 (5,298) Fee revenue 10,943 11,546 (603) Total student fees 188,706 194,607 (5,901 ) (1) Figures based on Faculty of major. (2) Includes letter of permission, non-degree students and auditors. 2023-24 Trimester 1 Report A CLOSER LOOK
Figure 5: Student fee revenue
Spring/Summer Fall/Winter 2021-22 Actual 2022-23 Actual 2023-24 Forecast 12.7% 87.3% 14.0% 86.0% 13.8% 86.2% 22.2 152.1 24.4 24.3 150.2 151.4
Figure 6: Tuition by session(1) ($ millions)
(1) Tuition by session does not include ESL, Continuing Teacher Education, Adult Education or Professional and Continuing Studies tuition.
Grant revenue
Figure 7 details grant revenue. Grant revenue is forecasted to be lower than budget by $2.3 million, as a result of variances related to four specific grants.
Lastly, the Niagara Region made a commitment to Brock to support capital-related spending in the amount of $1.5 million. It was initially expected this funding would be received over a three-year period, $0.5 million each year. It was subsequently communicated after the 2023-24 budget was established that this commitment would be paid in annual instalments of $0.2 million each calendar year. Due to the timing of the payments Brock will receive $0.4 million in 2023-24 resulting in a variance to budget of $0.1 million this year.
Other revenue
Other revenue, as shown in Figure 8 is forecast to be $66.9 million, $1.1 million more than the budget of $65.8 million. Stronger than budgeted investment income accounts for $1.0 million of this positive variance as well as higher ancillary revenue of $0.1 million, driven by Conference Services, offset by a small negative variance in sales and services revenue. Investment income will be discussed in the Treasury section of this report.
Included in the budget was $2.1 million of incremental funding for teacher education, shown as part of the Core Operating grant. It was expected the University would be funded for a total of 1,112 full-time equivalent (FTE) students (376 incremental in 2023-24); however the MCU subsequently reported they would only be funding 192 incremental FTEs in 2023-24 resulting in lower grant revenue of $0.9 million, and therefore leaving some students still unfunded. It is anticipated that the unfunded students will be added to our grant in 2024-25, however, no commitment has been made in writing at this time.
At the time of budget preparation the expansion of the provincial nursing funding was not finalized, but it was assumed the majority of Brock’s nursing enrolment would be funded which resulted in a budgeted grant of $6.19 million. As of trimester one the forecast is $1.0 million less than budget as a result of lower than budgeted enrolment.
Communication regarding the provincial Facilities Renewal Program (FRP) funding for 2023-24 was not received at the time of budget preparation. Consistent with prior years where FRP funding has been maintained or slightly increased, the budget assumed the same funding received in 2022-23 at $3.8 million. It was subsequently announced by the province that the sector-wide funding would be reduced for 2023-24 resulting in Brock’s allocation decreasing by $0.3 million.
Revenue forecasts by unit
Figure 9 on the following page details the funding by responsibility centre by grouping the forecast and budget into one of the following categories: Teaching Faculties, Academic Support, Student Specific, Shared Services, Ancillary, Space and Global. As part of the trimester one forecast, the units with significant revenue sources were asked to update their revenue projections. Therefore, only the budgeted and forecasted revenue by responsibility centre is included in this figure. Please note that Figure 9 includes certain reclassifications to the 2023-24 budget as compared to the figures presented in the 2023-24 Budget Report. All reclassifications will be fully reconciled in the future 2024-25 Budget Report, noting the changes did not impact the net reported budget.
7 2023-24 Trimester 1 Report A CLOSER LOOK
($000s) 2023-24 Forecast 2023-24 Budget Difference better/ (worse) Residence fees 24,898 24,920 (22) Other ancillary revenue 15,992 15,878 114 Total ancillary revenue 40,890 40,798 92 Investment income 3,200 2,200 1,000 Sales and services 15,887 15,915 (28) Asset sale revenue 6,873 6,873Total other revenue 66,850 65,786 1,064
Figure 8: Other revenue
($000s) 2023-24 Forecast 2023-24 Budget Difference better/ (worse) MCU Operating Grants Core Operating Grant 40,524 41,445 (921) Differentiation Envelope (Performance/ Outcomesbased Funding Grant) 48,418 48,418Special Purpose Operating Grant Envelope 3,315 3,315International Student Recovery (1,790) (1,790)Total MCU operating grants 90,467 91,388 (921 ) Other MCU and specific purpose grants 12,484 13,866 (1,382 ) Total grant revenue 102,951 105,254 (2,303)
Figure 7: Grant revenue
8
Responsibility
($000s) 2023-24 Forecast revenue 2023-24 Budget revenue Change of revenue amounts Teaching Faculties Faculty of Applied Health Sciences 373 373 Goodman School of Business 962 962 Faculty of Education 2,059 2,096 (37) Faculty of Humanities 626 626 Faculty of Mathematics and Science 1,804 1,804 Faculty of Social Sciences 398 398 Total Teaching Faculties 6,222 6,259 (37) Academic Support Faculty of Graduate Studies 446 446 Library 8 8 Research services 3,648 3,648 Centre for Pedagogical Innovation 280 280 Professional and Continuing Studies and ESL 3,265 3,728 (463) Total Academic Support 7,647 8,110 (463) Student Specific Office of the Registrar 2,719 2,719 Student Wellness and Accessibility 3,281 3,281 Student Life and Success 777 777 Brock International Services 215 215 Hadiyaˀdagénhahs First Nations, Métis and Inuit Student Centre 580 580 Co-op, Career Services and Experiential Education 2,094 2,572 (478) Brock Sports and Recreation 8,270 8,270 Total Student Specific 17,936 18,414 (478) Ancillary Ancillary Operations 15,961 15,833 128 Residence 25,223 25,271 (48) Total Ancillary 41,184 41,104 80 Shared Services Information Technology Services 604 604 Financial Services 575 575 Office of People and Culture 374 374 Development & Alumni Relations 993 993 Printing Services 955 955 Human Rights and Equity Services 636 636 Total Shared Services 4,137 4,137Space Facilities Management 1,957 1,957 Campus Safety Services 245 245 Campus Development and Community Agreements 307 307 Utilities, Taxes and Insurances 3,125 3,125 Financing 4,711 4,711 Total Space 10,345 10,345Global Scholarships, Bursaries and Fellowships 3,629 3,629 Capital 7,621 7,895 (274) University Global 284,076 290,056 (5,980) Total Global 295,326 301,580 (6,254) Total University 382,797 389,949 (7,152) 2023-24 Trimester 1 Report A CLOSER LOOK
Figure 9: Funding by responsibility centre
centres
Anticipated savings and cost pressures
Recognizing our approved budget plan for 2023-24 included a mitigation target of $4.0 million and noting that trimester one estimates a $7.2 million revenue shortfall, Financial Services analyzed our budgeted expenditures to provide some assurance on our ongoing efforts to achieve a balanced fiscal result or better.
With personnel costs contributing to approximately two thirds of Brock operating expenses our analysis focused in this area. The analysis was performed by position and resulted in an estimated $11.3 million of unfilled budgeted personnel costs, should the positions remain unfilled for the rest of the fiscal year. These savings are offset by $1.4 million additional personnel costs not included in the budget.
In addition to the personnel cost savings potential, $0.9 million of the $1.95 million of the uncommitted strategic/ discretionary funds established in the budget
at 0.5 per cent of revenues, remains uncommitted at the end of trimester one and available for mitigation.
Taking into consideration the impact of this expense review outlined in Figure 10, we anticipate remaining mitigation of $0.4 million which will be addressed with ongoing strategies throughout the year including other operating expense savings.
Figure 10: Pressures and potential savings to budgeted expenditures


2023-24 Trimester 1 Report A CLOSER LOOK 9
Additional anticipated savings Amount ($000s) Board approved 2023-24 budget mitigation (3,988) T1 Forecasted revenue shortfall mitigation (7,152) Known variances to personnel compared to budget (1,365) Total T1 Forecast with known personnel variances (12,505) Estimated personnel savings based on full hiring freeze (as at Aug. 2023) 11,290 Uncommitted strategic/discretionary funds 853 Net estimated surplus (362)
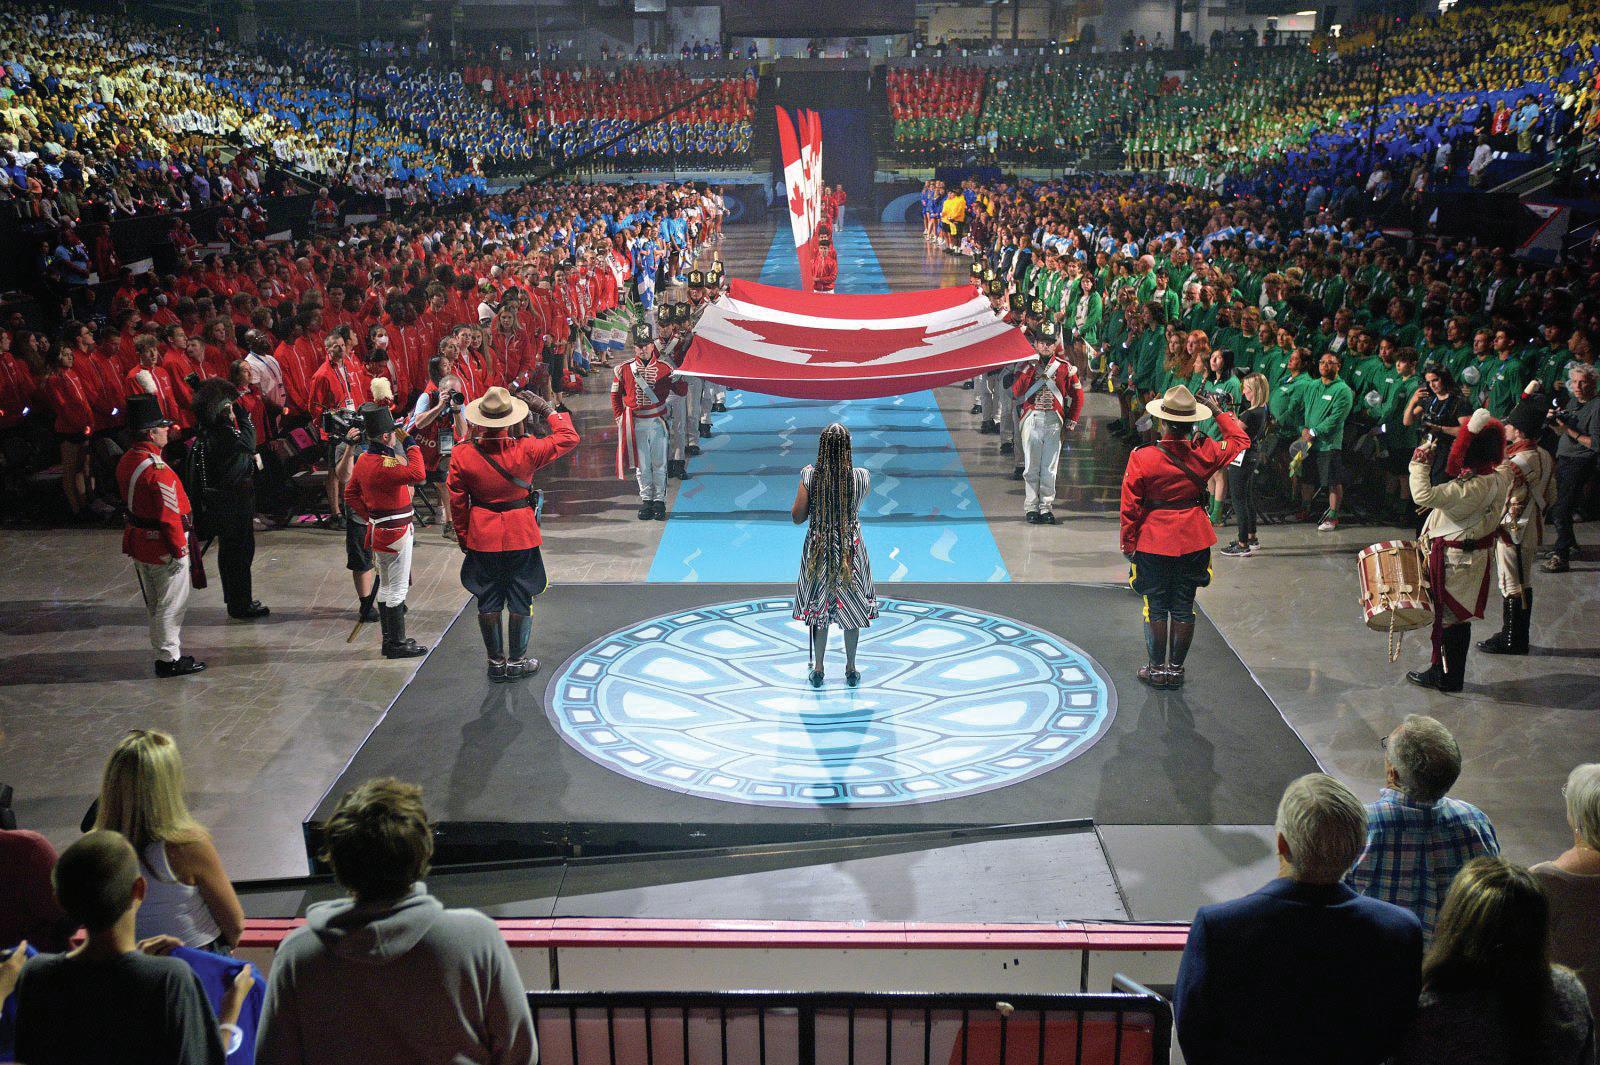
JUNE 8, 20233: A historic sporting event in which Brock University played a decisive role in hosting has won a pair of national awards. The Niagara 2022 Canada Games was named the Canadian Sport Event of the Year Award and Sport Event Legacy of the Year Award during Sport Tourism Canada’s (STC) 15th annual PRESTIGE Awards Gala in Richmond, B.C.
Treasury
Operating fund investment scorecard
Around this time last year the Government of Canada yield curve became inverted. At August 31, 2022 the government of Canada benchmark ten-year bond yield was 3.1 per cent which compared to a two-year bond yield of 3.6 per cent. Interest rates have continued to rise; however, the inversion in yield remains. At August 31, 2023 the government of Canada benchmark ten-year bond yield was 3.4 per cent which compared to a two-year bond yield of 4.6 per cent representing a 70 basis point increase in spread from last year between the two benchmark rates. The yield on the operating investment portfolio is currently 5.3 per cent with an average duration of less than 1 year (3.1 per cent yield and less than 1-year average duration at the same time last year.) The cash deposit rates are linked to the Bank of Canada overnight target rate plus an adjustment factor. As at August 31st 2023 the deposit interest rate was 5.6 per cent for general deposits and 5.7 per cent for the 30 day
notice account. Our operating investment income is on track to exceed budget by $1.0 million. A summary of investment holdings as of Aug. 31, 2023 is shown in Figure 14. Figure 12 outlines monthly investment income performance compared to 2022-23. As detailed in Figure 11, operating investments have achieved 59 per cent of budget as we reach 33 per cent of the way through the fiscal year. The sinking fund during the first four months of fiscal 2023-24 has been flat with an annualized 0.4 per cent gain (8.5 per cent loss at the same time last year). Shortterm volatility is common and expected with this fund. We continue to support this fund as a long-term investment strategy to fund the 2045/2060 payout of the University's two debentures and the employee future benefits reserve. The fund requires a 5 per cent annual rate of return for the series A $93 million debenture and a 5.2 per cent rate of return for the series B $125 million debenture to achieve its goal and this rate of return is aligned with the asset mix and skill of the fund manager.
10 2023-24 Trimester 1 Report A CLOSER LOOK
Actual 2023-24 operating fund Actual 2022-23 operating fund Actual 2022-23 sinking fund Actual 2023-24 sinking fund -1,000 -500 0 500 1,000 1,500 2,000 2,500 3,000 3,500 4,000 4,500 5,000 5,500 6,000 6,500 7,000 April March Feb. Jan. Dec. Nov. Oct. Sept. Aug. July June May
Figure 12: Cumulative monthly investment income performance 2021-22 vs. 2022-23 ($000s)
($000s) Unless otherwise stated 2023-24 Actuals to Aug. 31 2023-24 Budget/target (2) 2022-23 Actual % of Budget achieved Operating investment income 1,296 2,200 5,648 59% Sinking fund – 2005 bond 13 403 517 3% Employee future benefits reserve 10 385 NA Sinking fund – 2020 bond 5 150 94 3% Investment income (1) 1,324 2,753 6,643 48% (1) Brock currently has 4 externally restricted segregated trust investments
included in the figures above. (2) Represents budget
Operating
funds.
Figure 11: Summary investment income – Operating Funds
not
for
investment income and target for the sinking
11 2023-24 Trimester 1 Report A CLOSER LOOK 2021-22 scal year 2019-20 scal year 2020-21 scal year 2022-23 scal year 2023-24 scal year April March Feb. Jan. Dec. Nov. Oct. Sept. Aug. July June May 250,000 225,000 200,000 175,000 150,000 125,000 100,000 75,000 50,000 25,000 0
Figure 13: Monthly cash flow – historical trend month-end balances ($000s)
($000s) Unless otherwise stated Market Value as at Aug. 31, 2023 Annualized rate of return Fees Net annualized rate of return Scotiabank General account ($20 million average minimum balance) 43,377 5.55% 0.00% 5.55% 30 Day GIC 48,282 5.70% 0.00% 5.70% 1 Year GIC 1,050 5.70% 0.00% 5.70% 1 Year GIC 2,000 6.00% 0.00% 6.00% 1 Year GIC 3,000 6.21% 0.00% 6.21% 18 Month GIC 2,500 3.23% 0.00% 3.23% 2 Year GIC 3,000 1.74% 0.00% 1.74% 2 Year GIC 5,000 4.70% 0.00% 4.70% 2 Year GIC 3,000 6.16% 0.00% 6.16% 2 Year GIC 3,000 4.24% 0.00% 4.24% 2 Year GIC 2,500 6.21% 0.00% 6.21% 3 Year GIC 3,000 4.34% 0.00% 4.34% Total for account 119,709 5.42% 0.00% 5.42% BMO Nesbitt Burns Savings account 5 4.20% 0.05% 4.15% 18 Month GIC 2,500 2.58% 0.05% 2.53% 18 Month GIC 50 5.10% 0.50% 4.60% 2 Year GIC 3,000 1.70% 0.05% 1.65% 2 Year GIC 2,500 4.70% 0.05% 4.65% Total for account 8,055 2.93% 0.05% 2.88% TD Waterhouse 1 Year GIC 1,000 5.11% 0.00% 5.11% Total for account 1,000 5.11% 0.00% 5.11% Mawer – balanced fund Sinking fund series A Bond 8,967 Sinking fund series B Bond 3,140 Employee future benefits reserve 6,674 Total for account 18,782 0.43% 0.25% 0.18% Portfolio consolidated total 147,546 4.65% 0.03% 4.61%
Figure 14: Summary of investment holdings
Our debt
Figure 15 details the current and projected external debt of the University, which is within financial metric ranges of the University’s current credit rating. The 2022-23 Fiscal Framework Update continues with the holistic approach to Brock’s capital financing strategy that allows for decisions to be made in support of strategic priorities in a fiscally sustainable manner. Maintaining the University’s credit rating at A (high) or better is a strategic priority that remains in the Fiscal Framework. The impact on the University’s credit rating will be considered for any new debt and will be supported by a complete repayment plan, including Board-approved assumptions for sinking fund strategies if required.
DBRS Morningstar maintained Brock’s credit rating on March 2, 2023, with the Issuer Rating and Senior Unsecured Debentures rating of “A (high)”, with a trend of “Stable”. The continued trend of “Stable” reflects DBRS Morningstar's positive outlook regarding Brock’s financial sustainability and is the result of the prudent fiscal measures taken across the University throughout the year. DBRS Morningstar continues to expect the University to post balanced operating results, or better, on a consolidated basis.
(1) Fiscal full-time enrolment (FFTE). For a definition, refer to page 88 of the 2023-24 Budget Report. Forecasted FFTEs beyond 2023 have not been updated from the 2022-23 Fiscal Framework.
(2) Future decisions on refinancing the Scotia loan are outstanding.
($000s) Unless otherwise noted Actual Forecast April 30, 2017 April 30, 2018 April 30, 2019 April 30, 2020 April 30, 2021 April 30, 2022 April 30, 2023 April 30, 2024 April 30, 2025 2005 Bond 93,000 93,000 93,000 93,000 93,000 93,000 93,000 93,000 93,000 Roy and Lois Cairns Health and Bioscience Research Complex 24,863 24,109 23,319 22,491 21,624 20,715 3401 Schmon Parkway 14,208 12,968 11,561 Residence 15,215 14,333 13,385 12,366 11,271 10,095 8,831 7,473 6,014 Marilyn I. Walker School of Fine and Performing Arts (MIWSFPA) 15,960 15,240 14,520 2020 Bond and Scotia loan (2) 14,400 139,400 139,400 139,400 139,400 125,000 Total debt 149,038 146,682 144,224 142,257 265,295 263,210 255,439 252,841 235,575 Total student FFTE (1) 20,086 20,303 20,548 21,597 21,896 21,598 21,289 22,980 23,090 Total debt/FFTE (in dollars) (1) $7,420 $7,225 $7,019 $6,587 $12,116 $12,187 $11,999 $11,003 $10,202 Debt reduction strategy Sinking fund – 2005 Bond 6,413 6,696 7,370 7,607 8,843 8,437 8,954 9,302 10,172 Sinking fund – 2020 Bond 1,532 3,136 4,797 7,480 Debt repayment reserve 2,895 4,457 6,753 384 1,884 3,153 M. Walker donation – MIWSFPA 5,326 5,470 5,617 Other donations – MIWSFPA 717 851 932 Total assets for debt reduction 15,351 17,474 20,672 7,991 10,727 13,122 12,090 14,099 17,652 Net debt 133,687 129,208 123,552 134,266 254,568 250,088 243,349 238,742 217,923 Net debt/FFTE (in dollars) (1) $6,656 $6,364 $6,013 $6,217 $11,626 $11,579 $11,431 $10,389 $9,438
Figure 15: Outstanding debt
12 2023-24 Trimester 1 Report A CLOSER LOOK


JUNE 23, 2023:
JUNE 12, 2023: Lesley Rigg (centre) was installed as Brock University’s seventh President and ViceChancellor.
Nicole Joy-Fraser sang and drummed prior to a feast at Indigenous Peoples Awareness Week.
Interest rate Payment terms Date to be paid in full Annual payment ($000s) Earp/Lowenberger – Residence 7.200% Monthly blended payments of principal and interest of $162,443.70. October 2028 1,949 Student experience projects 2.490% Interest only payments until June 2024. June 2024 359 Student experience projects –line of credit Bankers Acceptance + 45 basis points Due on demand NA NA Debenture payable (bullet) – 2005 4.967% Interest payable semi-annually $2,309,655. December 2045 4,619 Debenture payable (bullet) – 2020 3.033% Interest payable semi-annually $1,895,625. May 2060 3,791 3401 Schmon Parkway 3.910% Serial amortizer loan with fixed principal payments of $1,550,000 annually plus interest June 2032 Approx. 2,077
Figure 16: Long-term debt
Debt
Published range current credit rating 2022-23 Fiscal year 2021-22 Fiscal year Fiscal full-time equivalent (FFTE) 21,289 21,598 Total long-term debt/FFTE ($) 10.000 – 15.000 11,999 12,187 Interest coverage ratio 1.3 times to 2.5 times 2.68 times 2.98 times Surplus-to-revenue 0% to 1% (5 year average) 1.8% 2.8% Debt retirement assets Required rate of return Payment terms Date to be paid in full Annual payment ($000s) Sinking fund investment –2005 Bond 5.000% Policy requires Brock to annually review sinking fund investment performance and required contributions. December 2045 As per Fiscal Framework Sinking fund investment –2020 Bond 5.200% Policy requires Brock to annually review sinking fund investment performance and required contributions. May 2060 As per Fiscal Framework Debt reduction reserve N/A Annual contribution to an internally restricted reserve for debt repayment initially approved by the Board of Trustees on March 12, 2015. N/A As per Fiscal Framework 13 2023-24 Trimester 1 Report A CLOSER LOOK
Figure 17:
metrics


Pension
The actuarial valuation on the pension plan completed as at July 1, 2022, indicated the plan was 99 per cent funded on a going-concern basis (98 per cent as at January 1, 2020 valuation) and 105 per cent on a solvency basis (106 per cent as at January 1, 2020 valuation). The going concern deficit improved slightly due to higher interest rates increasing the discount rate that reduces the present value of the liabilities. The actuary sets the expected rates of returns based on industry best practices guided by the Canadian Institute of Actuaries. The University has no control or influence over these assumptions used by the actuary. The going concern deficit of $5.3 million ($12.7 million as at January 1, 2020 valuation) has required special payments into the plan of $0.5 million representing an annual savings of $1.0 million compared to the last valuation. In addition, current service cost payments for the plan of $14.1 million for a total cost to the University of $14.6 million annually. Employees also contribute to the money purchase component of the plan (defined contribution) an additional $8.2 million resulting in an employer to employee funding ratio of 1.8 to 1.0. An updated valuation is required before the next triannual valuation date of July 1, 2025.
Net assets available for bene ts ($000s) Gross return 0 2016 2017 2018 2019 2020 2021 2022 2023 449,411 481,174 515,006 561,168 595,224 653,618 596,744 650,128 3.1% 9.7% 8.4% 8.3% 7.5% 12.5% -6.9% 11.12%
Figure 18: Pension Plan as of June 30 pension year end ($000s)
14 2023-24 Trimester 1 Report A CLOSER LOOK
JULY 13, 2023: Brock research on Crawford Lake and proposed Anthropocene made global headlines. In photo: Brock University Professor of Earth Sciences Francine McCarthy (centre) explains the layers of sediment collected from the muddy bottom of Crawford Lake to journalists at the research site earlier this year.
Capital
University infrastructure investment is ongoing as we invest in new and current space and technology to support and improve the student, academic and research experience. Figure 19 illustrates the number of open capital and related projects. These projects include all 2023-24 projects as well as uncompleted prior year projects. Note: the majority of the 2023-24 projects were opened prior to May 1, 2023. Figure 20
illustrates the activity to Aug. 31, 2023 with respect to the type and dollar amount of projects. The established 2023-24 capital and related projects budget is $12.97 million (Information Technology Services Projects –$4.77 million; Facilities Management Projects – $8.20 million). As noted previously, the 2023-24 Facility Renewal Program funding from the Ministry has been reduced by $0.3 million ($3.579 million received vs. $3.853 million budgeted), as a result projects will be identified and deferred to account for this shortfall.
not
of all funding received to date.
2023-24 Trimester 1 Report A CLOSER LOOK 15
($000s) Facilities Management Residence and ancillary services Information Technology Services Total projects open as of April 30, 2023 74 13 41 Projects opened to Aug. 31, 2023 1 2 Projects closed/completed to Aug. 31, 2023 (2) Total projects open as of Aug. 31, 2023 73 15 41
Figure 19: Status of capital projects as of Aug. 31, 2023
Capital
Project type ($000s) Revenue/ funding (1) Spending to Aug. 31, 2023 Remaining to spend Facilities Management AODA* Projects 470 (69) 401 Above surface/sub surface utilities, drainage, roads, parking lots, sidewalks 1,778 (787) 991 Adaptations/renovations and major renewal projects 1,508 (1,260) 248 Audits and studies 780 (326) 454 Buildings 11,619 (5,359) 6,260 Energy conservation and demand management 9,130 (1,947) 7,183 Major capital projects 8,105 (6,281) 1,824 Vehicles and wheeled equipment 1,142 (618) 524 FM – surplus/(deficit) 2,100 2,100 Total Facilities Management projects 36,632 (16,647) 19,985 Residence and Ancillary Services Above surface/sub surface utilities, drainage, roads, parking lots and sidewalks 613 (223) 390 Adaptations/renovations and major renewal projects 551 551 Buildings 7,205 (2,238) 4,967 Residence and Ancillary Services – surplus/(deficit) 558 558 Total Residence and Ancillary Services 8,927 (2,461) 6,466 Information Technology Services Enterprise software projects 13,896 (9,963) 3,933 Hardware evergreening projects 2,563 (447) 2,116 Hardware growth projects 868 (130) 738 IT infrastructure projects 1,883 (56) 1,827 ITS – surplus/(deficit) 52 52 Total Information Technology Services projects 19,262 (10,596) 8,666 Total capital and related projects 64,821 (29,704) 35,117 * AODA – Accessibility for Ontarians with Disabilities. (1) Funding revenue represents total expected funding and cash received. This amount
Figure 20:
and related project summary
is
reflective
Funding forecast presented in accordance with NFPS
Throughout this report financial information has been reported on a funding basis (sometimes referred to as committed cash basis). Figures 21 and 22 detail the entries and reclassifications required to convert the funding budget to be in accordance with the Canadian accounting standards for not-for-profit organizations (NFPS). Please refer to page 90 and 91 of the 2023-24 Budget Report for detailed
explanations of all the adjustments, reclassifications and eliminations. These adjustments, reclassifications and eliminations for the 2023-24 forecast were consistently applied with those of the 2023-24 budget. The forecast for NFPS adjustment #3 has been updated and in addition the NFPS forecast also includes anticipated spending in the strategic initiative fund which is not recorded on a funding basis (adjustment #13). It is interesting to note that Brock is the only DBRS rated University that fully reconciles and converts budget to NFPS.
16 2023-24 Trimester 1 Report A CLOSER LOOK
Figure 22 Note Reconciliation of NFPS adjustments ($000s) 1 Course fee revenue 704 2 Student fees (for capital) (1,491) 3 Capital grants (3,579) 4 Research, including fellowships 12,222 5 Amortization of deferred capital contributions 9,976 6 Endowment and Trust Spending 4,681 7 Proceeds of asset sales (6,794) Total revenue adjustments 15,719 1 Course fee spending (704) 4 Research spending –personnel (3,243) 4 Research spending –operating costs (8,979) 5 Amortization of capital assets (33,278) 6 Endowment & Trust Spending (4,681) 8 Principal payments 2,908 9 Capital purchases in operating 1,640 10 Capital and infrastructure project reserves spending – personnel (357) 10 Capital and infrastructure project reserves spending – operating (2,644) 11 Post-retirement benefits (279) 12 Pension 534 13 Spending in strategic funds (1,396) Total costs adjustments (50,479)
($000s) 2023-24 NFPS budget 2023-24 Funding forecast NFPS adjustments Note Eliminate inter-fund transfers Eliminate internal chargebacks 2023-24 NFPS forecast Revenue Student fees 193,820 188,706 (787) 1-2 187,919 Grant revenue 101,401 102,951 (3,579) 3 99,372 Internal Chargebacks 11,685 (11,685) Inter-fund revenue 12,605 (12,605) Research revenue 12,222 12,222 4 12,222 Other revenue 73,863 66,850 7,863 5-7 74,713 Total revenue 381,306 382,797 15,719 (12,605) (11,685) 374,226 Personnel costs (258,679) (255,334) (3,345) 4, 10-12 (258,679) Inter-fund expenses (29,879) (1,643) 4,6 31,522 Operating costs (141,055) (108,724) (45,491) 1,4-6, 8-10, 13 11,685 (142,530) Total costs (399,734) (393,937) (50,479) 31,522 11,685 (401,209) Funding surplus/ (deficit) before mitigation (18,428) (11,140) (34,760) 18,917 - (26,983) Mitigation target 3,988 11,140 11,140 Funding surplus/ (deficit) after mitigation (14,440) - (34,760) 18,917 - (15,843)
Figure 21

Reserves
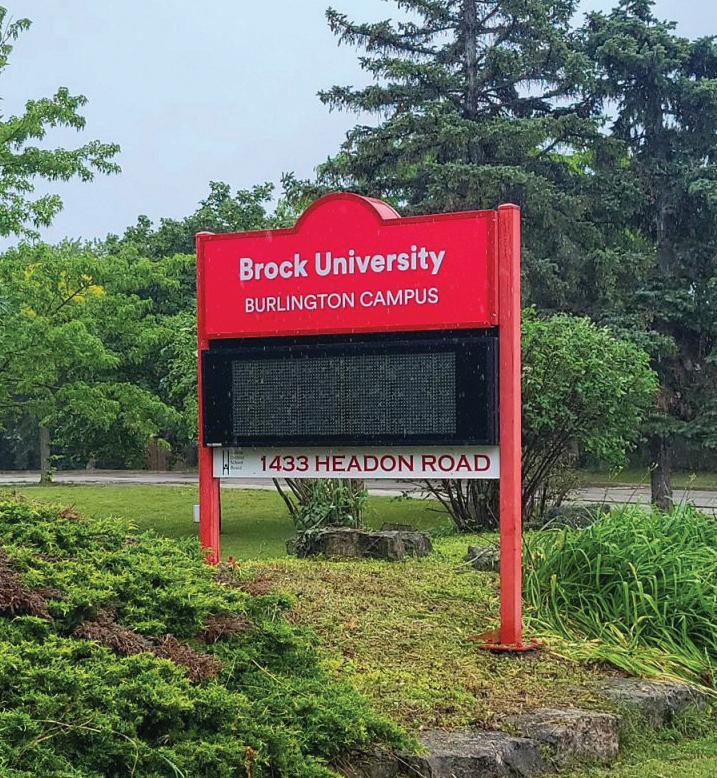

Figure 23 outlines internally restricted reserve balances that have been established for strategic priorities. As at Aug. 31, 2023, Brock has $42.8 million in unspent research, professional development and strategic fund support dollars for faculty and other units including the President, Provost and Vice-President, Academic, Vice-President, Research, Vice-President, Administration and Faculty Deans. This amount compares to $39.9 million available in the same accounts at this time last year.


2023-24 Trimester 1 Report 17
JULY 21, 2023: Associate Dean of Research and Graduate Programs and Goodman School of Business Associate Professor Narongsak (Tek) Thongpapanl (left) and Anna Guo, Associate Director of International Student Recruitment (right) participated in a Brock partner appreciation event during a recruitment trip in Vietnam.
JULY 26, 2023: Brock faculty and staff are settling into the University’s interim Burlington Campus. The former Lester B. Pearson High School at 1433 Headon Rd.
($000s) Operating project accounts Research funds with no external obligations Start-up funds PER and accountable allowance accounts Strategic fund (1) Total Faculty of Applied Health Sciences 227 1,528 1,956 1,045 600 5,356 Faculty of Education 128 150 202 615 176 1,271 Faculty of Humanities 220 129 92 651 131 1,223 Faculty of Mathematics and Science 480 1,024 1,990 854 872 5,220 Faculty of Social Sciences 693 1,030 724 1,433 1,183 5,063 Goodman School of Business 871 105 40 744 1,509 3,269 Library 1 123 124 Other units 1,291 1,089 64 18,839 21,283 Total 3,910 5,056 5,004 5,529 23,310 42,809 (1) Allocated through the revenue and expense allocation model.
Figure 23: Balances by Faculty as of Aug. 31, 2023
Appendix 1
Multi-year financial results on a funding basis


AUGUST 21, 2023: Brock research challenges the traditional use of silicon in solar panels with a new more affordable material. AUGUST 24, 2023: Brock
its first Associate Vice-President, Equity, Diversity and Inclusion. 18 2023-24 Trimester 1 Report A CLOSER LOOK Figure 24 ($000s) 2023-24 Forecast 2023-24 Budget 2022-23 Actual 2021-22 Actual 2020-21 Actual Revenue Student fees 188,706 194,607 187,658 188,064 186,012 Grant revenue 102,951 105,254 102,306 99,780 106,724 Internal chargebacks 11,685 11,697 11,605 7,346 3,098 Inter-fund revenue 12,605 12,605 7,785 5,943 8,843 Other revenue 66,850 65,786 63,702 50,256 24,319 Total revenue 382,797 389,949 373,056 351,389 328,996 Operating costs Personnel costs (255,334) (255,334) (234,390) (221,304) (214,657) Inter-fund expenses (29,879) (29,879) (27,225) (28,926) (18,143) Other operating costs (108,724) (108,724) (107,403) (97,262) (83,302) Total operating costs (393,937) (393,937) (369,018) (347,492) (316,102) Forecasted revenue shortfall mitigation 7,152 Mitigation target 3,988 3,988 Funding surplus/(deficit) before discretionary appropriations - - 4,038 3,897 12,894 Discretionary appropriations (4,037) (3,896) (12,885) Funding surplus/(deficit) after discretionary appropriations - - 1 1 9
has appointed Chelsea Takalo as
AUGUST 30, 2023 : Anthropocene research among Brock projects to receive $965,000 in SSHRC funding
In photo: New federally funded research by Brock University Professor of Philosophy Christine Daigle will focus on interpreting layers of sediment in Halton’s Crawford Lake.
Also included in the Aug. 29 announcement was other federal government funding for Brock, including:
• a $2.5-million SSHRC Partnership Grant
• the renewal of Associate Professor of Psychology Karen Campbell’s Canada Research Chair in Cognitive Neuroscience of Aging.
• $4.8 million in funding from the Natural Sciences and Engineering Research Council’s Discover/Explore program
• $295,000 for research infrastructure under the Canada Foundation for Innovation’s John R. Evans Leaders Fund


Brock University
Niagara Region
1812 Sir Isaac Brock Way St. Catharines, ON L2S 3A1 Canada
905 688 5550
budgetreport@brocku.ca
brocku.ca/finance
Strategic Priorities
Student Experience Community Engagement Inclusivity Research
