Bridget Hale


Who is
Freelance data analyst based in West Palm Beach, Florida with nearly twenty years of experience in the hospitality industry. Data Analysis & Culinarian graduate, quick on my feet, passionate team player & leader, have managed several teams to success. Aspire to apply my analytical skills to the food & beverage industry to better assist businesses in making the right datadriven & most profitable decisions.

Avocado Pricing Analysis
Excel-based project of Marketing analysis for a global video gaming company

Prepping for Flu
Season
Advanced Analytical Dashboard with Tableau & Python

GameCo
Tableau analysis for Medical staffing distribution based on historical trends In the U.S.
SQL business analysis for online movie rental service
Rockbuster Stealth LLC
Instacart
Grocery Basket Analysis
Python project on customer habits & targeted marketing


OBJECTIVE

AN IN-DEPTH EXPLORATORY ANALYSIS OF INSTACART’S SALES
TRENDS & CUSTOMER
HABITS TO FURTHER DEVELOP MARKETING & INCREASE REVENUE
DATA


CUSTOMER DATASET EXCEL DATA REPORT
INSTACART DATASET

LIMITATIONS
DATA RECORDS CEASED AFTER 2017
CUSTOMER DATA IS RESTRICTED TO ONLY GENERAL DEMOGRAPHICS SUCH AS AGE, INCOME, NUMBER IN HOUSEHOLD & MARRIAGE STATUS
SKILLS
DATA CLEANING, WRANGLING, SUBSETTING & CONSISTENCY CHECKS
MERGING & EXPORTING DATA


AGGREGATING & DERIVING NEW VARIABLES
PYTHON VISUALIZATION & EXCEL REPORT
TOOLS MS EXCEL, PYTHON, ANACONDA, PANDAS, NUMPY, JUPYTER, MATPLOTLIB, SKIPY & SEABORN
CONDITION:
max_order < 5


OBSERVATIONS TO BE REMOVED:
(First name, Last name)
1,440,295 removals
FINAL TOTAL COUNT OF ORDER_PRODUCTS_ALL :

30,964,564 records
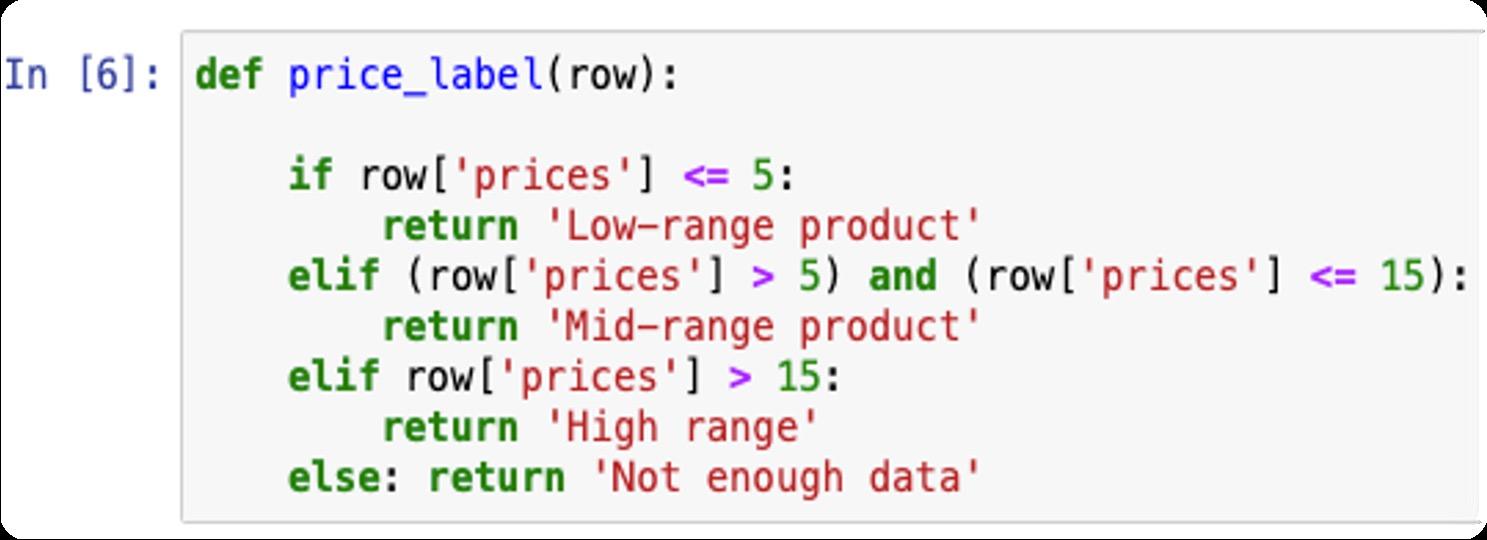
Deriving New Variables


Creating sub-categories of products by price


0 1 2 3 4 5 6 Saturday Sunday Monday Tuesday Wednesday Thursday Friday FREQUENCY IN MILIIONS Distribution of Orders by Day Saturday Sunday Monday Tuesday Wednesday Thursday Friday 0 0.2 0.4 0.6 0.8 1 1.2 1.4 1.6 1.8 2 Midwest Northeast South West FREQUENCY (IN MILLIONS) Distribution of Orders by Day & Region Saturday Sunday Monday Tuesday Wednesday Thursday Friday Creating a histogram for time of order Visualizations created in Python. Analysis offers most profitable day & hour of day. Further analysis shows busiest day for orders by geographical region
Customer shopping habits by department & household income. Customer profiles grouped by geographical regions Crosstabs derived from merged data frames to better correlate relations between variables

Visualizations created with SkiPy, Matplotlib & Seaborn


Advertising: Scheduling advertising during slowest hours & days of the week


Slowest Hours: 3:00 – 6:00 PM Slowest Days: Mon-Thurs
Promotions: Busiest time for orders is during regular hours (10 AM-2 PM) & weekends. Promotions can include BOGOS to lead the user to believe they’re getting a deal


Products: Most popular items are groceries, specifically produce items like dairy & eggs as well as snacks. Ads should focus on nongrocery products to increase lagging sales
Loyalty: Majority of users are regular & new. Implementing loyalty rewards/points could incentivize less frequent users to shop more often

Segmentation: Data demonstrates a difference in customer categories. Ads should target specific demographics such as pet owners & families with babies

Data Analysis
OBJECTIVE
INTERNATIONAL MOVIE RENTAL COMPANY LOOKING TO SEGUE FROM PHYSICAL STORES TO AN ONLINE RENTAL MODEL. ROCKBUSTER HAS CALLED ON THE ANALYSIS TEAM TO HELP LAUNCH THE PROPER COURSE STRATEGY FOR TRANSFERRING PREEXISTING DATA SUCH AS FILMS, CUSTOMERS, EMPLOYEES & REVENUE TO THE NEW ONLINE SYSTEM


DATA

SKILLS
ROCKBUSTER DATABASE


ROCKBUSTER ERD
ROCKBUSTER DATA
DICTIONARY
-USING CRUD OPERATIONS, RELATIONAL DATABASE & AN ENTITY RELATIONSHIP DIAGRAM (ERD) TO SORT, GROUP, AGGREGATE & EXPORT TO EXTRACT & MANIPULATE DATA
-USING ADVANCED QUERIES IN POSTRESQL TO JOIN TABLES
-STORYTELLING WITH DASHBOARDS
TOOLS NAVIGATING THE DATABASE
VISUALIZATIONS:
TABLEAU PUBLIC
LUCIDCHART


MS EXCEL
POSTGRESQL
PRESENTATION: MS POWER POINT
• LucidChart ERD presents relations between tables


• Data Dictionary identifies variables for reader as well as provides source of data type for each variable
Entity Relationship Diagram (ERD) Data Dictionary

Click for entire Data Dictionary


rental duration based off rating
complex subquery to show average amount of money spent by Top 5 renters in the Top 10 Cities Spending Average $105 $0.00 $50.00 $100.00 $150.00 $200.00 $250.00 Valparai Tanza Richmond Hill Memphis Qomsheh Molodetno Apeldoorn Santa Barbara Doeste Cape Coral Saint-Denis TOP 10 CITIES BY SALES Click for PGAdmin
Basic query to yield
More


INVENTORY: Catalog is inconsistent, further analysis needs to be performed to determine new insights & historical patterns of higher revenue inventory so that we may remove obsolete films (such as Texas Watch & Duffel Apocalypse) to onboard more in-demand options


BRANDING: Top categories included Sports, Sci-Fi & Animation. Company needs to have ample streaming options available of these genres on new platform to help initiate sales
MARKETING: Regional sales performed best in India, China, The U.S., Japan & Mexico; Advertising/Marketing team should pursue these areas aggressively as Rockbuster launches their new platform
LOYALTY PROGRAM: There have been loyal customers at the brick & mortar stores, now that the company is merging to an online system, Rockbuster should consider incentivizing a rewards program for roll-over customers


OBJECTIVE EXPLORING & IDENTIFYING
SEASONAL FLU TRENDS IN THE U.S. TO BETTER PREPARE MEDICAL STAFF & HEALTH FACILITIES FOR THE UPCOMING INFLUENZA
SEASON

DATA POPULATION


DATASET DERIVED FROM THE U.S.CENSUS. INFLUENZA DEATH

RATES, LAB TESTS & CLINICAL VISIT
REPORTS PROVIDED BY THE CDC
LIMITATIONS
DATA IS CREDIBLE AS IT WAS OUTSOURCED BY A GOVERNMENT ORGANIZATION (THE CDC) HOWEVER, THE DATA IS OUTDATED AS IT HALTED IN 2017. ALSO WORTH NOTING, DATA IS PREPANDEMIC
SKILLS DATA CLEANING & PROFILING FOR STATISTICAL ANALYSIS.
TIME-SERIES
FORECASTING & INTERACTIVE VISUALIZATIONS PERFORMED FOR DASHBOARD
STORYTELLING
TOOLS MICROSOFT EXCEL VLOOKUP & TABLEAU
Vulnerable population (over 65) develop complications from the flu. The analysis team is tasked with preparing hospitals to adequately aid medical staffing & facilities


January
Vulnerable population represents highest ILI related deaths


Total flu deaths in 2017 by Month & Age Group
Vulnerable age group is over 65 years old; seniors make up over 2/3 of flu deaths


California, New York & Texas top 3 states with highest influenza mortality rates


For full presentation click here


Preparation: Ensure health facilities are equipped with proper medical resources before upcoming flu season
Staffing: Medical staff needed in vulnerable states with highest mortality rates like New York, California & Texas; particularly during Flu season (November-March)
Monitoring: Keep eye on changes in flu outbreaks/deaths post-pandemic. Staffing aid may need to relocate now that Covid-19 has skewed flu outbreaks
Next Steps: Apply new findings to offer better resources for vulnerable patients, such as vaccine information & availability
OBJECTIVE
VIDEO GAME COMPANY
STAKEHOLDERS ARE CALLING ON THE DATA TEAM TO PERFORM DESCRIPTIVE ANALYSIS ON CURRENT & PAST VIDEO GAME SALES BY POPULARITY & REGION IN ORDER TO DEVELOP INSIGHTS FOR LAUNCHING NEW GAMES IN THE MARKET


DATA


SKILLS DATA PROFILING & CLEANING, REMOVING DUPLICATES GROUPING & AGGREGATING IN MS EXCEL PIVOT
TABLES
PRESENTING FINDINGS IN POWERPOINT PRESENTATIONS
TOOLS
MS EXCEL: DATA CLEANING & VISUALIZATIONS

POWERPOINT: STAKEHOLDERS
PRESENTATIONS
Share of Regional Sales in 2006 & 2016


Gaming System Platforms


Trend indicates decreasing sales over past decade across 3 top performing regions

Sales of Consoles by Region
Most popular genres across the top 3 regions include Action, Sports & Shooter games


In 2016 Europe overtook North American sales
2016 Regional Sales


13.7%
22.66%


Top 3 Regions
North American Sales
European Sales
26.76%
Japanese Sales
Budgeting: Capitalize on top selling genres like Action, Sports & Shooter games across most profitable regions


Advertising: Further marketing investigation in Europe to focus on upswing of sells, consider increasing revenue where demand is highest

Growth: Investigate as to why there has been a steep decline in North American & Japanese sales to pursue a bigger reach on customers by way of newer releases

Next Steps: With the consistent decrease in sales, GameCo should consider implementing gaming apps as an answer to slumping sales over past decade

OBJECTIVE THESE DAYS THE AVOCADO IS KING , BUT WHAT DOES THE FUTURE HOLD FOR THIS VERSATILE & IN DEMAND

PRODUCT? IN THIS ANALYSIS WE’LL TAKE A LOOK AT PRICES & DEMAND ACROSS THE US
DATA
Avocado Prices Kaggle
Dataset
Clean Excel Dataset
SKILLS DATA CLEANING, WRANGLING & CONSISTENCY CHECKS.
ADVANCED VISUAL ANALYTICS WITH GEOSPATIAL, CLUSTERING & LINEAR
REGRESSION
ANALYSIS
TOOLS
PYTHON
JUPYTER NOTEBOOK
PANDAS
NUMPY MATPLOTLIB
SEABORN

FOLIUM
Ms EXCEL
TABLEAU PUBLIC
A correlation heatmap showcases through shaded colors the strength of relationships between all variables


Is there a linear relationship between sizes sold by volume?


National Average Price $1.40 per avocado Demand continues to grow!!!
Regional National Average $1.40


Highest Average Priced Regions:

San Francisco $3.25
Tampa $3.17
Miami/Ft. Lauderdale $3.12
Lowest Average Priced Regions:

Cincinnati/Dayton $0.44
Phoenix $0.46

Detroit $0.48
1st line demonstrates the level; where we see data along with its components


2nd line demonstrates the trend; it steadily increases over time 3rd line demonstrates the seasonality. Peaks are observed in summer months and dips in the winter (seasonality will be especially important in this data analysis as the product will have higher availability in certain months compared to others
4th line demonstrates the Resid. Shows consistent pattern throughout the year

Decomposing a time - series into its main components is how we can properly analyze individual factors such as trend & seasonality


When 2 variables show a linear relationship, we can allow for algorithms to perform predictive analysis based on test variables
Advertising: Highest priced avocados are in California & Florida, which also have the largest distribution; thus, people want their avocados regardless of price, marketing team should target their whales & continue to grow their regions
Relationships: According to our analysis, there is a strong positive correlation between total volume & size of avocado sold. Extra large conventional avocados have the highest distribution


Next Steps: Marketing team should focus on mass producing avocados into commercial chains, avocado as toppings, smoothies, side of guac, the demand is there, it just needs to be supplied to the consumer, current & new


PLEASE REACH ME AT THE FOLLOWING: BRIDGETHALE27@GMAIL.COM


BRIHAL4457@YAHOO.COM

