Multiple Sclerosis Depression
Cancer
Alzheimer
Anxiety Parkinson Glaucoma
Autism Epilepsy Farmacannabis-UFRJ:
Chronic Pain
The ďŹ rst laboratory in Brazil to analyze therapeutic products derived from Cannabis July – September 2017 Volume 4 Number 16
BrMASS 2018 7th IBERO-AMERICAN CONFERENCE ON MASS SPECTROMETRY Five days of Conferences. More than 20 Plenary Talks. 50 Invited Guests. Your chance to strengthen your networks and deepen your understanding of Mass Spectrometry - all of this in one of Brazil´s most beautiful landscapes.
SPEAKERS MASS 2018 will feature over 48 speakers from all over the world, exposing their newest and brightest ideas on Mass Spectometry.
PROGRAM A CONFERENCE YOU WON´T SOON FORGET Five days of events, full with meetings & greetings, poster presentations, oral presentations, public performances and much more.
LATEST NEWS KEEP UP TO DATE WITH MASS SPECTROMETRY Get ready for BrMASS 2018! Here you will find the latest news about the topics and researches featured in our Congress
SPONSORS
VisĂŁo Fokka - Comunication Agency
About Br. J. Anal. Chem. The Brazilian Journal of Analytical Chemistry (BrJAC) is a peer-reviewed scientific journal intended for professionals and institutions acting mainly in all branches of analytical chemistry. BrJAC is an open access journal which does not charge authors an article processing fee. Scope BrJAC is dedicated to professionals involved in science, technology and innovation projects in the area of analytical chemistry at universities, research centers and in industry. BrJAC publishes original, unpublished scientific articles and technical notes that are peer reviewed in the double-blind way. In addition, it publishes reviews, interviews, points of view, letters, sponsor reports, and features related to analytical chemistry. Manuscripts submitted for publication in BrJAC, either from universities, research centers, industry or any other public or private institution, cannot have been previously published or be currently submitted for publication in another journal. For manuscript preparation and submission, please see the Guidelines for the Authors section at the end of this edition. When submitting their manuscript for publication, the authors agree that the copyright will become the property of the Brazilian Journal of Analytical Chemistry, if and when accepted for publication. Published by Visão Fokka Communication Agency Publisher Lilian Freitas MTB: 0076693/ SP lilian.freitas@visaofokka.com.br Advertisement Luciene Campos luciene.campos@visaofokka.com.br ISSN 2179-3425 printed www.brjac.com.br
Editorial Assistant Silvana Odete Pisani brjac@brjac.com.br Art Director Adriana Garcia WebMaster Daniel Letieri
ISSN 2179-3433 digital Like BrJAC on Facebook: https://www.facebook.com/brjachem/
BrJAC is covered in the Clarivate Analytics Emerging Sources Citation Index Av. Washington Luiz, 4300 - Bloco G - 43 Campinas - SP - Brazil Zip Code 13042-105
BrJAC is associated to the Brazilian Association of Scientific Editors
+55 (19) 98322-7040 +55 (19) 99817-0405 contato@visaofokka.com.br www.visaofokka.com.br
Editorial Board Editor-in-Chief Lauro Tatsuo Kubota Full Professor / Institute of Chemistry - University of Campinas - Campinas, SP, BR Associate Editors Cristina Maria Schuch R&I Manager / Anal. Chem. Dept. – Res. Center - Rhodia Solvay Group - Paulinia, SP, BR Elcio Cruz de Oliveira Technical Consultant / Technol. Mngmt. - Petrobras Transporte S.A. and Aggregate Professor / Post-graduate Program in Metrology - Pontifical Catholic University, Rio de Janeiro, RJ, BR Fernando Vitorino da Silva Chemistry Laboratory Manager - Nestle Quality Assurance Center - São Paulo, SP, BR Marco Aurélio Zezzi Arruda Full Professor / Institute of Chemistry - University of Campinas - Campinas, SP, BR Pedro Vitoriano Oliveira Full Professor / Institute of Chemistry - University of São Paulo - São Paulo, SP, BR Renato Zanella Full Professor / Dept. of Chemistry - Federal University of Santa Maria - RS, BR Advisory Board Adriano Otávio Maldaner Criminal Expert / Forensic Chemistry Service - National Institute of Criminalistics - Brazilian Federal Police – Brasília, DF, BR Auro Atsushi Tanaka Full Professor / Dept. of Chemistry - Federal University of Maranhão, São Luís, MA, BR Carlos Roberto dos Santos Engineering and Environmental Quality Director / CETESB - Environmental Company of São Paulo State, São Paulo, SP, BR Gisela de Aragão Umbuzeiro Professor / Technology School - University of Campinas - Campinas, SP, BR Isabel Cristina Sales Fontes Jardim Full Professor / Institute of Chemistry, University of Campinas, Campinas, SP, BR Janusz Pawliszyn Professor / Department of Chemistry - University of Waterloo, Ontario, Canada Joaquim de Araújo Nóbrega Full Professor / Dept. of Chemistry - Federal University of São Carlos - São Carlos, SP, BR José Anchieta Gomes Neto Associate Professor / São Paulo State University (UNESP), Institute of Chemistry, Araraquara, SP, BR José Dos Santos Malta Junior Pre-formulation Lab. Manager / EMS / NC Group – Hortolandia, SP, BR Luiz Rogerio M. Silva Quality Assurance Associate Director / EISAI Lab. – São Paulo, SP, BR Márcio das Virgens Rebouças Process & Technology Manager – GranBio Research Center - Campinas, SP, BR Marcos Nogueira Eberlin Full Professor / Institute of Chemistry - University of Campinas - Campinas, SP, BR Maria das Graças Andrade Korn Full Professor / Institute of Chemistry - Federal University of Bahia - Salvador, BA, BR Ricardo Erthal Santelli Full Professor / Analytical Chemistry - Federal University of Rio de Janeiro, RJ, BR
Br. J. Anal. Chem., 2017, 4 (16)
Contents Editorial The profile of the Analytical Chemist. What is the role? Interview Professor Isabel Cristina, who received some awards such as the 'Unicamp Inventors Award', recently spoke to BrJAC about her work and career Point of View Preformulation optimizing time/resources in the Pharmaceutical Industry
1-1
2-7
8-9
Letter Restricted Access Media (RAM) Columns as a Greener Alternative for Liquid Chromatographic Sample Preparation
10-11
Articles Chlorpropamide Quantification in Pharmaceuticals by Reversed Phase Ultra-Performance Liquid Chromatography and Stress Testing Study
12-23
Microvolume-DLLME for the Spectrophotometric Determination of Clidinium Bromide in Drug, Urine, and Serum
24-35
Potentiometric Sensor Modified with Molecularly Imprinted Polymer for Determination of Ceftriaxone in Human Serum
36-43
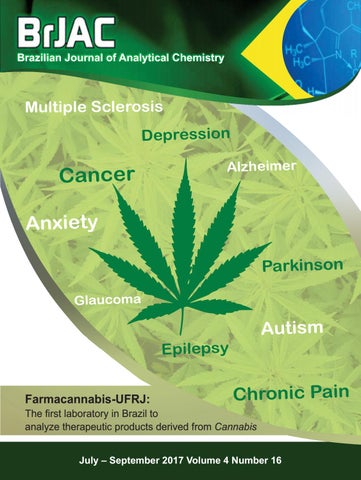
Features Farmacannabis-UFRJ: The first laboratory in Brazil to analyze therapeutic products derived from Cannabis
44-49
Unicamp Institute of Chemistry celebrates 50 years
50-53
The Brazilian Society of Chemistry celebrates 40 years with historical scientific event
54-58
Sponsor Reports Forensic Screening for Drugs in Urine Using High-Resolution MS/MS Spectra and Simplified High-Performance Screening Software
59-68
Sample Preparation and Trace Elemental Determination in Traditional Chinese Medicine
69-72
Preparation of Biological Samples for Trace Metal Analysis
73-75
Purification of Cannabidiol from Cannabis sativa
76-78
Releases Nova Analitica has acquired the Anacom distribution business
79-79
Q Exactive Focus: Hybrid Quadrupole-Orbitrap Mass Spectrometer
81-81
iCAP™ 7400 ICP-OES Analyzer
83-83
ETHOS UP and MILESTONE CONNECT: High Performance Microwave Digestion Systems
85-85
Accelerate the pace of your research
87-87
Notices of Books
88-89
Periodicals & Websites
90-90
Events
91-92
Author's Guidelines
93-96
Br. J. Anal. Chem., 2017, 4 (16), pp 1-1
Editorial
Download
The profile of the Analytical Chemist. What is the role? Cristina Maria Schuch, PhD Analytical & Physical-Chemistry Manager Rhodia Solvay Group cristina.schuch@solvay.com Analytical Chemistry has significantly improved the complexity of its instruments, thus creating a comprehensive way to see deep inside the chemical and physical composition of a sample. Understanding the structure of atoms and molecules is an art which involves human and technical aspects. From the technical point of view - instrumental, data processing, hyphenation, use of sensors, high throughput experiments, on line analysis - there is no doubt that Analytical Chemistry is one of the most interesting fields of knowledge today. By the influence of the suppliers or market needs - such as robustness, quick response, big data processing - and other factors, the number of articles has increased the contribution of Analytical Chemistry to Science. And about the Human factor? What is the profile required for one analyst today? How to sustain the motivation of the professionals working in this area? Analytical Chemistry is spread throughout companies, universities and research centers in different segments (chemical and others). It can be found in Health, Feed, Food, Agro, Aerospace, Automotive, Energy, Consumer Goods, Electrical, Electronic, Environmental, Chemical, Petrochemical, Pharmaceutical, Academics, Governmental - every place, everywhere. The basic question is how to recognize the attributes required for an analyst and how to foster them. A good approach is to invest in modern instruments. However, that is not enough. It is also necessary to invest in continuous technical education, showing the analyst the value of developing new ways to do the same, thus improving the quality, the time, the productivity or simplifying a process. Statistical thinking is also an important skill to be honed, since it gives better basis to evaluate results. Another approach is the training achieved by analyzing new products or different samples using known methodologies. In this mindset, the analyst needs to challenge his or her own results every time, using two strategies: checking with different methodologies or using the results obtained by another professional. However, how is the training necessary to understand if the analytical result is correct and what is the impact of the incorrect result on the company? In the structure of Analytical Control Department the productivity and performance of the team contribute directly to the success of the Business. In the Research & Innovation Centers the impact of an analytical result can define the strategy of a company, the success of the project or a new business opportunity, among others. Analytical Chemistry is a complex interface where the equilibrium between technical state-of-the-art and the Human factor of the analyst, who must be able to deeply understand the composition of the sample and to search for the best and most efficient results, promote a success career for the chemists fit to pursue these goals. A balanced people management and the recognition from the Organizations toward these professionals - best conveyed in the provision of modern and efficient work conditions and continuous training - are, therefore, of utmost importance.
1
Br. J. Anal. Chem., 2017, 4 (16), pp 2-7
Interview
Download
Professor Isabel Jardim, who received some awards such as the 'Unicamp Inventors Award', recently spoke to BrJAC about her work and career Isabel Cristina Sales Fontes Jardim Full Professor at the Institute of Chemistry, University of Campinas (Unicamp), Campinas, SP, BR icsfj@iqm.unicamp.br Prof. Isabel Jardim choose chemistry for her life and, among all the areas, she opted for Analytical Chemistry and then specialized in Chromatography. Isabel has a bachelor's degree in Chemistry (1976) and a Doctorate in Chemistry (1983), both from the State University of Campinas (Unicamp) and has developed various research projects during her career. Isabel is now a full professor at Unicamp and a Research Productivity Fellow of the National Council for Scientific and Technological Development (CNPq) at the PQ-2 level. She also belongs to the editorial advisory board of Scientia Chromatographica and was a member of the Nacional Institute for Advanced Analytical Science and Technology (INCTAA). She retired on 01/04/2017 and continues at IQ/Unicamp as a volunteer researcher. In this scenario, she has supervised master´s and doctoral students and post-doctoral researchers, lectured, acted as an ad hoc advisor to support agencies, such as the Foundation for Support of Research of São Paulo State (FAPESP) and CNPq and as a reviewer for several journals. In addition, she has participated in qualification exams and on the examining boards of master´s dissertations, doctoral theses and other examining boards. Her experience is in the area of Analytical Chemistry, with emphasis on Separations, acting in the following lines of research: preparation of stationary phases for high performance liquid chromatography (HPLC), preparation of sorbents for solid phase extraction, sample preparation and analysis of multiresidues of pesticides in various types of matrices, and of pharmaceuticals, using HPLC, ultra high performance liquid chromatography (UHPLC), or ultra high performance supercritical fluid chromatography (UHPSFC) coupled to detectors using diode-array variable wave length ultraviolet-visible absorption or tandem mass spectrometry. In 2010, she was awarded the Zeferino Vaz Academic Recognition Award, in 2013, the Unicamp Inventors Award in the "Patents Granted" category for the technology "Processes for obtaining stationary phases for high efficiency liquid chromatography based on polysiloxanes adsorbed and immobilized on the porous silica surface", and, in 2016, with the Unicamp Inventors Award in the "Patents Granted" category for "New stationary phases for liquid chromatography containing urea-type polar groups inserted into the N-alkyl chain for separation and purification of basic compounds". She has supervised 72 researchers in the area of chromatography and has been active in the three pillars that support the University: Teaching, Research and Extension.
2
Interview What was the beginning of your career? How did you become interested in Chromatography? I started my post-graduate studies at Unicamp in 1977, shortly after graduating with a bachelor's degree in chemistry, entering the master's program under the supervision of Prof. Dr. Carol H. Collins, a competent, dynamic researcher and a living example of how knowledge and humility can and should walk together. My research project was in the area of radiochemistry, in which I later oriented a scientific initiation project about Radon, which aroused the interest of the population and the communication networks, as we did measurements in homes and offices for the presence of radon, a carcinogen gas that is emitted from structures made of concrete, constituting an imperceptible danger in the air. At this time, I gave several interviews for newspapers, magazines and television. “My research project was in the area of The development of my masters´ research presented radiochemistry, in which I later oriented a so many novelties that it was transformed into a direct scientific initiation project about Radon, doctorate, that I defended in 1983, with the title of which aroused the interest of the population "Obtaining radionuclides from irradiated and the communication networks, as we did metalophthalocyanines". My professional career began measurements in homes and offices for the in August of 1981, when two vacancies appeared in the presence of radon, a carcinogen gas that is Department of Analytical Chemistry of IQ/Unicamp. At emitted from structures made of concrete, this time, there were no competitions, students who constituting an imperceptible danger in the had the best school records were invited to an interview air.” with the director, Dr. Wallace Alves de Oliveira. Although his thoughts at the time were to avoid hiring females, I got one of the vacancies and became a professor of the Department of Analytical Chemistry. After completing my doctorate, I decided to direct my research to a different area of my training, my supervisor, Dr. Carol H. Collins suggested that, since high performance liquid chromatography was in full expansion with many challenges to be overcome and, since I had gained experience in classical liquid chromatography during the direct doctorate, I decided to face one of them and began my line of research on the preparation of stationary phases for liquid chromatography, since those available for purchase were imported, expensive and difficult to acquire. This was only possible thanks to the donation of a liquid chromatograph for my use by Dr. Carol Collins in agreement with her husband, Dr. Kenneth E. Collins, my supportive and eternal master. One of the most relevant developments in my initial research project was that, in the light of the results obtained by one of my first master´s students, the Collins´ were so fascinated by the potential of this work that they also entered this same line of research. With this, we formed a very engaged and productive group and renamed the laboratory we shared as the Liquid Chromatography Research Laboratory (LabCrom). What are your lines of research? What projects are you currently working on? The first line of research I established at the IQ/Unicamp was on the preparation of stationary phases for liquid chromatography. With the great experience gained in the preparation of stationary phases, I started another line of research on the preparation of sorbents for solid phase extraction, a technique used in the preparation of samples, in order to introduce sorbents with characteristics different from those of polymethyloctadecylsiloxane, C18, which are often used and extensively marketed. In these extremely fascinating lines of research I have published a number of papers, written several book chapters, lectured, trained numerous master´s, doctorate and undergraduate students, and supervised postdoctorate researchers. I have registered three patent applications that have been granted. Together with the Collins´, we were awarded three Thematic Projects from FAPESP, which provided the financial support for the development of research in our group. Some time later, one of my undergraduate researchers wanted to do her master´s under my guidance, but wanted to work with more applied chromatography. Looking at the current scene, we observed that overuse of pesticides was becoming an imminent danger due to environmental contamination and, thus, food insecurity and that there was an urgent need for efficient
3
Interview and rapid methods to detect, identify and quantify them. Thus, my third line of research was about on the development and validation of chromatographic methods for the determination of pesticides in different types of matrices, such as water, soil, fruits, vegetables and biological fluids, which was also extended for the determination of impurities or degradation products in drugs, which is one of the major challenges faced by pharmaceutical industries. At the outset, we used high performance liquid chromatography with UV or diode-array detectors. However, following the evolution of HPLC, we felt the need to acquire a tandem mass spectrometry detector to determine low concentrations of compounds of interest present in complex matrices, such as environmental or biological fluids, with better identity confirmations while requiring less sample preparation. Together with the purchase of this detector, we acquired a system to carry out the latest advancement, Ultra High Performance “Looking at the current scene, we Liquid Chromatography, contributing to more efficient observed that overuse of pesticides was analytical methods, faster and with less consumption of becoming an imminent danger due to organic solvent, thus meeting the principles of Green environmental contamination and, thus, Chemistry. The search for improvement always accompanied food insecurity and that there was an my professional career, so that, when the resurgence of urgent need for efficient and rapid Supercritical Fluid Chromatography, now called Ultra High methods to detect, identify and quantify Performance Supercritical Fluid Chromatography (UHPSFC), them.” occurred with the launch, in 2012 by Waters, of the convergence chromatograph (UPC2), Labcrom was the first laboratory in Brazil to acquire this equipment. This system was named for uniting the high efficiency of gas chromatography with the high versatility of liquid chromatography by allowing the analysis of compounds with a wide range of polarities. This technique uses as a mobile phase a supercritical fluid, with CO2 being the most used because of its advantages of being an inert, non-toxic gas with moderate values of pressure and critical temperature (72.9 atm and 31.3 °C), which reduces instrumental heating and allows analyses of thermally unstable compounds, with easy polarity modification when combined with a small percentage of organic solvent (typically 5-25%). Due to the reduced amount of organic solvent in the mobile phase and the short time of analysis, this technique presents low generation of residues and is, therefore, in accordance with the concepts of Green Chemistry. Because it allows for a large variation in selectivity, the technique has demonstrated potential for the analysis of a wide variety of compounds. Currently, we are using UHPSFC to develop another line of research based on the analysis of pesticides and pharmaceuticals, while research on the preparation of stationary and sorbent phases as well as the development and validation of methods for the determination of pesticides in soils by UHPLC-MS/MS continue. Do you keep informed about the progress of chemistry research? What is your opinion about the current progress of research in chemistry in Brazil? What are the latest advances and challenges in Chromatography? A researcher is obliged to follow the progress of research in chemistry and, especially, in his field of activity. Chemistry in Brazil is very well developed and has excellent research groups in all areas with significant international prominence. In liquid chromatography, new stationary phases have been prepared to meet the demands of analyses of more polar compounds, with greater efficiency and selectivity, due to the reduction of the particle size and to the appearance of new types of stationary phases such as phenyl, fluorinated, with an embedded polar group and those for hydrophilic interaction chromatography (HILIC). My research group has contributed with research on all these types of stationary phases, the so-called modern stationary phases. Ultra high-performance liquid chromatography can already be considered well established and has contributed to efficient, fast, and cost-effective methods for analysis in a wide range of sectors. I consider the current challenges of chromatography as a better understanding of the numerous experimental parameters that affect ultra high performance supercritical fluid chromatography, so that it can become an established and useful technique and thus enjoy all its advantages: much faster and more economical analytical methods; the use of environmentally more sustainable mobile phases, such as carbon dioxide; and the generation of less residue, due to the use of reduced amounts of organic solvents, 4
Interview
“I consider the current challenges of chromatography as a better understanding of the numerous experimental parameters that affect ultra high performance supercritical fluid chromatography, so that it can become…”
making it an environmentally friendly technique. Another major challenge lies in the hyphenation and miniaturization of liquid chromatography, making possible faster and safer analyzes. Also, another major challenge is to overcome obstacles and implant the use of capillary columns instead of packed columns in liquid chromatography. These have been fully established in Gas Chromatography for many years. GC introduced capillary columns in the late 70´s.
For you what have been the most important achievements in the world of analytical research recently? What were the landmarks? Thinking in terms of Liquid Chromatography, we have moved from classical liquid chromatography employing glass columns of large internal diameters, often greater than 10 mm, filled with stationary phases with particle sizes of 150 to 200 micrometers, which could analyze only simple mixtures and required long analysis times, hours to days, to modern liquid chromatography using metal columns with internal diameters smaller than 5 mm packed with particles smaller than 5 micrometers, which result in a considerable gain in chromatographic efficiency and resolution, permit analysis of complex samples in reduced analysis time, a few minutes. This represents a great leap in the field of separations. Another mark occurred in 2004, when Ultra High Performance Liquid Chromatography appeared, which uses very high pressures, from 9000 to 15000 psi, shorter columns with small internal diameters packed with particles of sizes smaller than 2.0 micrometers. This has allowed analyses of complex samples containing a large number of compounds to be carried out in a few minutes with good detectability, reduced organic solvent expenditure and smaller sample volumes, which is very convenient for biological fluid analyses, which require use of reduced sample volumes. Another mark is Ultra High Performance Supercritical Fluid Chromatography (UHPSFC), which emerged in 2012 with the launch, by Waters, of the Ultra Performance Convergence Chromatography system. It is considered a technique of high powered resolution, which meets the concepts of Green Chemistry, and is much faster than the other techniques cited. However, to take advantage of all that this new technique also presents many challenges that must be overcome, because there are many experimental variables that are closely related, such as temperature, pressure, percent and type of organic modifier, and these determine the density of the fluid, a key factor that controls retention and, consequently, separation. Therefore, it is necessary to understand the mechanism of action of each of these variables to program their optimizations. Due to the interactions between these variables, it is interesting to use methods of planning and experimental optimization in the development of the chromatographic method. The use of Chemometrics is of vital importance, because with a minimum of experiments, it is possible to construct response surfaces and obtain relevant informations on the separation of the compounds, saving time and reagents. This confirming that interdisciplinarity in current research is essential. Accompanying the instrumental evolution, new types of stationary phases were introduced, allowing greater chromatographic efficiency, resolution, selectivity, reproducibility and shorter analysis time. There are in Brazil and in the world several Chromatography Congresses. To you, how important are these for the area? How do you see the development of the national Chromatography meetings in Brazil? Congresses and scientific meetings are of great importance in order to have knowledge of the latest advances in the field, both in academic studies and in instrumentation, and also to have conversations with renowned researchers in different areas, which allows for exchanges of ideas, clarification of doubts and establishment of exchanges. The most relevant international congress for liquid chromatography is the International Symposium on High Performance Liquid Phase Separations and Related Techniques (HPLC), held annually, alternating between the United States and Europe. Perhaps soon it could be held in Brazil. Dr. Fernando Mauro Lanças of USP/SCar implemented the Latin American Congress of Chromatography 5
Interview (COLACRO), which takes place every two years, and has established itself as the most important forum for discussion of chromatography and related techniques in Latin America and is one of the congresses great longevity in all the world, having 31 years of existence. Currently, you are a full professor in the Department of Analytical Chemistry at the State University of Campinas (Unicamp). Besides this, what else are you involved in? How many scientific papers have you published? Would you highlight any? During my professional life, 36 years, I dedicated myself to being professor in the Department of Analytical Chemistry of the State University of Campinas, transiting between the pillars that support the university: teaching, research and extension. The teaching provided a complete realization, because my eagerness to transmit my knowledge is great and the satisfaction of seeing smiles on the faces of the students as they understand the subject being taught is immeasurable. I always put the mission of teaching in the foreground, so that good professionals could be formed and sent into the market. Research is challenging and when you achieve the goals outlined, registered through dissertations, theses, lectures and published articles, you enjoy happiness without limits. It is the certainty that you have contributed to a better understanding in a field of knowledge and having trained human resources. In extension, I worked on several commissions such as the undergraduate, postgraduate, extension commissions, as well as several others. I was head of the Department of Analytical Chemistry for two consecutive periods, which brought me great satisfaction and I believe this collaborated to unite the members and resulted in the good progress made by the department. I have published 93 scientific articles and would highlight the revision that had as its objective to discuss the main aspects of validation in chromatographic and electrophoretic studies, showing the differences and similarities between the guidelines established by the different international regulatory agencies and those in Brazil. This was published in Química Nova, vol. 27, no. 5, 771-780, 2004, and is entitled: "Validation in chromatographic and electrophoretic methods", by M. Ribani; C. B. G. Bottoli; C. H. Collins; I. C. S. F. Jardim and L. F. C. Melo. This review has to date received 494 citations, according to Scopus, and is one of the most cited articles published in Química Nova. You have also received some awards, such as the 'Unicamp Inventors Award'. What is it like to receive this recognition? What is the importance of these awards in the development of new technologies? The Inventors Awards were received due to the granted patents. This is a difficult process, analyzed very rigorously, and the approval proves the innovation of developed process. It is extremely gratifying, as all efforts, studies and dedication are rewarded. The importance of these awards lies in the fact that it has been proven that new technologies have been developed that have increased the knowledge of the related research area. Our group has introduced stationary phases for reversed phase chromatography of different polarities and selectivities such as the polyoctylsiloxane phases, phenyl phases, fluorinated phases and phases with an embedded polar group, such as the urea group, not previously studied. This last stationary phase I consider to be one of the most promising ones for analysis of basic compounds, like the pharmaceuticals, as they result in symmetrical peaks, good resolutions and can be used with high percentages of water in the mobile phase without collapsing. At the moment, a doctorate student has prepared a perfluorinated stationary phase with an embedded polar group that is showing characteristics suitable for use hydrophilic interaction liquid chromatography (HILIC), also constituting an innovative technology. Another award that honored me greatly and brought immense pride to the work I have developed in my scientific career was the Zeferino Vaz Academic Recognition Award, received in 2010, when I competed with two other professors from the Institute of Chemistry and was the one selected. Actually, it was an acknowledgment of my dedication to my profession, always with great seriousness. However, I did not build my professional career alone, I counted on the support of several people, such as the Collins couple and my students, 25 undergraduate research students, 22 master´s, 20 doctors and 5 post doctorates, who have always helped me in updating the literature and by their dedication to the development of their research, which has allowed me to reach the top of my scientific career, as a full 6
Interview professor, and to become a productive researcher. To all of them I will be eternally grateful and acknowledge their importance in my life. One fact that I felt very proud of in my career is that, although I have always advised my undergraduate and graduate students to change their supervisors, once they have completed their work, so that they could expand their knowledge in a variety of areas, most of them opted to continue under my guidance. More importantly, the great “I did not build my professional majority of the students that I supervised continue to work in the career alone, I counted on the area of chromatography. Some have followed an academic career support of several people, such and work in several Brazilian universities, in different states, as well as the Collins couple and my as here at Unicamp, or work in research centers, at the interal students … To all of them I will revenue service or in industries and, to this day, we maintain be eternally grateful and contact and we have strong ties of friendship. It is the certainty that acknowledge their importance in I left a legacy, because today my students are putting into practice my life.” and transmitting the lessons learned. The Institute of Chemistry completes 50 years this year. What is it like to be part of this story? I went to Unicamp to study Chemistry, my first option in the university entrance exam, in 1973, therefore, 44 years ago, when IQ was 7 years old. Therefore, I have essentially followed the evolution of IQ and I am part of its history. More relevant is the certainty of having contributed to the development of chemistry in the Institute itself and as well as at the national and international level and to be one of those responsible for the high levels achieved by this renowned Institute in the world. I can say with great pride, without modesty, that I helped build IQ/Unicamp, which currently occupies the first position among the 195 Brazilian universities evaluated in the 2017 University Ranking of the Folha (RUF). What would you say to a chemistry course freshman? Study hard, work intensely, with professional ethics, know how to respect everyone, be aware that there are hierarchies, have humility and, most importantly, enjoy what you do. Do make your work with awareness and pride. Then success will be a consequence of your good principles. Always remember that the great achievements of life are not achieved in one day, but day by day with love, courage and perseverance. Today, I say with great satisfaction that my professional career has given me many joys and achievements. The decision to retire has not been easy, it has taken time to happen, but I think we have reached a moment in life that we must be aware that the new researchers have a lot of potential, and we must withdraw, but I also know that my years of experience are worth a lot, so whenever I can I shall continue to give my contribution in whatever I am asked to do.
7
Br. J. Anal. Chem., 2017, 4 (16), pp 8-9
Point of View
Download
Preformulation optimizing time/resources in the Pharmaceutical Industry Renan Marcel Bonilha Dezena Preformulation Specialist Althaia/Equaliv Pharmaceutical Industry renan_marcel@hotmail.com
The concept of preformulation emerged in the late 1950s and early 1960s as a result of a change on the emphasis on the development of industrial pharmaceuticals [1,2]. Much more than an investigation of the physico-chemical, physico-mechanical and biopharmaceutical properties of the drugs, excipients, ďŹ nal formulation and packaging materials we can consider preformulation studies as a time-saving and cost-effective tool for the pharmaceutical industry as shown in Table I. [1,2]. Table I: Evaluation parameters used in preformulation of drug development.
Preformulation Studies
Analytical Techniques/Evaluated property
Assay
HPLC (High Performance Liquid Chromatography)
Raw material impurities
ATR-FTIR (Attenuated Total Reflection with Fourier-Transform Infrared Spectroscopy) DSC (Differential Scanning Calorimetry) NMR (Nuclear Magnetic Resonance) LC-MS/MS (Liquid Chromatography Tandem-Mass Spectrometry)
Drug/excipient compatibility
ATR-FTIR (Attenuated Total Reflection with Fourier-Transform Infrared Spectroscopy) DSC (Differential Scanning Calorimetry) HPLC-DAD (High Performance Liquid Chromatography with Detector Diode Array)
Polymorphism
ATR-FTIR (Attenuated Total Reflection with Fourier-Transform Infrared Spectroscopy) DSC (Differential Scanning Calorimetry) Hot Stage Microscopy XPRD (X-Ray Powder Diffraction)
Solubility
HPLC-DAD (High Performance Liquid Chromatography with Detector Diode Array)
Particle size and shape
SEM (Scanning Electron Microscope) Light Microscope Laser Diffraction Particle Size Analyzer
Identification of packaging material
ATR-FTIR (Attenuated Total Reflection with Fourier-Transform Infrared Spectroscopy) TGA (Thermal Gravimetric Analysis)
Formulation stability
TGA (Thermal Gravimetric Analysis) with Decomposition Kinetics Application
Reverse engineering of reference products
NIR (Near Infrared Spectroscopy) Confocal Raman Microscopy
Preformulation studies provide useful information for the establishment of more stable and safe formulations in a shorter period of time, and the company that ďŹ rst launches a generic product soon after the end of the reference product patent gets a higher percentage of the national drug market. Studies of compatibility and degradation kinetics between active and excipients allow the selection of the most stable components avoiding undesirable surprises during stability and shelf-life studies, as well as the reduction of the number of possible candidates for perfect formulations produced.
8
Point of View And in the case of the generic industry, it also enables reverse engineering of the reference products, providing greater know-how, and consequently a considerable reduction of the number of bioequivalence studies and clinical studies. Typically, it takes two years for the evaluation and registration of a new drug to be approved. When evaluating all the necessary studies, such as relative bioavailability and the clinical studies to be carried out, the estimated cost would be approximately R$ 1 million, this without taking into consideration all the necessary taxes in regulatory terms and costs with research and development, until ďŹ nally obtaining a bioequivalent formulation to the reference product. [3]. Time and costs are obstacles to be faced even more at this time. Therefore, preformulation studies, more than any other sector within the pharmaceutical industry organization chart, has become an extremely interesting protagonist and ally in the optimization of resources and time, in addition to contributing to ďŹ nancial growth and strategic vision.
Point of View
REFERENCES 1. Desu, P. K.; Vaishnavi, G.; Divya, K.; Lakshmi, U. Indo Am. J. Pharm. Sci., 2015, 2 (10), pp 13991407. 2. Chaurasia, G. Int. J. Pharm. Sci. Res., 2016, 7 (6), pp 2313-2320. 3. http://www.ictq.com.br/industria-farmaceutica/451-o-custo-da-regulacao-para-a-industria-demedicamentos [Accessed 07 July 2017].
9
Br. J. Anal. Chem., 2017, 4 (16), pp 10-11
Letter
Download
Restricted Access Media (RAM) Columns as a Greener Alternative for Liquid Chromatographic Sample Preparation Regina Vincenzi Oliveira Associate Professor / Chemistry Department Federal University of São Carlos, SP, BR Separare – Núcleo de Pesquisa em Cromatografia (www.separare.ufscar.br) oliveirarv@ufscar.br
Quezia Bezerra Cass Full Professor / Chemistry Department Federal University of São Carlos, SP, BR Separare – Núcleo de Pesquisa em Cromatografia (www.separare.ufscar.br) quezia@pq.cnpq.br
The efforts for miniaturization, automation, high-throughput performance, cost-effectiveness through low or no solvent consumption for sample treatment have never been discontinued, aiming to obtain new technologies that are considered to offer better alternatives for sample analysis, and overcome the disadvantages of the traditional offline procedures. An attractive alternative is the use of restricted access media (RAM) phases for the direct analysis of samples. RAM columns promote removal of macromolecules in complex matrices by size exclusion principle, while small molecules are retained by hydrophobic, ion exchange or affinity interactions. This technique was introduced in 1985 by Hagestam and Pirkenton and offers various advantages when compared to conventional liquid-liquid and solid-phase extractions. Because the sample can be directly injected onto chromatographic systems without previous treatment, it integrates sampling, extraction, enrichment and injection into one single step. Therefore, the sample preparation becomes simpler, faster and very efficient for sample cleanup, promoting a reduction of organic solvents consumption as well as generation of solid waste, making it a more environmentally friendly technique for sample preparation. Additionally, there is a material resource saving resulted from the reduced sample volume and modernized sample processing when compared to traditional SPE sorbents, even as this later are operated at online procedures. Online use of RAM columns is always in the automated format and offers the advantage of less manipulation of potentially infectious samples and multi-step procedures, which may be prone to analyte losses. The use of environmentally friendly solvents is not always feasible, mainly when complex matrices are extracted for analysis. In these cases, miniaturization of the extraction system is required. Therefore, capillary RAM columns can be used in miniaturized systems, enhancing sensitivity for lowlevel determination and diminishing the generation of hazardous waste. Due to lower selectivity, RAM columns are usually used in a 2D LC-LC configuration. Their use in single mode, as extraction and analytical column, is less common, but has become feasible when used in LCMS systems.
10
Letter Several types of RAM materials have been developed, including bovine serum albumin (BSA), alkyl-diol silica (ADS), molecularly imprinted polymers (MPIs), ion exchange (IEX), etc. All RAM phases are suitable for analysis of biofluids, food and environmental samples. Thus, a number of applications can be found in the literature covering drug monitoring, pharmacology studies, forensic, toxicological analysis, and drug metabolism. According to their protein exclusion mechanism, in 1997, Boos and Rudolphi classified the different types of RAM columns. Despite the expressive number of works dealing with the use of RAM materials for sample preparation, it is still reduced the number of papers discussing the low consumption of organic solvents and the environmentally friendly characteristics of this technique. Nevertheless, no sample preparation technique can be perfect in all aspects of analytical chemistry. Methods involving online extraction require more initial experimental work, more complex LC systems and also high-skilled professionals. Therefore, some may argue that these aforementioned considerations are the bottleneck for the widespread of this technique regarding its use as sample preparation in a routine analytical laboratory. Additionally, when it comes to high throughput analysis, RAM columns may show some limitations due to the total analysis time (>10-20 min), which may be considered long for some applications. Nonetheless, since the sample cleanup is encompassed into the chromatographic run, the total analysis time is usually shorter when compared to other sample preparation approaches. It should also be said that while tailored made RAM sorbents have been developed and capillary columns have been produced, no commercial RAM columns with 2.1 mm i.d. are available for the ultraefficient LC systems for efficient coupling with totally porous (< 2 μm) and/or fused-core analytical columns. In summary, with future focus of bioanalysis on high-throughput, reduced volume samples, lower waste production, and trace analysis of complex matrices, it is clear the benefits offered by the use of RAM phases as new perspectives for the development of greener online methods for liquid chromatography analysis.
11
Br. J. Anal. Chem., 2017, 4 (16), pp 12-23
Article
Download
Chlorpropamide Quantification in Pharmaceuticals by Reversed Phase Ultra-Performance Liquid Chromatography and Stress Testing Study Kanakapura Basavaiah1*, Nagaraju Rajendraprasad2 1 Department of Chemistry, University of Mysore, Manasagangothri, Mysuru-570 006, Karnataka, India 2 PG Department of Chemistry, JSS College of Arts, Commerce & Science, B N Road, Mysuru-570 025, Karnataka, India Chlorpropamide (CLP) is an antidiabetic drug belonging to sulphonyl urea derivatives. An ultra performance liquid chromatographic (UPLC) method with UV detection is presented for the determination of CLP in pharmaceutical samples and validated as per the ICH guidelines. The drug was chromatographed on a Zorbax XDB C18 column (50 mm × 2.1 mm; 1.7 µm size) with a mobile phase -1 composed of phosphate buffer of pH 4.8 and methanol (73:27 v/v) at a flow rate of 0.25 mL min . An UVdetector set at 254 nm was used to detect and quantify the analyte in the column effluent. The column temperature was maintained at 30 ºC and the volume injected was 3 µL. Chromatographic conditions such as mobile phase composition, pH and flow rate were carefully studied and optimized so as to obtain a symmetric peak with highest number of theoretical plates. The detector response was linear (r > 0.999) -1 over the concentration range 0.05 – 225 µg mL CLP investigated. The limits of detection (LOD) and quantification (LOQ) were calculated to be 0.006 and 0.02 µg mL-1, respectively. Replicate analyses during the same day and over a period of five days yielded highly accurate and precise values as shown by low values of relative error and relative standard deviation. Chromatograms recorded under slightly altered conditions were not significantly different from those run under optimized conditions with respect to retention time and peak area suggesting robustness of the method. Method ruggedness was also evaluated by inter-equipment and inter-personal assays. Selectivity was confirmed by placebo blank and synthetic mixture analyses. The method was applied to the determination of CLP in tablets with satisfactory results. To evaluate the stability-indicating ability of the proposed method, CLP was subjected to various stress conditions via acid- and base-hydrolysis, oxidation, thermolysis and photolysis, and the drug was found to undergo slight degradation under oxidative stress-condition and remained inert to other stress conditions. Keywords: Chlorpropamide, quantification, UPLC, pharmaceuticals, stability-indicating. INTRODUCTION Chlorpropamide (CLP), chemically known as 4-chloro-N-[(propylamino) carbonyl]benzenesulfonamide (Figure 1), is one of the sulphonylurea derivatives that are used in the treatment of type-2 diabetes mellitus [1]. The drug is known to stimulate pancreatic β- cell insulin production, which results in the reduction of glucose levels in blood. For clinical and bioequivalence studies, CLP has been determined by high-performance liquid chromatography [2-7], gas-liquid chromatography [8-11], liquid chromatographytandem mass spectrometry [12], gas chromatography-mass spectrometry [13], electrospray mass spectrometry [14] and micellar electrokinetic chromatography [15] in body fluids like plasma, serum and urine. The drug is official in United Stated Pharmacopeia [16] which has adopted a chromatographic method for assay. The British Pharmacopeia [17] describes a spectrophotometric method for the determination of CLP in tablets while the European pharmacopeia [18] offers a titrimetric method for the bulk drug. Other than the pharmacopeial methods [16-18] for the determination of CLP in pharmacuticals, few analytical methodologies have been reported and are mainly based on HPLC [19-22], titrimetry [23], 12
*kanakapurabasavaiah@gmail.com ORCID: 0000-0002-5447-0628
Chlorpropamide quantification in pharmaceuticals by reversed phase ultra-performance liquid chromatography and stress testing study
Article
spectrophotometry [24-28], thin layer chromatography [29,30], capillary electrophoresis [31] and coulometry [32].
Figure 1. Structural formula of CLP.
Ultra-performance liquid chromatography (UPLC) is an innovative technique that has brought revolution in liquid chromatography by outperforming conventional HPLC. UPLC decreases sample run times up to a factor of 10, uses up to 90% less solvent offering significant advantages in terms of cost and time per analysis. Literature survey reveals that the lone UPLC-tandem mass spectrometric method is applicable to the determination of MGL in blood plasma as part of bioequivalence study. UPLC with mass spectrometric detection is highly expensive and ordinary laboratories can ill afford such a facility. By contrast, UPLC-UV system is widely used in pharmaceutical analysis [33-42], because of its cost-effectiveness and easy in maintenance. Ultra-performance liquid chromatographic method was employed for determination of six probe metabolites, namely, acetaminophen, 4'-hydroxy-mephenytoin, 4-hydroxy-tolbutamide, dextrorphan, 6hydroxy-chlorzoxazone and 1-hydroxy-midazolam, together with the internal standard chlorpropamide for the in vitro cytochrome P450 activity determination in hepatic microsomes from patients with hepatic impairment [43]. This report does not describe the quantification and stability indicating procedure for CLP. Fachi et al [44] reported an ultra-performance liquid chromatography quadrupole time-of-flight mass spectrometric method for the simultaneous quantification of chlorpropamide, glibenclamide, gliclazide, glimepiride, metformin, nateglinide, pioglitazone, rosiglitazone, and vildagliptin in human plasma using isoniazid and sulfaquinoxaline as internal standards. This procedure is neither applicable for assay of CLP in pharmaceuticals nor describe stability indicating study. The objective of this investigation was, therefore, to develop an UPLC method for the determination of CLP in pharmaceuticals and validate for its reliability and usefulness. In order to see whether the developed method was stability-indicating, as required by the ICH guidelines, drug was subjected to forced degradation by exposing it to various stress conditions like, acid- and base-hydrolysis, oxidation, dry heat and photolysis. The method was found to yield precise and accurate results and also found to be stabilityindicating as shown by the results of stress-testing study. MATERIALS AND METHODS Apparatus and software Chromatographic analysis was performed on a Waters Acquity UPLC™ system (Waters, Manchester, UK) using a Zorbax XDB C18 (50 × 2.1 mm; 1.8 μm particle size; Waters, Manchester, UK) equipped with binary solvent delivery pump, auto sampler and tunable UV (TUV) detector. Materials and reagents Pure CLP (99.9%) was kindly supplied by Deys Medical Stores (Mfg) Ltd, Kolkata, India, as a gift. Tablets containing CLP: Copamide-250 (Deys Medical Stores Ltd. Kolkata, India) and Diabinese-250 (Pfizer Pvt. Ltd. Mumbai, India) were purchased from local market. HPLC grade methanol was purchased from Merck Ltd., India. Potassium dihydrogenorthophosphate and orthophosphoric acid were procured from Qualigens-India. Water purified by the Milli-Q system (Millipore, Milford, MA, USA) was used for mobile phase and other reagent solutions. 13
Basavaiah, K.; Rajendraprasad, N.
Article Hydrochloric acid (HCl, 0.1 M) and hydrogen peroxide (H2O2, 5% v/v) were prepared by appropriate dilution of concentrated acid (Specific gravity 1.18) and commercial sample (30%) with water, respectively. Sodium hydroxide (NaOH, 0.1 M) was prepared by dissolving the required quantity of chemical (S.D. Fine Chem Ltds, Bengaluru, India) in water. Preparation of mobile phase Dissolved 2.05 g of potassium dihydrogenorthophosphate in 1000 mL of water and adjusted the pH to 4.8 using dilute phosphoric acid or triethylamine. This buffer and methanol were mixed in the ratio 73:27 and filtered through 0.22 µm membrane filter. Chromatographic conditions The analytical separation was achieved on a Zorbax XDB C18 (50 mm × 2.1 mm; 1.8 μm particle size). Isocratic elution process was adopted throughout the analysis using a mobile phase composed of phosphate buffer (pH 4.8)-methanol (73:27) which was pumped at a flow rate of 0.25 mL min-1. The UPLC system was operated at 30 ºC and injection volume was 3 µL. The UV detector wavelength was set at 254 nm. Retention time was about 2.7 min and run time was less than 5 min. Standard solution A 500 µg mL-1 stock solution was prepared by dissolving pure CLP in the mobile phase and filtered through 0.22 µm membrane filter. Procedure for bulk drug Preparation of analytical curve -1 Working standard solutions containing 0.05 – 225 µg mL CLP were prepared by suitable dilution of stock solution. Three µl of each standard were injected (three injections) and eluted with the mobile phase under the stated chromatographic conditions. Prepared a graph of average peak area versus concentration of CLP and used as analytical curve. Alternatively, mean peak area-concentration data were used and derived regression equation to compute the concentration of unknown. Procedure for tablets An amount of tablet powder equivalent to 15 mg of CLP was transferred in to 100 mL volumetric flasks and 60 mL of the mobile phase was added. The mixture was sonicated for 20 min to achieve complete dissolution of CLP; the contents were diluted to the mark with mobile phase and then filtered through 0.22 μm nylon membrane filter. The resulting solution (150 μg mL-1 in CLP) was injected in five replicates. Procedure for placebo blank and synthetic mixture A placebo blank of the composition of talc (15 mg), starch (20 mg), lactose (15 mg), sodium alginate (20 mg), calcium gluconate (15 mg) and magnesium stearate (20 mg) was made and its solution prepared as described under “procedure for tablets” by taking about 20 mg. A synthetic mixture was prepared by mixing 15 mg of pure CLP with 10 mg placebo blank and the mixture was homogenized. Its solution was prepared as described under “procedure for tablets” and filtered. Placebo blank and synthetic mixture were chromatographed (n = 5). Procedure for stress study Ten mg of pure CLP was transferred separately into three different 50 mL volumetric flasks and dissolved with 10 mL of mobile phase. Added 5 mL of 0.1M HCl, 0.1M NaOH or 5% H2O2 separately, and the flasks were heated for 2 h in a water bath maintained at 80 °C. Then, the solutions were cooled, neutralized by adding base or acid and the volume in each flask was brought to the mark with mobile phase. An appropriate volume (3 μL) was injected and chromatographed. Solid state thermal degradation was carried out by exposing pure drug to dry heat at 105 °C for 2 h. For photolytic degradation study, pure drug in solid state was exposed to 1.2 million lux hours in a photo stability chamber. The sample after -1 exposure to heat and light was used to prepare 150 μg mL solutions in mobile phase separately, and the chromatographic procedure was followed. 14
Chlorpropamide quantification in pharmaceuticals by reversed phase ultra-performance liquid chromatography and stress testing study
Article
RESULTS AND DISCUSSION Method development The retention behaviour of CLP as function of mobile phase pH, composition and flow rate was examined. After several trials with buffers of varying pH values phosphate buffer of pH 4.8 was found to be ideal. In buffers of pH other than 4.8 with methanol peaks obtained were either broad or unsymmetrical. When the pH of mobile phase were 3.5 and 4.5 the elution of peaks within a minute and after a long time, respectively, with less number of theoretical plates made the condition non-ideal. The resulted chromatograms are as shown in Figure 2.
a) Buffer (pH 3.5): methanol
b) Buffer (pH 4.0): methanol
c) Buffer (pH 4.5): methanol
d) Buffer (pH 4.8): methanol
e) Buffer (pH 5.5): methanol
Figure 2. Chromatograms obtained during method development under the conditions described in 'Chromatographic conditions'.
The effect of mobile phase composition (i.e. the ratio of phosphate buffer and methanol) was studied at different ratios such as 70:30, 75:25, 73:27 and a ratio of 73:27 v/v gave a symmetric peak with a retention time (< 3 min). Methanol was preferred to acetonitrile as the modifier since the former resulted in high sensitivity. Highest number of theoretical plates was achieved at a flow rate of 0.25 mL min-1 with asymmetry value of < 1.5. Increased flow rate resulted in lower retention but slightly asymmetry peak was obtained. In order to select the suitable column, trials were performed with Acquity BEH Phenyl (100 × 2.1 mm, 2 μm), Inertsil ODS-3 (50 × 2.1 mm, 2 μm), Eclipse Plus C18, RRHD (50 × 2.1mm, 1.8 μm), Acquity BEH C18 (100 × 2.1 mm, 1.7 μm), Zorbax XDB C18 (50 × 2.1 mm, 1.8 μm) columns. Peak splitting, early elution of peak or no elution of peak was observed with columns other than Zorbax XDB C18. Zorbax XDB C18 column was found to yield a symmetrical peak. The chromatograms of this study are presented in Figure 3. 15
Basavaiah, K.; Rajendraprasad, N.
Article
a) Acquity BEH Phenyl column
b) Inertsil ODS-3 column
c) Eclipse Plus C18, RRHD column
d) Acquity BEH C18 column
e) Zorbax XDB C18 column
Figure 3. Chromatograms obtained during method development using different columns.
Final selected method conditions
Column
Zorbax XDB C18 (50 × 2.1 mm; 1.8 μm particle size)
Oven temperature
30 °C
Mobile phase
Buffer (pH 4.8): methanol (73: 27% v/v)
Run time
6 min
Flow rate
0.25 mL min-1
Diluent
Mobile phase
Injection volume
3 μL
Blank
Diluent
Wavelength
254 nm
Method validation The described UPLC method for the assay of CLP was validated as per the current ICH Q2 (R1) Guidelines [45]. Linearity A linear response was obtained by the chromatograph for the investigated concentration range from 0.05 to 225 μg mL-1 drug. The method of least squares was used to calculate the linear regression equation. The slope and intercept of the regression equation and their standard deviation were evaluated 16
Chlorpropamide quantification in pharmaceuticals by reversed phase ultra-performance liquid chromatography and stress testing study
Article
and are presented in Table I. The correlation coefficient > 0.999 indicates a strong relationship between the two variables. The LOD and LOQ were calculated as per the ICH guidelines and are given in Table I, and reflective of the high sensitivity of the method. Table I. Linearity and regression parameters.
Parameter
Value -1
Linear range, μg mL
0.050 – 225.0 -1
Limits of detection, (LOD), μg mL
0.006 -1
Limits of quantification, (LOQ), μg mL
0.020
Regression equation, y* -1
Slope (m), AU/(μg mL )
45094
Intercept (b)
37365 -1
Standard deviation of m (Sm), AU/(μg mL )
209.100
Standard deviation of b (Sb)
98.500
Correlation coefficient (r)
0.9999 -1
*y=mx+b, where y is the mean peak area, x concentration in μg mL , b intercept, m slope.
Accuracy and precision The precision of the method was calculated in terms of intermediate precision (intra-day and inter-day). Three different concentrations of CLP were analysed in seven replicates during the same day (intra-day precision) and five consecutive days (inter-day precision). The %RSD values of intra-day and inter-day study given in Table II indicate excellent repeatability and reproducibility of the method. The accuracy of an analytical method expresses the closeness between the experimental value and the reference value. Accuracy was evaluated as percentage deviation between the measured concentration and nominal concentrations for CLP (Bias %). The results obtained are compiled in Table II and Table III and reveal that accuracy is good. Table II. Results of accuracy study (n = 5).
Concentration of CLP injected (μg mL-1)
a
Intra-day accuracy (n = 7) Concentration of %REa CLP found, μg mL-1
Inter-day accuracy (n = 5) Concentration of %REa CLP found, μg mL-1
75.00
74.60
0.53
75.60
0.80
150.00
149.10
0.60
151.30
0.87
200.00
200.72
0.36
198.92
0.54
Relative error.
Table III. Results of precision study.
Concentration injected (μg mL-1)
Intra-day precision (n = 7) Mean % Mean % area RSDa Rt±SD RSDb ±SD
Inter-day precision (n = 5) Mean % Mean % area RSDa Rt±SD RSDb ±SD
75.00
3399341 ± 12136
0.36
2.762± 0.004
0.14
3399237 ± 13215
0.39
2.748± 0.005
0.18
150.00
6798679 ± 21272
0.31
2.754± 0.005
0.18
6798463 ± 22435
0.33
2.761± 0.003
0.11
200.00
10198018 ± 34159
0.34
2.745± 0.004
0.15
10197896 ± 35451
0.35
2.757± 0.004
0.14
Rt: Retention time a Relative standard deviation based on peak area; b Relative standard deviation based on retention time. 17
Basavaiah, K.; Rajendraprasad, N.
Article Method robustness and ruggedness To determine the robustness of the method, the experimental conditions were deliberately changed marginally. The flow rate, column oven temperature, mobile phase composition ratio and detection wavelength were the varied parameters. In each case, %RSD values were calculated for the resulting peak area and retention time. The number of theoretical plates and tailing factors were compared with those obtained under the optimized conditions. As part of ruggedness study, three different columns of same dimensions were used for the analysis by a single analyst. Analyses were also performed on the same day by three different analysts using a single column. The results of this study, expressed as %RSD are compiled in Table II and speak that vital chromatographic parameters remain unchanged under altered optimized experimental and operational conditions. The results are compiled in Table IV. Table IV. Results of method robustness and ruggedness. Modification
Mean peak area ± SD*
%RSD
Mean Rt ± SD*
%RSD
Theoretical plates ± SD*
%RSD
Tailing factor ± SD*
%RSD
-
6798678 ± 22216
0.33
2.761± 0.005
0.18
6363 ± 30.19
0.47
1.10 ± 0.005
0.45
Temperature
30±1 ºC
6806363 ± 23063
0.34
2.758± 0.004
0.14
6412 ± 29.16
0.45
1.11 ± 0.006
0.54
Mobile phase composition (Buffer: acetonitrile)
80:20 73:27 70:30
6798679 ± 21286
0.31
2.763± 0.005
0.18
6352 ± 25.82
0.41
1.19± 0.005
0.42
0.25±0.02 -1 mL min
6798179 ± 22336
0.33
2.767± 0.003
0.11
6369 ± 28.92
0.45
1.11 ± 0.004
0.36
254±1 nm
6798589 ± 21634
0.32
2.754± 0.004
0.14
6412 ± 29.41
0.46
1.17 ± 0.006
0.51
Analyst
-
6798679± 19886
0.29
2.761± 0.005
0.18
6410 ± 29.95
0.47
1.18 ± 0.005
0.42
Column
-
6788169 ± 21436
0.32
2.765± 0.004
0.15
6419 ± 30.92
0.48
1.14 ± 0.004
0.35
Condition Condition
Actual
Flow rate Wavelength
*Mean value of three determinations for CLP concentration of 150 μg mL-1.
Selectivity Selectivity of the method was evaluated by subjecting the mobile phase, placebo blank, pure drug solution and tablet extract in separate analyses. In the analyses by injecting pure mobile phase and solution of placebo blank and mobile phase absence of peaks in the chromatogram under optimized condition revealed that they are undetected. Besides, tablet extracts did not produced any additional peaks in the chromatogram (Figure 4) and this infers the procedure is selective. The analysis of the synthetic mixture solution yielded a percent recovery of 99.6 ± 0.54 (n=5). It is implied from these studies that there is no interference from the tablet excipients. Ă
Ľ
Figure 4. Chromatograms obtained for: a) placebo blank and b) tablet extract. 18
Chlorpropamide quantification in pharmaceuticals by reversed phase ultra-performance liquid chromatography and stress testing study
Article
Stability of the solution Solution stability was established by chromatographing the sample solution stored at lab temperature (25 ± 2 ºC) at different time intervals. Sample solution did not show any appreciable change in assay value when stored at ambient temperature up to 24 h. At the specified time interval, standard deviation for the system suitability parameters obtained from the drug solution injected in five replicates were calculated; and pooled standard deviations for three sets of data were computed. Low values of pooled RSD values of less than 0.33% indicate that no significant change in the elution of the peak and its system suitability criteria, tailing factor and theoretical plates occurred. These results are presented in Table V. Table V. Results of solution stability. Time (h)
0
Mean Peak area ± SD* 6798679 ± 21286
12
6798679 ± 19886
24
6798678 ± 22216
Sp
Mean Rt ± SD*
Sp
2.758± 0.004 0.45
2.769± 0.005
0.16
2.767± 0.003
Mean theoretical plates ±SD 6352± 25.82 6410± 29.95
Sp
0.45
6412± 29.41
Mean tailing factor± SD* 1.19± 0.005 1.13± 0.006
Sp
0.46
1.15± 0.005
Sp: Pooled standard deviation. *Mean value of five determinations for CLP concentration of 150 μg mL-1 at each time interval.
Application to tablets A 150 μg mL-1 solution of tablets prepared as per 'procedure for tablets' was injected in five replicates to the UPLC system. From the mean peak area, the concentration and hence mg/tablet were computed; and the results were compared with those of the official EP method [17]. The official assay procedure in EP is potentiometric titration of CLP solution in a mixture of HCl and ethanol with sodium hydroxide. The accuracy and precision of the proposed method were further evaluated by applying Student's t-test (< 2.7) and variance ratio F-test (< 6.4), respectively. The t- and F- values [46] at 95% confidence level did not exceed the tabulated values and this further confirms that there is no significant difference between the reference and proposed methods with respect to accuracy and precision. Table VI illustrates the results obtained from this study. Table VI. Results of analysis of CLP tablets by the proposed method and statistical comparison of the results with official method.
%CLP found* (%) ± SD
Nominal amount (mg)
Reference method
Copamide
250.00
99.36±1.02
Diabenese
250.00
101.5±0.91
Tablet brand name
Proposed method
t-value
F-value
98.92±1.15
0.64
1.27
102.1±0.63
1.22
2.09
*Mean value of five determinations. Tabulated t-value at 95% confidence level is 2.78; Tabulated F-value at 95% confidence level is 6.39.
Recovery study A standard addition procedure was followed to further assess the accuracy of the method. Pre-analysed tablet powder was spiked with pure CLP at three concentration levels and the total was determined by the
19
Basavaiah, K.; Rajendraprasad, N.
Article method developed. Assay at each level was triplicated. The percent recovery of added pure CLP, which is close to 100% (Table VII), reflects the accuracy as well as the selectivity of the method. Table VII. Results of recovery test by standard addition technique.
Tablet studied Copamide
Diabenese
MGL in tablet, µg mL-1
Pure MGL added, µg mL-1
Total MGL found, µg mL-1
Pure MGL recovered* (%ROS ±SD)
49.46
25.00
76.02
102.1±0.54
49.46
50.00
98.73
99.27±0.63
49.46
75.00
126.60
101.7±0.48
51.05
25.00
75.70
99.54± 0.42
51.05
50.00
103.60
102.5±0.81
51.05
75.00
127.40
101.1±0.75
*Mean value of three determinations
Results of forced degradation study Degradation was not observed when CLP was subjected to acidic, basic, photolytic and thermal stress conditions but slight degradation was observed under peroxide (oxidative) condition. The results from the forced degradation studies are presented in Table VIII. The chromatograms obtained for CLP after subjecting to different stress conditions are presented in Figure 5. Table VIII. Results of degradation study.
Stress condition
% Degradation
Acid hydrolysis
No degradation
Base hydrolysis
No degradation
Oxidation
20
22.50
Thermal (105 ºC, 2 h)
No degradation
Photolytic (1.2 million lux h)
No degradation
Chlorpropamide quantification in pharmaceuticals by reversed phase ultra-performance liquid chromatography and stress testing study
Article
(b)
(a)
(d)
(c)
(e)
Figure 5. Chromatograms of CLP (150 μg mL-1) after forced degradation a) acid degradation; b) base degradation; c) peroxide degradation; d) photolytic degradation and e) thermal degradation
CONCLUSIONS UPLC, an innovative product of liquid chromatography and which has out-smarted the conventional HPLC with respect to performance characteristics, was applied for the first time, to the determination of chlorpropamide in pharmaceuticals. Compared to many HPLC methods reported earlier for CLP in pharmaceuticals [18-23], the present method has distinct advantages of speed and cost considering the run time, sample volume injected and flow rate of the mobile phase and the system allows analysis to work with greater efficiencies. The method is applicable over a wide linear dynamic range (0.05 – 225 µg -1 mL ) enhancing its applicability to samples of widely different concentrations. With a detection limit of -1 6 ng mL , the method offers one of the most sensitive means of determining chlorpropamide in pharmaceutical samples. The hyphenated technique (UPLC-MS/MS) reported for body fluids [12,43,44] is highly expensive and remains out of bound of many laboratories. In the light of its inherent advantages of speed and cost and its sensitivity and simplicity, the method can be considered as an alternative to UPLCtandem mass spectrometry for biochemical analysis. Manuscript received Aug. 8, 2017; revised version received Oct. 11, 2017; accepted Nov. 10, 2017. 21
Basavaiah, K.; Rajendraprasad, N.
Article
Article
REFERENCES 1. Diehl, A. K.; Sugarek, N. J.; Bauer, R. L. Diabetes Care, 1985, 8 (3), pp 219-223. 2. Naoya, K.; Farouk, H. S.; Kaname, O.; Kimiko, K.; Mohamed, M. M.; Kenichiro, N.; Naotaka, K. Chromatographia, 2013, 76, pp 703-706. 3. Bakare, O. M. T.; Enemali, I. S.; Garba, M.; Obodozie, O. O. African J. Biotech, 2007, 6 (12), pp 1378-1381. 4. Starkey, B. J.; Mould, G. P.; Teale, J. D. J. Liq. Chromatogr., 1989, 12, pp 1889-1896. 5. Zecca, L.; Trivulzio, S.; Pinelli, A.; Colombo, R.; Tofanetti, O. J. Chromatogr B. Biomed. Sci. Appl, 1985, 339, pp 203-209. 6. Elisabeth, W. B.; Arne, M. J. Chromatogr B. Biomed. Sci. Appl, 1979, 164 (4), pp 541-546. 7. Hill, R. E.; Crechiolo, J. J. Chromatogr, 1978, 145, pp 165. 8. Midha, K. K.; McGilveray, I. J.; Charette, C. J. Pharm. Sci., 1976, 65 (4), pp 576-579. 9. Chua, H. C.; Stewart, B.; Lim, B. H.; Lee, H. K. J. Chromatogr. B: Biomed. Sci. Appl., 1998, 712, pp 243-252. 10. Nasierowska, Z.; Suffczynski, J.; Szyszko, E.; Taton, J.; Kolinski, P.; Czech, A.; Wojterska, J. Polish J. Pharmacol. Pharm, 1983, 35 (5), pp 405-415. 11. Khalid, S.; Khawla, S. J. Pharm. Sci, 1970, 59 (6), pp 782-784. 12. Guillaume, H.; Denis, L.; Thierry, T.; Arnaud, R.; Laurent, B.; Matthieu, K. L.; Sandrine, H.; Herve, M. Clin. Chem, 2005, 51 (9), pp 1666-1672. 13. Das Gupta, Anal. Lett, 1984, 17 (18), pp 2119-2128. 14. Magni, F.; Marazzini, L.; Pereira, S.; Monti, L.; Kienle, M. G. Anal. Biochem, 2000, 282 (1), pp 136141. 15. Nunez, M.; Ferguson, J. E.; Machacek, D.; Jacob, G.; Oda, R. P.; Lawson, G. M.; Landers, J. P. Anal. Chem, 1995, 67, pp 3668-3675. 16. The United States Pharmacopoeia, 27th revision, US Pharmacopoeial Convention, MD, 2004, p 436. 17. The British Pharmacopeia, Vol. III, Her Majestyâ&#x20AC;&#x2122;s Stationery Office, London, 2008, p 2530. 18. El-Gizawy, S. Bull. Faculty of Sci., 1991, 20, p 65. 19. Kumasaka, K.; Kojima, T.; Honda, H.; Doi, K. J. Health Sci, 2005, 51 (4), pp 453-460. 20. Molins, D.; Wong, C. K.; Cohen, D. M.; Munnelly, K. P. J. Pharm. Sci, 1975, 64, p 123. 21. Robertson, D. L.; Butterfield, A. G.; Kolasinski, H.; Lovering, E. G.; Matsui, F. F. J. Pharm. Sci, 1979, 68, pp 577-580. 22. Nadkarni, D. R.; Merchant, R. N.; Sundaresan, M.; Bhagwat, A. M. Indian Drugs, 1997, 34, p 650. 23. El-Bardicy, M. G.; El-Khateeb, S. Z.; Assaad, H. N.; Ahmad, A. S. Indian J. Pharm. Sci., 1988, 50 (3), p 171. 24. Joseph, L.; George, M. J. Chem. Pharm. Sci, 2010, 3, p 38. 25. Lazaryan, D. S.; Kompantseva, E. V. Farmatsiya, 1981, 30, p 30. 26. Mbah, C. J.; Okorie, N. H. J. Sci. Res, 2011, 3 (1), pp 207-212. 27. Zorya, B. P.; Petrenko, V. V.; Kulik, I. A. Farmatsiya, 1989, 38, p 69. 28. Dnyanesh, T. N.; Kasture, A. V. Indian Drugs, 2000, 37, p 309. 29. Nourrudin, A. W.; Abdelwahab, N. S.; El-Zeiny, B. A.; Tohamy, S. I. J. Liq. Chromatogr. Rel. Tech, 2013, 36, pp 1575-1585. 30. Anna, G.; Hanna, H.; Anna, B.; Dorota, K. J. Planar Chrom. Modern TLC, 2003, 16 (4), pp 271-275. 22
Chlorpropamide quantification in pharmaceuticals by reversed phase ultra-performance liquid chromatography and stress testing study
Article
Article
31. وKu, Y. R.; Chag, L. Y.; Ho, L. K.; Lin, J. H. J. Pharm. Biomed. Anal., 2003, 33 (2), pp 329-334. 32. 2. Kosta, N.; Slavka, P.; Milica, B.; Lucija, A. Arhivza Farmaciju, 1992, 42, p 53. 33. 3. Mingluo, D.; Chunyan, P.; Jing C.; Min S.; Tingting Z.; Taijun H. J. Sep. Sci, 2016, 39 (15), pp 2907– 2918. 34. 4. Swamy, N.; Basavaiah, K.; Vamsikrishna, P.; Krishnamurthy, G. Thai. J. Pharm. Sci, 2015, 39 (2), pp 41-48. 35. 5. Prathyusha, P. C. H. G. S.; Shanmugasundaram P.; Naidu, P. Y. Int. J. Adv. Pharm. Anal, 2013, 3 (1) pp 1-10. 36. 6. Tarab, J. A.; Amruth, R.; Rayapura, T. R.; Sannaiah, A.; Netkal M. G.; Bellale M. V. J. Anal. Sci. Tech, 2014, 5, pp 33-38. 37. 7. Cijo, M. X.; Basavaiah K. World J. Pharm. Pharm. Sci, 2015, 4 (4), pp 1649-1668. 38. 8. Rajan, V. R.; Sandip, P. P. Der Pharmacia Sinica, 2014, 5 (1), pp 18-22.
9. Karunakaran, K.; Navaneethan, G.; Elango, K. P. Tropical J. Pharm. Res., 2011, 10 (5), pp 655-661. 39. 10. Cijo, M. X.; Basavaiah, K. Thai J. Pharm. Sci, 2013, 37, pp 84-94. 40. 11. Saadet, D. Asian J. Chem, 2013, 25 (3), pp 1730-1732. 41. 42. 12. Vinay, K. B.; Revanasiddappa, H. D.; Cijo, M. X.; Ramesh, P. J.; Swamy, N.; Rajendraprasad, N. Trakia J. Sci, 2015, 15 (1), pp 1-11.
13. De Bock, L.; Boussery, K.; Colin, P.; De Smet, J.; T’Jollyn, H.; Van Bocxlaer, J. Talanta, 2012, 89, pp 43. 209-216. 44. 14. Fachi, M. M.; Cerqueira, L. B.; Leonart, L. P.; Francisco, T. M.; Pontarolo, R. PLoS ONE, 2016, 11(12): e0167107. 45. 15. International Conference on Harmonisation of Technical Requirements for Registration of Pharmaceuticals for Human Use, ICH Harmonised Tripartite Guideline, Validation of Analytical Procedures: Text and Methodology Q2(R1), Complementary Guideline on Methodology dated 06 November 1996, incorporated in November 2005, London.
16. Inczedy, J.; Lengyel, T.; Ure, A. M. IUPAC Compendium of Analytical Nomenclature: Definitive 46. Rules, Blackwell Science Inc., Boston, 1998.
23
Br. J. Anal. Chem., 2017, 4 (16), pp 24-35
Article
Download
Microvolume-DLLME for the Spectrophotometric Determination of Clidinium Bromide in Drug, Urine, and Serum Wijdan Shakir Khayoon*, and Hawraa Rahman Yonis Department of Chemistry, College of Sciences, University of Baghdad, Al-Jadrya, Baghdad, Iraq The present study combines UV-Vis spectrophotometry and dispersive liquid-liquid microextraction (DLLME) for the preconcentration and determination of trace level clidinium bromide (Clid) in pharmaceutical preparation and real samples. The method is based on ion-pair formation between Clid and bromocresol green in aqueous solution using citrate buffer (pH = 3). The colored product was first extracted using a mixture of 800 µL acetonitrile and 300 µL chloroform solvents. Then, a spectrophotometric measurement of sediment phase was performed at λ = 420 nm. The important parameters affecting the efficiency of DLLME were optimized. Under the optimum conditions, the calibration graphs of standard -1 (Std.), drug, urine and serum were ranged 0.005 - 0.16 µg mL . The limits of detection, quantification, and Sandell's sensitivity were calculated. Good recoveries of Clid Std., drug, urine and serum at 0.005, 0.01, -1 0.1 and 0.16 µg mL ranged 93.77 - 101.0%. Enrichment factor was calculated for Std., drug, urine and serum. The method was applied successfully to determine Clid in pharmaceutical preparation and real samples. Keyword: Clidinium bromide, DLLME, spectrophotometry, microextraction, pharmaceutical preparation. INTRODUCTION In the past decade, sample preparation was mainly focused on miniaturization, simplification and automation in order to lower the costs of materials and personnel. Current attempts highly focused on improving the quality of the analytical results. Therefore, cleaning up, concentrating and executing the desired analyte to well-match with the chosen analytical instrument, are the targets of sample preparation techniques [1]. Conventional sample methods, such liquid-liquid extraction [2], Soxhlet extraction [3], distillation and absorption [4,5] are time consuming, difficult to automate and consume large amounts of hazard solvents [6]. The recent trend is toward minimizing the amounts of hazardous solvent consumed, and waste generated, and overcoming the drawbacks of the traditional techniques. Thus, microextraction techniques, such as solid-phase microextraction [7], single drop microextraction [8], liquid-phase microextraction [9], and dispersive liquid–liquid microextraction (DLLME) have immediately attracted a special attention and become widely used in the field of sample preparation [10]. DLLME has been used for the extraction of halogenated organic compounds [11], pesticides [12], palladium [13], and barbituric acid [14]. Spectrophotometric methods are the most common technique. Moreover, simplicity, speed, cost effectiveness, availability of instrumentation, fairly sensitive and precision are what made such methods desirable. Combination of spectrophotometric technique with DLLME-based on ion-pair formation has been applied for the estimation of manganese [15], nitrate [16], fungicide carbendazim [17], and boron [18]. Therefore, in the current study, the determination of clidinium bromide (Clid) in biological samples based on ion-pair has been adopted. Clid (Figure 1), known as (3-[(hydroxy-diphenylacetyl)-oxy]-1-methyl-1-azoniabicylo-[2.2.2] octane bromide) and widespread as anticholinergic drug can help signs of squirm and abdominal stomach pain by decreasing stomach acid [19]. The methods available for the determination of Clid are high performance liquid chromatography [20,21], capillary electrophoresis [22], and spectrophotometry [23,24]. 24
*wijdansh2012@gmail.com ORCID: 0000-0001-7858-4905
Microvolume-DLLME for the spectrophotometric determination of clidinium bromide in drug, urine, and serum
Article
Figure 1. Chemical structure of clidinium bromide.
The aim of the present work is DLLME-spectrophotometric determination of Clid. It is based on the formation of ion pair complex between bromocresol green (BCG) and Clid in an aqueous solution at pH = 3. All parameters affecting the efficiency of DLLME were discussed. The performance of the proposed method was conducted by the determination of Clid in pharmaceutical and real sample. MATERIALS AND METHODS Apparatus
APEL PD-303 UV spectrophotometer (Japan) with 1 cm quartz microcells was used. Phase separation process was performed by HERMLE centrifuge (Z -200A) (Germany) using 15 mL centrifuge tubes. Materials and Solutions All chemicals and reagents used were of analytical reagent grade. Acetonitrile, chloroform, citric acid, trisodium citrate were supplied from BDH (England) while BCG was purchased from Riedel-de Haën (Germany). Pure clidinium bromide (Clid) was provided by Samarra Drug Industry (Iraq). -1
A stock solution of 1000 µg mL Clid was prepared by dissolving an adequate amount in a least volume of warm distilled water (50 ± 2 ºC). Then, it was cooled and transferred to 100 mL volumetric flask and was diluted to the mark with distilled water. -3 BCG (10 M) was prepared by dissolving an appropriate 0.0698 g of the reagent in acetone. Then, it was diluted to 100 mL. Buffer solution was prepared by mixing 82 mL from citric acid (0.1 M) with 18 mL trisodium citrate (0.1 M) to obtain pH = 3. Dispersive Liquid-Liquid Microextraction Procedure -1 -3 An amount of 50 - 1600 µL of Clid standard solution (1 µg mL ), 1250 µL BCG solution (10 M), and 5 mL buffer solution were mixed into 15 mL centrifuge tube. Then, the mixture was diluted to 10 mL with distilled water and left for 3 min. A cloudy solution was formed after a rapid injection of a mixture of 800 µL acetonitrile and 300 µL chloroform. The mixture was then centrifuged at 5000 rpm for 5 min. The dispersed fine droplets of the organic phase were collected at the bottom of the tube. After removing the aqueous phase, the organic layer was transferred using a microsyringe. Later, it was placed into the quartz microcell and the absorbance was measured thereafter at 420 nm against the blank solution. The latter was run under the same procedure without adding Clid. All steps of DLLME are summarized in Figure 2.
25
Khayoon, W. S.; Yonis, H. R.
Article
Figure 2. Procedure for the DLLME Method.
Procedure for Real Sample In the present study, the biological samples were collected from healthy volunteers living in different cities in Baghdad, Iraq. Human serum was separated from the whole blood by centrifuging it at 4000 rpm for 10 min. A 0.5 mL of human serum was spiked with Clid standard (100 µg mL-1), transferred into a -1 volumetric flask, and diluted to 50 mL with distilled water to obtain 1 µg mL to be later stored in a refrigerator until use. Human urine was also prepared using same procedure. A 500 µL of serum and/or -1 urine (equivalent to 0.1 µg mL ) was separately subjected to the DLLME procedure, as described above. Procedure for Tablets The contents of 10 tablets of Clid (Labrax tab. contains 2.5 mg) were thoroughly powdered, mixed and the average weight of each one was calculated. An accurately adequate amount of the drug powder was shaken well using 5 mL of warm water (50 ± 2 ºC) for 5 min. The mixture was then transferred into 100 mL volumetric flask, and diluted to the mark using distilled water to get 1000 µg mL-1. A 500 µL of the working -1 solution (equivalent to 0.1 µg mL ) was separately subjected to the DLLME procedure, as described above. RESULTS AND DISCUSSION Effect of Reaction Variables For the wavelength selection, a sample solution containing different concentration of Clid was tested according to DLLME procedure. The UV-Vis spectra of the sediment phase were recorded in the range of 330 - 600 nm. The maximum Abs spectrum occurs at 420 nm. Thus, 420 nm was selected for all subsequent measurements. -1 Sample solutions containing different concentrations (0.005 - 0.12 µg mL ) of Clid were examined according to the recommended procedure for DLLME at 420 nm. Considering Figure 3, the absorbance increased with the increase of Clid concentration. 26
Microvolume-DLLME for the spectrophotometric determination of clidinium bromide in drug, urine, and serum
Article
Figure 3. UV-Visible absorbance spectra of sediment phase in the presence of different concentration of Clid. Clid contains tertiary amine group in its structure (Figure 1). Therefore, in acidic media, an extractable ion pair was formed between positive charged drug and negatively charged reagent (BCG). The theoretical principle of this reaction was based on the dissociation equilibrium of AB electrolyte in aqueous medium according to Eq. 1 (where A+, the protonated amino drug, and B-, the BCG reagent, can be shifted to the left (association) if the ion pair is removed by extracting it with water immiscible solvent [24].
The colored product of ion pair is soluble in chloroform. Thus, in this study, spectrophotometric method based on the extraction of this color product using chloroform in the presence of acetonitrile is introduced and optimized in details. Such a factor affects the formation of ion-pair and DLLME method. The effect of BCG concentration on the intensity of color at the selected wavelengths was investigated with a different concentration of BCG reagent (10-5 - 10-1 M). Figure 4a shows that the higher absorbance was obtained using 10â&#x2C6;&#x2019;3 M that was selected as an optimum thereafter. The reaction between Clid and BCG reagent was carried out in an aqueous buffered solution of pH range between 3 and 6. Higher color intensity was obtained at pH = 3 (Figure 4 b). Therefore, pH = 3 was selected for the further experiment. The effect of the volume of the selected buffer solution (pH = 3) has also been studied. Figure 4c indicates that 2.5 mL gave high absorbance. Moreover, the time required to complete the formation of ion pair was examined during 1 - 30 min. The results showed that after 3 min, there was no change in color intensity. Therefore, it was chosen for the subsequent experiments.
27
Khayoon, W. S.; Yonis, H. R.
Article
Figure 4. Optimization of Ion Pair: (a) effect of BCG reagent; (b) type of pH; c) volume of buffer solution.
Optimization of DLLME Method Type of Extraction and Disperser Solvent With DLLME method, the attention was paid to the selection of an extraction solvent. The solvent should be of low solubility in water, capable to extract the desired analyte, and of low toxicity and volality [11] however, the essential point for the selection of the disperser was its high miscibility in both the extraction and aqueous solutions [6]. For this purpose, several chlorinated solvents (i.e., carbon tetrachloride CCl4, chloroform CHCl3, methylene chloride CH2Cl2 and ethylene chloride C2H4Cl2), and low cost and toxic as a disperser solvent (i.e., methanol, acetonitrile, ethanol and acetone) were investigated. Figure 5 shows how the mixture of acetonitrile (800 ÂľL) and chloroform (500 ÂľL) gave higher absorbance. Thus, these solvents were chosen as optimum.
28
Figure 5. Type of extraction and disperser solvent.
Microvolume-DLLME for the spectrophotometric determination of clidinium bromide in drug, urine, and serum
Article
Volume of Extraction and Disperser Solvents To test the effect of extraction and disperser solvents volume, a series of solutions containing different volumes of chloroform (250 - 500 µL) plus acetonitrile (800 µL) were studied. Figure 6a, shows that when the volume of extraction solvent is increased, the absorbance is increased. Therefore, 300 µL was selected in the next experiment. The effect of the volume of disperser solvent was also examined using various volumes of acetonitrile (600 - 1600 µL), containing 300 µL of the extraction solvent. According to the results obtained in Figure 6b, it was noticed that the absorbance increased upon increase of the volume of disperser solvent from 600 to 800 µL. But it is dropped thereafter probably due to the increase in the solubility of the analyte in the water sample [25]. Thus, 800 µL of acetonitrile was selected.
Figure 6. Effect of (a) volume extraction solvent and (b) disperser solvent volume. Effect of Ionic Strength and Extraction Time The effect of ionic strength was evaluated by adding different amounts of NaCl (0 - 10%, w/v) into the sample solution. From the results obtained, it was noticed that the absorbance decreased with the increase in the amount of NaCl from 0 to 10% (w/v). This was due to the decrease in the solubility of the extraction solvents in the aqueous solution. Accordingly, the procedure was performed without the addition of salt. The effect of the extraction time interval time between the injection of the mixture of solvents (extraction and dispersive solvent) in an aqueous sample and the start of centrifugation [16] was studied. The mixture was centrifuged for 1 - 20 min. The results showed that the variations of the absorbance versus the extraction time were not remarkable. This was because the surface area between the extraction solvent and aqueous layer was infinitely large. Thereby, the method was rapid; this was the most important advantage of DLLME technique.
29
Khayoon, W. S.; Yonis, H. R.
Article Centrifugation Time and Speed Centrifugation was required for the separation of the organic solvent from the aqueous phase. To attain the best extraction efficiency, the centrifugation time and speed were optimized in the range of 1 - 10 min and 1000 - 6000 rpm, respectively. The results indicated that the separation was complete within 5 min using a rotation speed of 5000 rpm. Stoichiometric Relationship Stoichiometry of the ion pair Clid-BCG complex was established by the molar ratio (Figure 7a) and the continuous variation (Figure 7b) methods. The results showed that the ion-pair had 1:1 (BCG:Clid) ratio.
Figure 7. Stoichiometric ratio of Clid-BCG ion pair at λ= 420 nm using (a) molar ratio and (b) continuous variation methods.
Method Validation Table I summarizes all analytical characteristics of the proposed method. Under the optimum conditions, the linear range was 0.005 - 0.16 µg ml-1. Limit of detection (LOD) and of quantification (LOQ) were calculated using the following equation: 3.Sb/m and 10.Sb/m respectively, where Sb and m are the standard deviation of the blank and slope of a calibration graph, respectively. The precision of the method was attributed to its repeatability and reproducibility. Intra-day repeatability and inter-day reproducibility were determined using four different concentrations for Clid Std., drug, urine and serum. Five replicate measurements for each level was conducted. Acceptable precision was reflected from the RSD% values for the intra-day (0.14 - 1.41%) and inter-day (0.16 - 1.66%) (Table II). The accuracy of the method was performed at four concentration levels for Clid Std., drug, urine and -1 serum. Five replicates were investigated at 0.005, 0.01, 0.1 and 0.16 µg mL for each of the samples. The results showed that high recovery values obtained ranged from 93.77 to 101.0% (Table III). 30
Microvolume-DLLME for the spectrophotometric determination of clidinium bromide in drug, urine, and serum
Article
Table I. Analytical performance for the proposed method. Std.
Real samples
Parameters Regression equation Correlation coefficient r 2
Linearity percentage r % -1
Linear range (µg mL ) a
-1
-1
Before DLLME
After DLLME
Drug
Urine
Serum
0.081x-0.0060
9.9167x+0.1649
6.4659x+0.0953
5.667x+0.0863
8.0413x+0.0833
0.9992
0.9991
0.9985
0.9984
0.9987
99.84
99.92
99.70
99.68
99.74
10-300
0.005-0.16
0.005-0.16
0.005-0.16
0.005-0.16
4
Ɛ (L mol cm ) ?
3.49x10
4.29x10
6
2.8x10
6
2.45x10
6
3.48x10
6
b
-1
0.75
0.0042
0.0042
0.0048
0.0041
c
-1
2.95
0.0141
0.0139
0.0159
0.0137
LOD (µg mL ) LOQ (µg mL ) d
-2
-2
-5
-4
-4
-4
S (µg cm )
1.2x10
1x10
1.5x10
1.8x10
1.2x10
E
………..
122.0
80
70
100
Enrichment factor
a
Molar Absorptivity; b Limit of Detection; c Limit of Quantification; d Sandells Sensitivity; E Enrichment Factor was calculated from the slope of calibration curve after and before DLLME.
Table II. Intra-day repeatability and Inter-day reproducibility of the proposed method. Intra-day repeatability Inter-day reproducibility Conc. a b ( RSD%, n=5) ( RSD%, n=15) -1 (µg mL ) Std. Drug Urine Serum Std. Drug Urine Serum 0.005
1.13
1.41
0.89
0.99
1.23
1.66
1.16
1.27
0.01
1.24
1.09
1.13
1.30
1.38
1.24
1.29
1.60
0.1
0.23
0.44
0.53
0.28
0.26
0.54
0.66
0.30
0.16
0.14
0.27
0.32
0.22
0.16
0.36
0.41
0.26
a
RSD five determinations; bRSD Average of five determinations over three days.
31
Khayoon, W. S.; Yonis, H. R.
Article Table III. Accuracy of the proposed method -1
Conc. (µg mL ) Samples
Recovery% (E%) Added
Found
Std.
0.005 0.01 0.1 0.16
0.0048 0.0096 0.097 0.162
95.40 (-4.61) 95.90 (-4.10) 97.40 (-2.60) 101.01 (1.01)
Drug
0.005 0.01 0.1 0.16
0.0048 0.0097 0.099 0.159
94.96 (-5.04) 96.66 (-3.34) 98.60 (-1.41) 99.28 (-0.72)
Urine
0.005 0.01 0.1 0.16
0.0047 0.0095 0.099 0.159
94.23 (-5.77) 94.76 (-5.24) 99.22 (-0.78) 99.40 (-0.60)
Serum
0.005 0.01 0.1 0.16
0.0047 0.0095 0.097 0.159
93.77 (-6.23) 94.64 (-5.36) 96.86 (-3.14) 99.98 (-0.02)
Effect of Interference The influence of potential compounds and ions was established using of 0.01 µg mL-1 of Clid in drug, urine and serum samples. The results are illustrated in Table IV. Under the reaction conditions, all the interference ions and compounds did not interfere. Table IV. Effect of foreign ion on Clid determination. Coexisting ions
Tolerance ratio -2
+
Starch, Glucose, Sucrose, Lactose, Creatinine, urea, uric acid, SO4 , K , +2 -3 Ca , PO4 -2
1:1000
+
Starch, Glucose, Sucrose, Lactose, Creatinine, urea, uric acid, SO4 , K , +2 -3 Ca , PO4 Starch, Glucose, Sucrose, Lactose, Alanine, Creatinine, urea, uric acid, SO4 2 + +2 -3 , K , Ca , PO4
1:100 -
1:10
Application The proposed method was applied for the extraction and determination of Clid in three different pharmaceutical preparations and biological samples: spiked with Clid and pharmaceutical preparations. As shown in Table V, the theoretical content of the active ingredient represents the actual amount of Clid in the pharmaceutical tablet. On the other hand, the data obtained in the practical content reflects the amount of Clid in the selected tablets after applying the proposed method.
32
Microvolume-DLLME for the spectrophotometric determination of clidinium bromide in drug, urine, and serum
Article
Table V. Determination of Clid in three pharmaceutical preparation using the proposed method. Sample Nº
Pharmaceutical tablet content and manufacturer (2.5 mg)
Weight of pharmaceutical equivalent to 0.02 µg of active ingredient (g)
Theoretical content of active ingredient (mg)
Practical content of active ingredient (mg)
E%
Efficiency of determination % ± RSD%
1
Librax, Swaziland
0.3020± 2.252
2.5
2.53
1.155
101.2±0.23
2
Libraxam, Iraq
0.1794± 3.005
2.5
2.44
-2.610
97.39±0.36
3
Eipco, Egypt
0.3096± 9.526
2.5
2.51
0.211
100.2±0.30
The spectra of Clid for pure, drug, urine and serum samples before and after using DLLME are illustrated in Figure 8. The result indicates that there was a significant enrichment of the analyte after undergoing the DLLME method.
Figure 8. Spectrum of Clid spiked with 0.1 µg mL-1 before and after DLLME for (A) Std.; (B) Drug; (C) Urine; and (D) Serum.
The proposed method was compared with other reported methods regarding the determination of Clid (Table VI). The result showed the advantages of the proposed method with respect to the linear ranges, LOD and LOQ.
33
Khayoon, W. S.; Yonis, H. R.
Article Table VI. Comparison of linear range, LOD and LOQ for the determination of Clid using proposed and other methods. Linearity range -1 (μg mL )
LOD -1 (μg mL )
LOQ -1 (μg mL )
Samples
Ref.
2.5-300
0.088
0.294
Pharmaceutical preparation
19
Capillary electrophoresis
5-100
1
4
Drug
22
LLE/UV-Vis
10-300
0.75
2.95
Pharmaceutical preparation
24
0.0042
0.0141
Std.
0.0042
0.0139
Drug
0.0041
0.0137
Serum
0.0048
0.0159
Urine
Method
HPLC
DLLME/ Spectrophotometry
0.005-0.16
Present study
CONCLUSION Compared to the LLE method, the proposed method was revealed to be simple, sensitive, rapid, reproducible, and requires a low solvent volume. In addition, it helped reduce the hazardous chlorinated solvent consumption and provide a high enrichment factor. Moreover, the method outlined a successful application and permitted the separation and preconcentraion of Clid at a trace level in biological and pharmaceutical samples. Manuscript received Sept. 24, 2017; revised version received Nov. 16, 2017; accepted Nov. 23, 2017.
34
Article
Microvolume-DLLME for the spectrophotometric determination of clidinium bromide in drug, urine, and serum
Article
REFERENCES 1.
Ahmad, W.; Al-Sibaai, A.; Bashammakh, A.; Alwael, H.; El-Shahawi, M. TrAC Trends Anal. Chem., 2015, 72, pp 181-192.
2.
Mahara, B. M.; Borossay, J.; Torkos, K. Microchem J., 1998, 58, pp 31-38.
3.
Saim, N. a.; Dean, J. R.; Abdullah, M. P.; Zakaria, Z. J. Chromatogr. A., 1997, 791, pp 361-366.
4.
Chau, Y. K.; Wong, P. T. S.; Goulden, P. Anal. Chimica. Acta., 1976, 85, pp 421-424.
5.
Bremner, J.; Keeney, D. R. Anal. Chim. Acta., 1965, 32, pp 485-495.
6.
Ma, J.; Lu, W.; Chen, L. Curr. Anal. Chem., 2012, 8, pp 78-90.
7.
Penalver, A.; Pocurull, E.; Borrull, F.; Marcé, R. J. Chromatogr. A, 2002, 953, pp 79-87.
8.
Ahmadi, F.; Assadi, Y.; Hosseini, S. M.; Rezaee, M. J. Chromatogr. A, 2006, 1101, pp 307-312.
9.
Pedersen Bjergaard, S.; Rasmussen, K. E. Electrophoresis, 2000, 21, pp 579-585.
10. Rezaee, M.; Assadi, Y.; Hosseini, M.-R. M.; Aghaee, E.; Ahmadi, F.; Berijani, S. J. Chromatogr. A, 2006, 1116, pp 1-9. 11. Leong, M. I.; Huang, S. D. J. Chromatogr. A, 2008, 1211, pp 8-12. 12. Zhang, J.; Liang, Z.; Li, S.; Li, Y.; Peng, B.; Zhou, W.; Gao, H. Talanta, 2012, 98, pp 145-151. 13. Kozani, R. R.; Mofid-Nakhaei, J.; Jamali, M. R. Environ. Monit. Assess., 2013, 185, pp 6531-6537. 14. Zarei, A. R.; Gholamian, F. Anal. BioChem., 2011, 412, pp 224-228. 15. Balogh, I.; Rusnáková, L.; Škrlíková, J.; Kocúrová, L.; Török, M.; Andruch, V. Int. J. Environ. Anal. Chem., 2012, 92, pp 1059-1071. 16. Poormoghadam, P.; Larki, A.; Rastegarzadeh, S. Anal. Methods, 2015, 7, pp 8655-8662. 17. Pourreza, N.; Rastegarzadeh, S.; Larki, A. Talanta, 2015, 134, pp 24-29. 18. Zarei, A. R.; Nobakht, S. J Trace Anal Food Drugs, 2013, 1, pp 1-13. 19. Kattan, N.; Ashour, S. J Pharm. 2013, 2013, pp 1-7. 20. Jalal, I.; Sa'sa', S.; Hussein, A.; Khalil, H. Anal. Lett., 1987, 20, pp 635-655. 21. Pathak, A.; Rai, P.; Rajput, S. J. J. Chromatogr.Sci., 2010, 48, pp 235-239. 22. Nickerson, B. J. Pharm.Biomed.Anal., 1997, 15, pp 965-971. 23. Toral, M. I.; Richter, P.; Lara, N.; Jaque, P.; Soto, C.; Saavedra, M. Int. J. Pharm., 1999, 189, pp 6774. 24. Amin, A.; Dessouki, H.; Moustafa, M.; Ghoname, M. Chem. Pap., 2009, 63, pp 716-722. 25. Kalhor, H.; Hashemipour, S.; Yaftian, M. R.; Shahdousti, P. Int. J. Ion Mobil. Spectrom., 2016, 19, pp 51-56.
35
Br. J. Anal. Chem., 2017, 4 (16), pp 36-43
Article
Download
Potentiometric Sensor Modified with Molecularly Imprinted Polymer for Determination of Ceftriaxone in Human Serum Monireh Khadem1, Mohammad Amin Norouzi1, Davood Heydari2* 1 Department of Occupational Health Engineering, School of Public Health, Tehran University of Medical Sciences, Tehran, Iran 2
Department of Analytical Chemistry, Islamic Azad University, Fars Science and Research Branch, Fars, Iran
In this work, a new potentiometric sensor modified with molecularly imprinted polymer (MIP) was studied for determination of ceftriaxone in serum samples. The MIP was synthesized using the ceftriaxone as a template molecule. After the optimization of the MIP composition, it was applied in the membrane sensor. The optimization of membrane composition was also conducted, leading to its Nernstian response to the ceftriaxone over the concentration range 1×10⁻¹ to 5×10⁻³ mol L-1 with a detection limit of 5.04×10⁻⁴ mol L-1. 2 -1 The PVC membrane sensor showed the optimum response (R : 0.999, slope: 49.19 mV decade ) by the composition of MIP: 0.07 g, PVC: 0.08 g, DOP: 0.2 mL, and THF: 2.5 mL. The sensor showed good selectivity and was successfully applied for potentiometric determination of ceftriaxone in human serum samples. Keywords: Ceftriaxone; Molecularly imprinted polymer; Potentiometry; PVC membrane. INTRODUCTION Ceftriaxone (CF) (6R,7R)-7-[[(2Z)-2-(2-amino-1,3-thiazol-4-yl)-2-methoxyiminoacetyl]amino]-3-[(2-methyl5,6-dioxo-1H-1,2,4-triazin-3-yl) sulfanylmethyl]-8-oxo-5-thia-1-azabicyclo (4.2.0) oct-2-ene-2-carboxylic acid, is a cephalosporin antibiotic. Like other third-generation cephalosporins, it has broad spectrum activity against Gram negative and Gram positive bacteria [1]. Ceftriaxone is often used to treat the communityacquired or mild to moderate pneumonia. It can also be used for treatment of bacterial meningitis [2]. Different analytical methods for ceftriaxone have been recommended by studies conducted on this analyte, including HPLC [3,4], TLC [5], mercurimetry [6], spectrophotometry [7,8], fluorimetry [8] and capillary electrophoresis [9]. During the last few years, the novel analytical methods have been considered due to the needs for more sensitivity, selectivity, and precision for determination of trace analytes in complex matrices. Sensors are interested tools for monitoring of trace chemicals and they can be used onsite because of suitable size, portability, and low cost. Recently, to increase the selectivity and efficiency of sensors, they are modified with different compounds. In electrochemical analysis, molecularly imprinted polymers (MIPs) are considered as modifying agents in sensors composition for enhancing their selectivity. A MIP is a synthetic and highly cross-linked polymer possessing molecular adsorption sites that their shape and position of functional groups are complementary to the analyte molecule, resulting in high specificity and selectivity. Unlike the biological specific receptors including antibodies and enzymes, these polymeric materials are favorable because of mechanical, thermal, and chemical stabilities [10,11]. Modified sensors may be used in combination with different electrochemical techniques like potentiometry. Potentiometric sensors are very appealing analytical tools to perform biomedical, environmental and industrial analyses away from a centralized laboratory. They have a tremendous potential for combining the ease of use and portability with simple and inexpensive fabrication techniques. There is no size restriction on the template compound by using a potentiometric sensors modified with MIPs, because the species do not have to diffuse through the membrane. These modified potentiometric sensors have been successfully developed *D.heydari67@gmail.com
36
Potentiometric Sensor Modified with Molecularly Imprinted Polymer for Determination of Ceftriaxone in Human Serum
Article
for quantification of anions, cations, and neutral species [12,13]. The present work was aimed to synthesize the ceftriaxone imprinted polymer using the computational studies, to optimize the determination parameters affecting the application of PVC membrane sensor modified with MIP, and to determine the ceftriaxone in human serum under optimized conditions. MATERIAL AND METHODS Reagents and Instruments Dioctyl phthalate (DOP), high molecular weight polyvinyl chloride (PVC), ethylene glycol dimethacrylate (EGDM), tetrahydrofuran (THF), 2,2ʹ-azobisisobutyronitrile (AIBN), methacrylic acid (MAA), sodium perchlorate, acetic acid, and phosphoric acid were obtained from Merck (Germany) and ceftriaxone was purchased from Sigma-Aldrich (USA). Drug-free human serum was derived from the blood of healthy volunteers after centrifugation of samples for 15 min. All potentiometric measurements were done at 25 ± 1 °C using a pH/ion meter (model PTR 79). A Metrohm double junction Ag/AgCl reference electrode (Metrohm EIL 744) containing 3 M potassium nitrate in the outer chamber was applied in conjunction with the proposed electrode. A combined pH glass electrode (Metrohm EIL 744) was used for all pH measurements. Preparation of solutions The phosphate buffer was prepared by dissolving 0.314 mL phosphoric acid with 7.022 g in 500 mL of deionized water. The stock standard solution of ceftriaxone (0.1 mol L-1) was prepared by dissolving 0.55 g of ceftriaxone in 25 mL of deionized water. The acetic acid solution (1 M) was prepared by adding 17.9 mL acid in 250 mL deionized water. Preparation of ceftriaxone - imprinted polymer particles To prepare the ceftriaxone imprinted polymer particles, 0.14 g of ceftriaxone was dissolved in 14 mL tetrahydrofuran (THF) solvent in a 25 mL round-bottom flask. Then, 0.24 mL of functional monomer (MAA), 6 mL of cross-linker (EGDMA) and 0.33 g of initiator (AIBN) were added. The mixture was purged with nitrogen for 10 min and the flask was sealed under this atmosphere. It was then kept stirring for 24 hours in a water bath at 60 °C to start the polymerization process. The obtained hard polymer monolith was dried and grounded into a fine powder. Monomers were eluted by washing the polymer with acetic acid -1 (1 mol L ) for 30 min. Then, the particles were suspended in acetone and allowed to settle for 4 h. The sedimented particles were eliminated and not sedimented ones were collected by centrifugation. These collected particles were again suspended in acetone for 4 h to settle and followed by centrifugation. After four times repeating of this procedure, the obtained MIP particles were dried under vacuum at 60 ºC and were used in latter experiments. The non-imprinted polymer (NIP) was synthesized in the same condition for MIP synthesis, except for addition of ceftriaxone to the mixture. The performance of MIP-based membrane electrode was compared to the membrane constructed with non-imprinted polymer at the same experimental conditions. To compare the performance of MIP and NIP particles to bind selectively with analyte, 0.1 g of the MIP and NIP beads were separately added to 30 mL solutions containing ceftriaxone (5.0×10⁻⁴ mol L-1). The solutions were stirred for 30 minutes at 500 rpm. Then, they were centrifuged and the supernatant was analyzed by UV-Vis spectrometry. The binding capacity of MIPs and NIP was calculated based on the initial and final concentration of ceftriaxone in the solutions. According to results, MIP showed the higher binding capacity (81.34%) in comparison with the NIP (37.83%). Therefore, the NIP indicated no sensitivity to analyte, suggesting the imprinted binding sites are responsible for higher sensitivity of MIP sensor to analyte.
37
Khadem, M.; Norouzi, M. A.; Heydari, D.
Article
Figure 1. The structure of ceftriaxone Fabrication of the ceftriaxone sensor Appropriate amount of PVC (0.08 g) was dissolved in 2.5 mL of THF. Then, 0.07 g of MIP particles were dispersed in 0.2 mL of DOP, this mixture was added to the above solution and homogenized. After preparation of copper wire electrodes (1 mm diameter), they were polished with fine alumina slurries on a polishing cloth, sonicated in distilled water and kept at room temperature to dry. The prepared electrode was dipped into the membrane solution and the evaporation of the solvent yielded membrane on the -4 -1 surface of wire. The electrode was conditioned for 18 h by soaking in a 1.0×10 mol L ceftriaxone solution. RESULTS AND DISCUSSION Optimization of MIP composition Methacrylic acid is the most commonly used functional monomer to synthesize polymers. In addition to the strong ionic interaction with functional groups of template, the carboxyl group of methacrylic acid can act as a hydrogen bond donor and acceptor. The binding energy, ∆E, obtained with MAA is lower than that of other functional monomers which indicates that analyte of interest interacts more strongly with MAA. The strong bond is required for formation of pre-polymer complex. This complex is responsible for the creation of the active sites in the polymer that bind the template. Hydrogen bond provides the strong intermolecular force and the strength of these bonds depends on the donor and acceptor as well as their environment [14,15]. On the other hand, choosing the suitable cross-linking monomer can greatly affect the MIP structure. Ethylene glycol dimethylacrylate (EGDMA) is a common cross-linker with two acrylate groups, leading to control the morphology of the polymer matrix and stabilize the imprinted binding sites. Generally, high cross-link ratios results in generating the permanently porous materials with higher adsorption capacity. Another parameter to obtain high selectivity MIP is porogenic solvent. Porogenic solvents with relatively low polarity, such as chloroform, tend to form favorable interactions between the template and monomers, resulting in materials with suitable pore structures and high surface areas [16,17]. To synthesize the MIP in this study, MAA, EGDMA, and THF were selected as functional monomer, cross-linker, and porogenic solvent, respectively. It should be noted that, the formation of optimized MIP for ceftriaxone has been successfully performed using 0.24 mL MAA, 6 mL EGDMA, 0.14 g template, and 14 mL solvent. Each of polymer components was optimized as follow. Optimization of MAA amount Due to the role of functional monomers for binding interactions in the MIP binding sites, they are used in excess relative to template moles, leading to form the suitable template-functional monomer assemblies in non-covalent molecular imprinting procedure. In order to maximize the imprinting effect, the functionalities of the template and functional monomer are matched in an appropriate mode, for example H-bond donor with H-bond acceptor. Therefore, it should be selected an optimal amount for functional monomer. According to Table I and Figure 2, although the amount of 0.24 mL MAA resulted in lower slope, it was 2 chosen as the optimum level because of the higher R coefficient (0.999).
38
Potentiometric Sensor Modified with Molecularly Imprinted Polymer for Determination of Ceftriaxone in Human Serum
Article
Table I. Optimization of the MAA amount for MIP composition; (C: 1.0×10⁻¹ mol L-1 to 5.0×10⁻³ mol L-1) Nº
MAA (mL)
EGDMA (mL)
AIBN (g)
Ceftriaxone (g)
R
1
0.15
4
0.33
0.55
0.997
29.52
2
0.24
4
0.33
0.55
0.999
37.71
3
0.34
4
0.33
0.55
0.91
58.85
4
0.4
4
0.33
0.55
0.81
35.9
5
0.5
4
0.33
0.55
0.81
34.07
2
Slope -1 (mv decade )
Figure 2. Plot of E vs Log (C) to optimized the amount of MAA in the composition of MIP; (MAA: 0.24 mL, EGDMA: 4 mL, AIBN: 0.33 g, template: 0.55 g, pH: 6.5) Optimization of EGDMA amount The ratio of functional monomer/cross-linker can affect the selectivity of imprinted polymer. The amount of cross-linker should be enough to control the morphology of the polymer, to stabilize the binding sites, and to access the adequate mechanical stability. On the other hand, due to the formation of rigid polymer by using the high degree of cross-linker, the removal of the template is very difficult. The adsorption capacity of polymer decreases at higher concentration of cross-linker, because a larger fraction of binding sites become inaccessible. These facts indicate that it is important the choosing of an optimum level for cross-linker to achieve a polymer network with the highest amount of capacity and selectivity [18]. 2 According to Table II, since the amount of 6 mL EGDMA resulted in low slope and the highest R coefficient (0.999), it was chosen as the optimum level. Table II. Optimization of the EGDMA amount for MIP composition; (C: 1.0×10⁻¹ to 5.0×10⁻³ mol L-1) Nº
MAA (mL)
EGDMA (mL)
AIBN (g)
Ceftriaxone (g)
R
Slope -1 (mv decade )
1
0.24
3
0.33
0.55
0.919
27.94
2
0.24
4
0.33
0.55
0.972
94.93
3
0.24
5
0.33
0.55
0.876
149.71
4
0.24
6
0.33
0.55
0.999
106.5
5
0.24
7
0.33
0.55
0.967
19.71
2
39
Khadem, M.; Norouzi, M. A.; Heydari, D.
Article Optimization of AIBN amount Many chemical initiators can be used as a source of radicals to synthesize the imprinted polymers. Initiator is used at low levels compared to the monomer. In fact, its amount is selected considering the moles of polymerizable double bonds. Given the importance of initiator to form the polymer, it should be added to the polymer mixture at an optimum level [19]. Table III shows the experiments to optimize the AIBN level. Table III. Optimization of the AIBN amount for MIP composition; (C: 1.0×10⁻¹ to 5.0×10⁻³ mol L-1) Nº
MAA (mL)
EGDMA (mL)
AIBN (g)
Ceftriaxone (g)
R
1
0.24
6
0.12
0.55
0.101
15.94
2
0.24
6
0.22
0.55
0.986
37.74
3
0.24
6
0.33
0.55
0.999
106.5
4
0.24
6
0.43
0.55
0.999
37.71
2
Slope -1 (mv decade )
Optimization of ceftriaxone amount The nature and level of template molecule are important in the molecular imprinting process. For compatibility with radical polymerization, template should be chemically inert under polymerization condition [20]. In this regard, the optimization results for template (ceftriaxone) level can be seen in Table IV.
Table IV. Optimization of the ceftriaxone amount for MIP composition; (C: 1.0×10⁻¹ to 5.0×10⁻³ mol L-1) Nº
MAA (mL)
EGDMA (mL)
AIBN (g)
Ceftriaxone (g)
R
Slope -1 (mv decade )
1
0.24
6
0.33
0.10
0.790
101.1
2
0.24
6
0.33
0.14
0.998
31.14
3
0.24
6
0.33
0.24
0.937
22.89
4
0.24
6
0.33
0.68
0.775
18.78
2
Optimization of membrane composition for sensor In chemical and biological sensors, connecting the recognition element to the analyte leads to produce a physical or chemical signal. This signal is then converted into an electrical output using a transducer. In this study, MIP plays the role of a selective recognition element in the potentiometric sensor. Dioctyl phthalate (DOP) was also selected as a plasticizer due to its low dielectric constant. It can increase the linear range of the sensor due to the enhancement of the analyte mobility [21,22]. In addition to the MIP, the levels of DOP and PVC can also affect the sensitivity and selectivity of the sensor. Since the characteristics of PVC membrane sensor can be considerably modified by changing the relative amount of its components, the optimization of membrane composition was performed. According to obtained results, the sensor showed the optimum response (R2: 0.999, slope: 49.19 mV decade-1) with the following composition; MIP: 0.07 g, PVC: 0.08 g, DOP: 0.2 mL, and THF: 2.5 mL.
40
Potentiometric Sensor Modified with Molecularly Imprinted Polymer for Determination of Ceftriaxone in Human Serum
Article
Effect of pH Since the response of membrane sensor can be dependent on pH, it was tested over the pH range of 3 -2 -1 to 8 at the ceftriaxone concentration of 1.0×10 mol L . As it can be seen in Figure 3, the maximum response of sensor obtained in the pH of 6.5 and this pH was selected for latter experiments. The response of MIP sensor depends on partial analyte deprotonation in the solutions and binding interaction of analyte to MIP can be attributed to the hydrogen bonds. At pH>7, the distribution of analyte is affected and it causes loss in the slope values. In fact, the analyte shows no potential response in improper pH values.
Figure 3. Effect of ceftriaxone solution pH on the sensor response (C: 1×10⁻² mol L-1) Response time After immersing in the ceftriaxone solutions, sensor requires an average time (the so called response time) to reach 95% of the magnitude of equilibrated potential. In this study, the practical response time was recorded by changing the ceftriaxone concentrations. Based on findings, the response time of 10 seconds was selected as the optimum level. Method validation The proposed modified electrode was successfully applied to plot the calibration curve under optimum -1 -3 -1 experimental conditions. The concentration interval for ceftriaxone was linear from 1×10 to 5×10 mol L . The graph was plotted using logarithm of sensor response versus the logarithm of concentrations 2 (Figure 4). The magnitude of the linear correlation coefficient (R ) was found to be 0.96 and the lowest -4 -1 detectable concentration (LOD) was 5.04×10 mol L (S/N = 3). In addition, the relative standard deviation (RSD) for five replicate experiments was calculated to be 2.68%. To determine the reproducibility of the modified sensor, it was dipped into the ceftriaxone solution with concentration of 1×10⁻³ mol L-1. The coefficient variation (CV) for six experiments was obtained to be 3.40%. Furthermore, the stability of the -3 -1 developed sensor was evaluated in a period of time for 1×10 mol L . It was found to be stable for about two months with no significant response deviation.
Figure 4. Calibration curve plotted for potentiometric determination of ceftriaxone using proposed modified sensor 41
Khadem, M.; Norouzi, M. A.; Heydari, D.
Article Determination of ceftriaxone in spiked human serum To investigate the applicability of the fabricated sensor to real sample, it was used to determine the ceftriaxone in serum samples. Different amounts of ceftriaxone were added to the serum samples, they were diluted by adding phosphate buffer (pH 6.5), and then their analysis was done using the sensor. There was no need for special pre-treatment steps prior to the potentiometric determination. Finally, ceftriaxone recoveries were calculated (Table V). The recoveries of the methods were in the range of 95 – 110% for the spiked serum. As it can be seen, the proposed sensor is sufficiently acceptable to determine the analyte of interest. Table V. The performance of the modified sensor in spiked human serum Sample
CF added -1 (mol L ) -2
0.95×10
-2
1.6×10
-2
2.2×10
-3
0.91×10
1.0×10 1.5×10 Human serum
CF found -1 (mol L )
2.0×10 1.0×10
-3
1.5×10
-3
2.0×10
-2
Recovery (%) 95
-2
107
-2
110
-3
91
-3
90.6
-3
102.5
1.36×10 2.05×10
CF: ceftriaxone
CONCLUSION From a practical point of view, the molecularly imprinted polymers (MIPs) provide an exciting and powerful technique compared to conventional methods. These materials can solve the selectivity problems, decrease the needs for sample pretreatment steps before analysis, and so, reduce the analysis time. Therefore, using MIPs as recognition elements in the composition of sensors is considered in the modern analytical chemistry. The proposed potentiometric sensor in this study was used to determine the ceftriaxone in serum samples. This modified sensor demonstrated the good dynamic range, short response time, and low detection limit. In this regard, the suggested sensor was successfully used for detection of ceftriaxone in real samples and it is proved that it can be applied to determine the ceftriaxone content of some pharmaceutical formulations. It is important the selectivity and resolution of developed methods to determine the analytes in complex matrices. Modified sensors as the fast, simple, sensitive, and inexpensive tools are applied for selective detection of compounds. th
nd
Manuscript received June 20, 2017; 1 revised version received Sept. 26, 2017; 2 revised version received Nov. 8, 2017; accepted Dec. 1, 2017.
42
Potentiometric Sensor Modified with Molecularly Imprinted Polymer for Determination of Ceftriaxone in Human Serum
Article
Article
REFERENCES 1. Bhaskar R. C. M.; Subbareddy, G. V. Int. J. ChemTech Res., 2013, 5, p 472. 2. Gladwin, M.; Trattler, B. Clinical microbiology made ridiculously simple, Miami: MedMaster, Chicago, 2007, chapter 8, p 49. 3. Al-Rawithi, S. H. R.; Raines, D. A.; AlShowaier, L.; Kurdi, W. J PharmBiomed Anal., 2000, 22, p 281. 4. Jungbluth, G.L.; Jusko, W.J.; J Pharm Sci, 1989, 78 (11), p 968. 5. Thangadurai, S.; Shukla, S. K.; Anjaneyulu, Y. Anal Sci, 2002, 18 (1), p 7. 6. Pospisilova, B.; Kubes, J. Pharmazie, 1988, 43 (4), p 246. 7. Saleh, G. A.; Askal, H. F.; Refaat, I. H.; Mohmed, N. A. S.T.P. Pharma Sci, 2002, 12 (2), p 133. 8. El-Walil, A. M.; Gazy, A. A.; Belal, F.; Khamis, F. Spectrosc Lett, 2000, 36 (6), p 931. 9. Gaspar, A.; Andrási, M.; Kardos, S. J Chromatogr B, 2002, 775 (2), p 239. 10. Khadem, M.; Faridbod, F.; Norouzi, P.; Rahimi F. A.; Ganjali, M. R.; Shahtaheri, S. J. J Iran Chem Soc, 2016, 13, p 2077. 11. Khadem, M.; Faridbod, F.; Norouzi, P.; Rahimi F., A.; Ganjali, M. R.; Shahtaheri, S. J.; Yarahmadi, R. Electroanalysis, 2017, 29 (3), p 708. 12. Alizadeh, T.; Akhoundian, M. Electrochim. Acta, 2010, 55, p 3477. 13. Rongning L. B.; Koua, L.; Chen, Z.; Qina, W. Sens. Actuators, B, 2013, 188, p 972. 14. Yan, M.; Ramström, O. Molecularly Imprinted Materials, Science and Technology, CRC Press, Taylor and Francis group, New York, 2004, p 35. 15. Hawari, H. F.; Samsudin, N. M.; Ahmad, M. N.; Shakaff, A. Y. M.; Ghani, S. A.; Wahab, Y.; Za’aba, S. K.; Akitsu, T. Procedia Chem., 2012, 6, p 100. 16. Turkewitsch, P.; Wandelt, B.; Darling, G. D.; Powell, W. S. Anal. Chem, 1996, 70, p 2025 17. Hongyuan, Y.; Kyung, H. R.; Int. J. Mol. Sci, 2006, 7, p 155. 18. Yeon-Hum, Y.; Ho-Kyong, S.; Soon-Do, Y. J Mater Sci, 2009, 44, p 6206. 19. Muldoon, M.T.; Stanker, L. H. Anal. Chem, 1995, 69, p 803. 20. Ellwanger, A.; Bayoudh, S.; Crecenzi, C.; Karlsson, et al. Analyst, 2001, 126, p 784. 21. Arvand, M.; Hashemi, M. M.; J Braz Chem Soc, 2002, 23 (3), p 392. 22. Faridbod, F.; Larijani, B.; Ganjali, M. R.; Norouzi. P. Int J Electrochem Sci, 2012, 7, p 10404.
43
Br. J. Anal. Chem., 2017, 4 (16), pp 44-49
Feature
Download
Farmacannabis-UFRJ: The first laboratory in Brazil to analyze therapeutic products derived from Cannabis
Virgínia Martins Carvalho Associate Professor Faculty of Pharmacy, Federal University of Rio de Janeiro, RJ, Brazil Farmacannabis-UFRJ Project Coordinator virginiamc@pharma.ufrj.br
Therapeutic treatment using Cannabis extracts is sometimes the only alternative in the control of intractable epilepsy and other serious illnesses. Cannabis sativa is a banned plant in Brazil, but the import of Cannabis extracts has been authorized for medical use since 2015, and the first safeguards to cultivate Cannabis for medicinal purposes were obtained in 2016. Although sanitary regulations created the demand for the chemical analysis of Cannabis products, all laboratories in Brazil that analyze Cannabis and Cannabis products have forensic purposes, and laboratories focused on the monitoring of therapies are a medical necessity. To assess the safety of Cannabis derivative therapies, the Laboratory of Analytical Toxicology at the Faculty of Pharmacy, Federal University of Rio de Janeiro (LATOXFAR-UFRJ) was structured, and is the first laboratory in Brazil to monitor medical treatment using phytocannabinoids. Through the project Farmacannabis, the LATOX-FAR-UFRJ analyzes Cannabis and its products to monitor the safety of therapies, and to minimize the risk of improper preparation of its extracts by people without pharmaceutical training. Most of the patients are children with intractable epilepsy and autism, Researchers at the LATOX-FAR-UFRJ but it also serves patients with cancer, chronic pain, Alzheimer's, Parkinson's and other diseases. The medicinal properties of the plant from the Cannabis genus have been described in the Chinese Pharmacopoeia Pen-Ts'ao Ching for 2000 years, considered the first pharmacopoeia known in the world, and described by the Assyrians for 3000 years [1]. The book “Dicionário de Plantas Úteis do Brasil e das Exóticas Cultivadas”, a compendium of references in the pharmaceutical area in Brazil, published by M. Pio Côrrea in 1926 [2], describes the botanical characteristic and medicinal properties of Cannabis sativa L. being named generically by "true hemp". The “Farmacopeia Brasileira” published in 1929 [3] describes the Cannabis sativa Linnaeus var. indica, with the generic names "maconha", "meconha", "diamba" and "cannabis", indicating the flowered summits as a raw material in preparing the Cannabis officinalis extract or fluid extract of India hemp, hemp powder and the Indian hemp dye. In forensic analysis guidelines, Cannabis is considered to be monospecific (Cannabis sativa L.) however, Cannabis is divided into several subspecies (C. sativa subsp. sativa, C. sativa subsp. indica, C. sativa subsp. ruderalis, C. sativa subsp. spontanea, C. sativa subsp. kafiristanca). The chemical and morphological 44
Feature distinctions of the subspecies are often not readily discernible and are not required for forensic purposes (UNODC, 2009). The main active compounds present in the plant are the cannabinoid substances, of which the more abundant being Δ9 and Δ8-tetrahydrocannabinol (THC), cannabinol (CBN) and the cannabidiol (CBD) that allow the identification of the plant chemistry. The THC and CBD can still be identified in its acidic forms (CBDA and THCA) which are converted to the neutral forms by heating. After the elucidation of the CBD structure [4] and identification of Δ9-THC, one of the substances responsible for their psychoactive and euphoric effects [5], several scientific papers have been developed showing the pharmacological and clinical properties of its compounds [6-9]. The pharmacological effects are attributed to the interaction of cannabinoids with cannabinoid receptors mainly distributed in the central nervous system (CNS) known as CB1, and peripheral nervous system and immune system known as CB2 [10]. CBD offers paradoxical pharmacological effects in relation to the effects of Δ9-THC, while the former acts as a depressant and 9 anxiolytic, the second acts as a stimulant and hallucinogen [8]. The Δ -THC binds to the CB1 and CB2 receptors acting as a partial agonist, and seems to have a mixed neural activity, excitatory and inhibitory, in 9 different areas of the brain, showing they do not only act in specific cannabinoid receptors [11]. Unlike Δ THC, CBD has low affinity for CB1 and CB2 receptors, its action seems to result from an increase in anandamide, the endogenous cannabinoid neurotransmitter [12], shows anxyolytic [13] and anticonvulsant effects [14,15]. The pharmacological potential of cannabinoids in the treatment of Parkinson's disease [16], schizophrenia [17,18], Alzheimer's [19-21], neuropathic pain present in multiple sclerosis [9], rheumatoid arthritis [22], and epilepsy [15,23,24] has been demonstrated. Probably, the first scientific work which has shown the effectiveness of the CBD in the control of seizures, was published in 1980 by the group of Elizaldo Carlini, professor at the Federal University of São Paulo, together with Raphael Mechoulam, professor at the Hebrew University [14]. Currently extracts rich in CBD are being used at the clinic in the management of refractory epilepsy. After a long period in which the production of Cannabis based medicines was banned in Brazil, international experience stimulated the search for treatment of epilepsy with extracts from hemp, a flagship experience was the case of British girl, Charlotte Figi, who suffered from multiple episodes of convulsions since the first months of life, and diagnosed with Dravet syndrome when she was 2.5 years old. Her family, discouraged with the ineffectiveness of traditional pharmaceutical drugs, started administrating a Cannabis extract in Colorado, United States of America (USA). The Cannabis treatment controlled the epilepsy in the first week. In the USA, hemp extract has been approved by the Food and Drug Administration (FDA) as a food supplement, and the medical use of Cannabis in California was approved in 1996. Charlotte's Cannabis treatment encouraged mothers, parents, patients and activists to put pressure on the regulation of medical Cannabis use in Brazil. The “Conselho Federal de Medicina” authorized the compassionate prescription of CBD in December 2014, and the “Agência Nacional de Vigilância Sanitária”, Brazilian regulatory agency (ANVISA) authorized its importation for personal medical use in 2015. In March 2016, by determination of Federal prosecutors to answer the plea of a patient, ANVISA has authorized the importation for personal medical use of the plant Cannabis sativa L, parts of the plant and THC, and partially corrected an inconsistency contained in regulating controlled substances (Portaria 344/98) from the year 2000, update dronabinol (Marinol™) on the list of stimulant drugs. Dronabinol is the synthetic THC structure identical to phytocannabinoid THC indicated primarily to the control of nausea and vomiting in patients undergoing through chemotherapy treatment. In addition, the first Cannabis extract named Mevatyl™ (Sativex™ in other countries) was registered as a pharmaceutical drug by ANVISA in 2017, while kept the plant and its active ingredients on the proscribed list (of prohibited drugs). Imported extracts are classified as “hemp”, that is plants of the genus Cannabis rich in CBD and poor in THC usually used as fiber. International law determined that the concentration of THC is less than 0.3% for the registration of products as dietary supplements and cosmetics. On the other hand, in Brazil emerges the use of handmade products and trade in clandestine products that are prepared with different varieties of Cannabis have not yet been characterized scientifically. Many people carry out experiments to produce Cannabis products for recreational and medical use, and have empirical knowledge in their own language of that which has been identified as "Cannabis culture", 45
Feature they claim to differ in the macroscopic feature, organoleptic characteristics, develop agronomic methods and taxonomic classifications based on feeling and personal experience during use, and describe compositions and levels of active ingredients. Although this empirical knowledge is being an instrument for the remedies of those who need these medicinal extracts, research and development is fully needed, along with scientific methodology, from the description of the varieties of Cannabis available in the national market, to the standard raw vegetal material. Cannabis features at least 50 phytocannabinoids and that, in addition to this variety of substances, the effect can be determined by the acidic or neutral form of the same cannabinoids such as THCA which is converted to THC by heating. The preparation technique of the extract (type of solvent extraction and temperature) is decisive in the final concentration of THC and THCA [25] since its concentrations can be modulated by heating. If forensic toxicology gas chromatography is sufficient to analyzing cannabinoid compounds, for medical purposes the decarboxylation of acid forms is a technical limitation easily solved by the use of liquid chromatography. To monitor Cannabis therapies and to give pharmaceutical support to patients, the Farmacannabis project was created at LATOX-FAR-UFRJ, where Cannabis products are analyzed and the production of homemade extracts is assisted, and medicinal extracts and plants used in its preparation are analyzed to determine the cannabinoids, toxic metal levels and microbiological quality. For structuring the project, many barriers were overcome with the persuasion of professional peers, that with professional ethics and a commitment to public health, agreed that it is necessary to brave prejudices in order to study and evaluate the safety of Cannabis treatments. Currently, Farmacannabis has ten PhD. Professors from pharmacy, neurosciences, botanic, natural products and juridical areas, several students and technical professionals, partnerships with public institutions like “Instituto de Tecnologia em Fármacos, Farmanguinhos, Fiocruz” (Far-Fiocruz), and “Instituto Nacional de Controle de Qualidade em Saúde, Fiocruz” (INCQS-Fiocruz), and partnerships with non-governmental Organizations (NGOs), such as Some researchers of the Farmacannabis project “Associação Brasileira para Cannabis” (ABRACANNABIS) and “Associação de Apoio à Pesquisa e Pacientes de Cannabis Medicinal” (APEPI). Financial support was obtained by collective funding (crowdfunding) and more than 800 people backed the project, with the collection of about US $ 30,000. Furthermore, Farmacannabis received financial support from the Manserv Company, a resident enterprise from Technological Park in UFRJ, and the technical support of the Brazilian company Nova Analítica. With strategically worked idea, the first laboratory in Brazil that officially analyzes medical Cannabis extracts was structured. Farmacannabis' preliminary results, obtained by the high-performance liquid chromatographic method development, showed that the commercial imported extracts have high CBD content with a chemical profile very different from homemade and illicit trade products (Tables I and II). In general, the homemade products showed low cannabinoid concentrations and are rich in THC, except for the Harle-Tsu variety with hemp profile introduced between patients by ABRACANNABIS. Hemp varieties are probably rare in Brazil because of the Cannabis cultivations which have been turned over to recreational use, and the agronomic techniques have been employed for the production of varieties rich in THC. The illegal Cannabis samples seized in the United States of America from 1995 to 2014 increased THC content of 5% to 15% on average and the THC/CBD ratio increased from 14 times in 1995 to about 80 times in 2014 [26]. The development of phytocannabinoid medicine in Brazil depends on the studies of available varieties of Cannabis that can become active pharmaceutical ingredients, and in this way, analytical chemistry laboratories and toxicological analyzes need to be prepared for the Cannabis pharmaceutical market that requires technical specificities different from the forensic application. 46
Feature Table I. Preliminary results from commercial imported products analyzed by HPLC-DAD Pure CBD
Concentration [mg/mL or mg/g]
Origin
Form/vehicle
Labeled content
CBDA
CBD
THCA
CBN
THC
USA
Oil
200 mg/mL
ND
210.45
ND
ND
ND
USA
Oil
50 mg/mL
ND
13.17
ND
0.45
ND
USA
Oil
50 mg/mL
ND
77.45
ND
ND
ND
USA
Oil
50 mg/mL
ND
41.17
1.10
0.40
ND
USA
Oil
100 mg/mL
ND
104.13
ND
ND
ND
USA
Oil
200 mg/mL
ND
284.90
ND
ND
ND
USA
Oil
100 mg/mL
ND
88.40
ND
ND
ND
USA
Oil
100 mg/mL
ND
90.70
ND
ND
ND
CBD Enriched Extracts
CBDA
CBD
THCA
CBN
THC
USA
Oil
50 mg/mL
ND
47.88
ND
0.75
3.30
USA
Oil
60 mg/mL
ND
39.34
ND
ND
1.44
USA
Oil
61 mg/mL
ND
40.67
ND
ND
1.74
Canada
Oil
24.97 mg/mL
1.15
21.14
0.56
0.30
2.16
USA
Resin
170 mg/g
ND
121.93
1.00
0.42
2.31
USA
Resin
160 mg/g THC < 9 mg/g
4.49
142.48
ND
1.32
8.15
USA
Resin
240 mg/g
1.97
118.81
ND
ND
1.60
USA
Capsule
ND
ND
80.87
ND
ND
4.12
USA
Capsule
50 mg/cap
ND
95.88
ND
ND
4.33
ND: Not detected (Limit of Detection = 0.01 mg/mL or 0.01 mg/g for resin); USA: United States of America.
47
Feature Table II. Preliminary results from homemade or clandestine products analyzed by HPLC-DAD Concentration [mg/mL or mg/g]
THC enriched extracts or THC-CBD (1:1) Origin Form/vehicle
Cannabis strain
CBDA
CBD
THCA
CBN
THC
RJ
Oil
Cronic
ND
0.10
2.36
ND
1.64
RJ
Oil
Pur Kush
ND
0.10
3.65
ND
1.39
RJ
Oil
Cinderela
ND
ND
0.80
ND
2.19
RJ
Oil
Cinderela
ND
ND
1.16
ND
2.64
RJ
Oil
Wildfire
ND
0.97
ND
ND
6.39
RJ
Oil
Harletsu oil + Cinderela resin
3.35
2.59
0.74
0.40
2.83
RJ
Oil
Hybrid:CBD skunk haze + LSD
3.81
ND
2.39
ND
0.10
SC
Oil
UN
0.10
0.61
2.65
0.11
12.90
SC
Oil
UN
ND
2.20
0.90
1.03
44.85
SC
Oil
UN
0.10
1.36
0.71
0.77
29.60
RJ
Resin
Cinderela
0.10
0.33
0.14
8.42
28.30
SC
Resin
UN
ND
16.67
6.32
5.43
338.22
SC
Resin
UN
0.75
14.59
0.70
4.20
314.12
SC
Resin
UN
ND
14.05
1.02
5.84
303.25
CBD enriched extracts RJ
Oil
Harletsu
2.32
1.06
0.10
ND
ND
RJ
Oil
Harletsu
2.67
1.21
0.10
ND
0.10
RJ
Oil
Harletsu
4.33
3.30
0.11
ND
0.25
RJ
Oil
Harletsu
0.24
4.77
ND
0.10
0.40
RJ
Oil
Harletsu
0.10
7.95*
ND
ND
0.33
RJ
Oil
Harletsu
4.25
17.43*
ND
0.15
0.73
Extracts with cannabinoids at trace level PB
Glicerin
UN
ND
ND
0.20
ND
0.14
PB
Glicerin
UN
ND
ND
0.20
ND
0.14
PB
Glicerin
UN
0.30
0.10
0.12
ND
0.10
PB
Glicerin
UN
0.40
0.14
0.10
ND
0.12
PB
Glicerin
UN
0.21
0.10
0.10
ND
0.10
PB
Glicerin
UN
0.21
0.10
0.10
ND
0.10
PB
Glicerin
UN
ND
ND
0.19
ND
0.10
PB
Glicerin
UN
ND
0.10
0.21
0.05
0.16
PB
Glicerin
UN
0.04
0.03
0.04
ND
0.02
PB
Water/spray
UN
0.05
ND
0.20
ND
0.06
ND: Not detected (Limit of Detection = 0.01 mg/mL or 0.01 mg/g for resin); PB: ParaÃba, BR; RJ: Rio de Janeiro, BR; SC: Santa Catarina, BR; UN: unknown; *Prepared by alcoholic extraction with patients in LATOX with pharmaceutical supervision.
48
Feature ACKNOWLEDGMENTS The Farmacannabis' coordinator is grateful to Dr. Ernesto Diaz Rocha, MS. Fábio Luiz Costa de Souza Release and Andrey Fabiano Lourenço de Aguiar for the laboratorial and analytical help. 5()(5(1&(6 1. Honório, K. M.; Arroio, A.; Da Silva, A. B. F. Quim. Nova, 2006, 29 (2), pp 318-325. 2. Corrêa, M. P. Dicionário das Plantas Úteis do Brasil e das Exóticas Cultivadas. Imprensa Nacional, Rio de Janeiro, 1926, pp 471-474. 3. Silva R. A. D. Pharmacopeia dos Estados Unidos do Brasil. Companhia Editora Nacional, Rio de Janeiro, 1929, pp 160-161. 4. Mechoulam, R.; Shvo, Y. Tetrahedron, 1963, 19 (12), pp 2073-2078. 5. Gaoni, Y.; Mechoulam, R. J. Am. Chem. Soc., 1964, 86 (8), pp 1646-1647. 6. Mechoulam, R.; Shani, A.; Edery, H.; Grunfeld, Y. Science, 1970, 169 (945), pp 611-612. 7. Ilan, A. B.; Gevins, A.; Coleman, M.; ElSohly, M. A.; De W it, H. Behav. Pharmacol., 2005,16, pp 48796. 8. Mechoulam, R.; Peters, M.; Murillo-Rodriguez, E.; Hanus, L. O. Chem. Biodivers., 2007, 4, pp 16781692. 9. W hiting, P. F.; W olff, R. F.; Deshpande S.; Di Nisio, M.; Duffy, S.; Hernandez, A. V.; Keurenties, J. C.; Lang, S.; MIsso, K.; Ryders, S.; Schmidlkofer, S.; W eswood, M.; Kleijnen, J. J. Am. Med. Assoc., 2015, 313 (24), pp 2456-2473. 10. Leweke, F. M.; Koethe, D. Addict. Biol., 2008, 13, pp 264–275. 11. Pertwee, R. G. Br. J. Pharmacol., 2008, 153, pp 199–215. 12. Mechoulam, R.; Panikashvili, D.; Shohami, E. Trends Mol. Med., 2002, 8, pp 58–61. 13. Fogaça, M. V.; Reis, F. M.; Campos, A. C.; Guimarães, F. S. Eur. Neuropsychopharmacol., 2014, 24 (3), pp 410-419. 14. Cunha J. M.; Carlini, E. A.; Pereira, A. E.; Ramos, O. L.; Pimentel, C.; Gagliardi R.; Sanvito W . L.; Lander, N.; Mechoulam, R. Pharmacology, 1980, 21, pp 175-185. 15. Tzadok, M.; Ulieal-Siboni, S.; Linder, I.; Kramer, U.; Epstein, O.; Menascu, S.; Nissenkorn, A.; Yosef, O. B.; Hyman, E.; Granot, D.; Dro, M.; Lerman-Sague, T.; Ben-Zeev, B. Seizure, 2016, 35, pp 41-44. 16. Zuardi, A. W .; Crippa, J. A.; Hallak, J. E.; Pinto, J. O.; Chagas, M. H.; Rodrigues, G. G.; Dursun, S. M.; Tumas, V. J. Psychopharmacol., 2009, 23 (8), pp 979-983. 17. Zuardi, A. W .; Hallak, J. E.; Dursun, S. M.; Morais, S. L.; Sanches, R. F.; Musty, R. E.; Crippa, J. A. J Psychopharmacol., 2006, 20 (5), pp 683-686. 18. Leweke, F. M.; Piomelli, D.; Pahlisch, F.; Muhl, D.; Gerth, C. W ., Hoyer, C.; Klosterkötter, J.; Hellmich, M; Koethe, D. Transl. Psychiatry, 2012, pp 1-6. 19. Iuvone, T.; Esposito, G.; Esposito, R.; Santamaria, R.; Di Rosa, K.; Izzo, A. A. J Neurochem., 2004, 89 (1), pp 134-41. 20. Esposito, G.; De Filippis, D.; Maiuri, M. C.; De Stefano, D.; Carnuccio, R.; Iuvone, T. Neurosci. Lett., 2006, 399 (1-2), pp 91-95. 21. Esposito, G.; Scuderi, C.; Savani, C.; Steardo, L. Jr.; De Filippis, D.; Cottone, P.; Iuvone, T.; Cuomo, V.; Steardo, L. Br. J. Pharmacol., 2007, 151 (8), pp 1272-1279. 22. Blake, D. R.; Robson, P.; Ho, M.; Jubb, M. W .; McCabe, C. S. Rheumatology, 2006, 45, pp 50–52. 23. Hill, A. J.; W illiams, C. M.; W halley, B. J.; Stephens, G. J. Pharmacol. Ther., 2012, 133, pp 79–97. 24. Hussain, S. A.; Zhou, R.; Jacobson, C.; W eng, J.; Cheng, E.; Lav, J.; Hung, P.; Lerner, J. T.; Sankar, R. Epilepsy Behav., 2015, 47, pp 138–141. 25. Romano, L. L.; Hazekamp, A. Cannabinoids, 2013, 1 (1), pp 1-11. 26. ElSohly, M. A.; Mehmedic, A.; Foster, S.; Gon, C.; Chandra, S.; Church, J. Biol. Psychiatry, 2016, 79, pp 613-619. 49
Br. J. Anal. Chem., 2017, 4 (16), pp 50-53
Feature
Download
Unicamp Institute of Chemistry celebrates 50 years
Institute of Chemistry, IQ-Unicamp, Campinas, SP, Brazil - Photo: IQ 50 years
The Unicamp Institute of Chemistry is one of the centers of excellence in teaching and research of Chemistry in Brazil, and, increasingly worldwide. This forefront institution in the production of knowledge celebrates its fiftieth year of existence in 2017. Created in 1967, IQ-Unicamp has established itself as one of the main teaching and research centers in several areas of Chemistry, achieving international recognition. It has built this prestige through the excellence of teachers and students, who represent IQ in academia and in entities and associations representing science.
"Currently, IQ-Unicamp is one of the great Brazilian research centers that manages qualified human resources in the main areas of Chemistry, and has influence all over the country and abroad. A large part of the chemistry professionals who work in the country have, directly or indirectly, some relation with IQ-Unicamp” emphasized Prof. Dr. Lauro Kubota, current director of the Institute. One of the commemorative actions of the 50 years of IQUnicamp was held by the Institute Library (BIQ), which since September 5 has opened the Permanent Exhibition "Scientific Production of IQ: highlights in the last 50 years." On the same day, a blog was also launched commemorating IQ's 50th anniversary.
Prof. Lauro Kubota assumed the position of director of the Unicamp's Institute of Chemistry in 2014. Photo: Luciene Campos
The blog aims to make a virtual exhibition that tells part of the history, curiosities and honors that the great professionals, who consolidated the IQ as one of the most prestigious poles of research and training in the main areas of Chemistry, received. Visit the blog at: http://biqunicamp.wixsite.com/exposicaoiq50anos
Permanent exhibition "IQ's Scientific production: highlights in the last 50 years" in the IQ-Unicamp Library. Photo: IQ 50 years.
50
Feature In addition to the commemorative actions carried out by BIQ, the IQ, during this year, is holding numerous commemorative events for its 50 years. "I believe that celebrating the 50 years of IQ, which has had a successful path, needs to be remarkable, to recognize the achievements made by the people who contributed throughout this period and to reflect and plan the future," said Kubota. Check out some of the events that have already been held to celebrate this milestone: "Arraiá dos Cinquentão" – A traditional July Brazilian party with the middle age In July, the entire IQ community was invited to participate in the "Arraiá dos Cinquentão", held in celebration of the 50th anniversary of the Institute. Everyone who honored the event had the opportunity to play bingo, participate in traditional dances and enjoy a delicious traditional menu, and, of course, be part of the 50 years of IQ. 50 years in 5 km In September, the "50 years in 5 km" walk was held, th another event commemorating the 50 anniversary of IQUnicamp. The event was aimed at the entire community of IQ and Unicamp, with the presence of teachers, employees, students and their families.
Tree planting marking the beginning of spring Also in September, IQ made one more event with the beginning of spring, to welcome the season of flowers. The community participated in a picnic on the Boulevard, with the participation and support of the Sustainable University Manager Group - GGUS. Soon afterward, the Institute had the pleasure of receiving the “Zíper na Boca” Coral in a theatrical presentation, with several films of different themes, being greatly appreciated by all who attended. Lastly, a yellow “Ipê” tree was planted to mark the 50th anniversary of the Institute of Chemistry. The participants were still given a pencil with white fig seeds, so that even more trees could be planted elsewhere.
Participants warming-up before the start of the race - Photo: IQ 50 years
Yellow “Ipê” tree planting Photo: Milene Heloisa Martins
Exhibition "Olhares do IQ" - Looks of IQ The exhibition "Olhares do IQ", which showed the active participation of community members, was opened on September 5, 2017. Students, teachers and technical-administrative staff of the Institute of Chemistry, who were invited to present papers on IQ and Chemistry, sent the photographs. The exhibition is displayed in the Block D lobby of the Institute of Chemistry. Exhibition "Olhares do IQ" Photo: IQ 50 years
51
Feature Chemistry in 50 assays The book "Química em 50 Ensaios " (Chemistry in 50 assays) was launched on September 22, also in commemoration of th the 50 anniversary of IQ. "It is a collection of assays that are carried out throughout the course of chemistry and cover the first experiments in chemistry teaching labs, until experiments on new proposals" explained Professor Ljubica Tasić, head of the Department of Organic Chemistry and organizer of the book. "Química em 50 Ensaios " was elaborated over two years and was written by more than 40 authors, among them are professors, guests and technicians of IQ laboratories.
Launch of the book "Química em 50 Ensaios ", commemorating the 50th anniversary of IQ Photo: IQ 50 years
The experiments reported in the publication are divided into six chapters, in a multidisciplinary way, leaving aside the division of the themes of classical chemistry. According to Ljubica, the work can be used as a reference that students will be able to consult throughout their graduation. "We believe that a textbook dedicated to students will be a way to motivate them to study chemistry, although it is a challenging science", Ljubica highlighted. Released by Átomo publisher, "Química em 50 Ensaios " is on sale at the main bookstores. It can be used as a textbook at Unicamp and other educational institutions. Also in the book is told a brief history of the Institute of Chemistry and its importance for the development of the university. More information can be found on the publisher's website: http://www.grupoatomoealinea.com.br/quimica-em-50-ensaios.html IQ 50-Year Logo A special logo was created to celebrate the 50 years, elaborated by the student Guilherme Crispim de Faria Cruz and chosen by the Commission of the 50 years of IQ. The commemorative logo brings the evolution of the history of Chemistry from alchemy to the first atomic model, thus tracing a parallel with the development of IQ. The use of elements inherited from the official IQ logo – like the blue color and the curve that cuts the number "5" into two parts - ensures that the identity of the IQ is maintained. The typography chosen maintains the sophistication of the official logo, but brings a commemorative air. His calligraphy-inspired forms portray the time of the alchemists. The dozens of important prizes won reflect the years of dedication. "Chemistry in Action" Program The “Chemistry in Action” program was created from a proposal to disseminate Chemistry to students of basic education and to provide continuing education for teachers. This year, the VII edition of "Chemistry th in Action for Students" was also held as part of the 50 anniversary celebrations of IQ-Unicamp. The program brings high school students and teachers to the IQ, for specific schedules, on vacation. All actions involve IQ-Unicamp faculty and students for organization and execution. Video title: General Record - Chemistry in Action 2017 / https://www.youtube.com/watch?v=xYMC2GsI1KQ Source: Video produced by the Secretariat of Communication - Unicamp TV 16th SIMPEQ and SIMPEQuinho th This year, the 16 SIMPEQ and SIMPEQuinho took place on October 20 and 21 at the Unicamp Institute th of Chemistry. SIMPEQ is an event for teachers who teach chemistry in high school and is in its 16 edition. It is an initiative to promote the necessary interaction between university members and high school teachers, which has been on-going since 2001. SIMPEQuinho is open to students from the ninth year of elementary school, in addition to high school students. It is a space for students and teachers participating in SIMPEQ. During the event there were specific activities for the students, with the objective of integrating them in the context of Chemistry and IQ-Unicamp. 52
Feature “Frontiers of Research in Chemistry" As part of the IQ-Unicamp celebrations for its 50 years, an event that addressed the paths of research in chemistry was held from October 26 to 27. The event was attended by such names as: Prof. Bjorn Lindman, Prof. Carlos H. Brito Cruz, Prof. Elias Zagatto, Prof. Janusz Pawliszyn, Prof. Mozart N. Ramos, Prof. Richard G. Weiss and Prof. Roberto Rinaldi. In closing, the guests honored the launch of the book “Excelência em Pesquisa: 50 anos do Instituto de Química da Unicamp” (in literal translation - Excellence in Research: 50 years of the Unicamp Institute of Chemistry), which was edited and coordinated by Prof. Ronaldo Aloise Pilli (ISBN: 978-85-68505-02-1).
53
Br. J. Anal. Chem., 2017, 4 (16), pp 54-58
Feature
Download
The Brazilian Society of Chemistry celebrates 40 years with historical scientific event th
Sir Fraser Stoddart, Nobel laureate of Chemistry 2016, gave a lecture at IUPAC 2017 Photo: mci eventos
The 40 Annual Meeting of the Brazilian Chemistry th Society and the 46 International Union of Pure and Applied Chemistry (IUPAC) World Congress were held in the city of São Paulo between July 9 and 14, 2017. The event received about three thousand five hundred chemists from all continents and also had the presence of three Nobel Prize winners. The Brazilian Chemistry Society (SBQ) was founded in 1977 and is currently one of the largest and most representative scientific associations in Latin America. The annual SBQ meeting, which has taken place every year since its foundation, is the most traditional event in chemistry in Brazil and is among the largest in Latin America.
th
In 2017, to commemorate its 40 anniversary, the SBQ organized its annual meeting in conjunction with the most important global event in Chemistry, the IUPAC World Chemistry Congress. "Brazil and South America already have their places guaranteed on the world map of Chemistry. IUPAC 2017 is leaving a tangible legacy, which should be in favor of and for the good of society, our researchers, teachers, and especially our young students, who represent our future", said Professor Adriano D. Andricopulo (IFSCUSP), president of the Congress Organizing Committee. It was the first time that IUPAC World Chemistry Congress was held in the South American continent, and the chemical companies of the countries with the highest production of the chemical industry in the world, such as China, USA, Japan, Korea, Germany, India, France and Brazil were present. One of the great innovations of the event was the introduction of an innovative 360° stage system that allowed participants to follow more than one activity without having to move. Up to 8 conferences were held at the same time in a single space, without rooms or partitions. The headphone system also gave viewers the ability to switch audio channels. About 700 scientific activities were carried out, incorporating all areas of Chemistry. "It was a perfect event, at a high scientific level, with technological 360° stage allowed participants to follow more innovation and a large number of participants", said the than one activity without having to move. SBQ president, Professor Aldo Zarbin (UFPR). Photo: mci eventos "The IUPAC Congress showed the size of the SBQ and Brazilian chemistry, and now we have the enormous challenge of keeping the flame alive in such a difficult period, with the cutting off of resources in science and technology in Brazil", he added.
54
Feature
Professor Robert Huber of the Max Planck Institute, Nobel Prize of 1988. Photo: mci events
The World Congress of Chemistry presented 2320 scientific works, being analytical chemistry and synthesis the most popular subjects, with 281 and 277 works respectively. The largest foreign delegations were the North American and the Canadian. The opening ceremony was held for an estimated audience of 2500 people and was made by Professor Robert Huber of the Max Planck Institute, a 1988 Nobel Prize for his work on determining the three-dimensional structure of a photosynthetic reaction center.
The 2016 Nobel Prize for Chemistry, Sir Fraser Stoddart, also participated and gave a lecture in which he addressed his nanomachines based on mechanical bonds - which he compared to aviation in 1927. "The Nobel was in recognition of grassroots research. Before Charles Lindbergh crossed the Atlantic we did not know where the planes could take us. We now know that mechanical linkages are going to change the world, but we still have no idea of the applications to come, other than the obvious ones like medicine and the information technology industry", he said. In addition, Sir Fraser spoke passionately about love, family, freedom, politics, creativity, art and chemistry. In 1991, Sir Fraser was able to attach a molecular ring to a molecular axis and then was able to control the ring's motion along the axis by establishing a new field in chemistry. He published more than 1200 articles and guided more than 400 doctoral students and postdocs. Stoddart shared the 2016 Nobel Prize in Chemistry with Jean-Pierre Sauvage and Bernard L. Feringa for the design and production of molecular machines, or nanomachines, a breakthrough that paved the way for the world's first intelligent materials. According to the Nobel committee, the trio developed "the smallest machines in the world". The technology is already being used to create micro-robots and materials that self-repair without the need for human intervention. On the afternoon after his conference, Sir Fraser spent almost three hours taking pictures and signing autographs like a pop star. "I'm excited. It's something unheard of in my life", he said between autographs. The 46th World Chemistry Congress, also had the 1988 Nobel Prize conferences, Robert Huber, and 2009, Ada Yonath. Several topics, in which applied chemistry is most obviously reflected in people's lives, were discussed at the 46th World Chemistry Congress. Among all symposia and plenary conferences, in addition to the questions of basic Sir Fraser Stoddart taking pictures and signing science, there were many debates about medicine, energy, autographs. Photo: mci events industry and vectors of scientific innovation. The 40th Annual Meeting of the SBQ, held within the World Chemistry Congress, valued the traditional coordinated sessions of the scientific divisions. There were 12 sessions with 96 presentations of undergraduate, graduate and research students. The works were selected only among members of the SBQ.
55
Feature One of the selected students was Giulia Murbach de Oliveira, 20, who is attending the third year of graduation from the Federal University of São Paulo (Unifesp). "I was ready to present my work on the diffusion of ionic liquid into charged cracks in the poster session. It was a surprise because I did not expect to be nominated”, said the student. The student pointed out that she was already preparing for her first major scientific event, when she was surprised by an invitation from the SBQ to make her presentation at the coordinated session of Physicochemical / Theoretical Giulia Murbach de Oliveira during her Chemistry. "I'm very critical and I was a bit nervous during the presentation at the coordinated session of Physicochemical / Theoretical Chemistry. presentation, but my colleagues said I did well. It was a very Photo: mci events rewarding experience”, she said. For the pharmacist Danilo Pereira de Sant'ana, who is graduated from UFRJ, with a doctorate from Unicamp and researches in Montpelier and Berkeley, the 40 years of the SBQ also had a special flavor. His work was selected for the organic synthesis symposium of the World Chemistry Congress. "It's a fantastic experience. While giving some apprehension to present to the international community in English, it is very gratifying to have the work selected among so many", said Sant'ana. Young chemists are the future of the scientific community An important feature of the SBQ Annual Meetings is the expressive participation of young Brazilian chemists. The opportunity to share experiences with young talent from different cultures as well as meet well established chemists from around the world. Moreover, during the event, a group of young scientists held two symposiums, one on Environmental / Green Chemistry and one on Intellectual Property. In addition, the International Younger Chemists Network (IYCN) held its inaugural meeting with a poster session on the chemicals. IYCN was established to "communicate, collaborate, educate and guide" earlystage chemists around the world. In addition, IUPAC also awarded the IUPAC-SOLVAY International Youth 2017 Award for Young Chemists The Award is intended to encourage outstanding scientific researchers early in their careers. The awards were presented for the best Ph.D. theses in the chemical sciences, as described in 1000-word essays. Solvay sponsors the prize. Each candidate was invited to present a poster describing his or her award-winning work and to submit a manuscript to Pure and Applied Chemistry, the scientific journal of IUPAC. Young chemists with their awards, which were delivered by IUPAC president Natalia Tarasova (right). Photo: mci eventos
Women in Chemistry IUPAC also held Distinguished Women in Chemistry and Chemical Engineering awards for female researchers. This important awards program began during the celebrations of the International Year of Chemistry 2011, and was created to recognize leading chemical scientists and promote their work around the world. Several female scientists have been honored since 2011. In 2011, 23 women were honored during a ceremony held at the IUPAC Congress in San Juan, Puerto Rico. In 2013, 12 women received this recognition during the IUPAC Congress in Istanbul, Turkey. Last year, in Busan, Korea, the similar awards ceremony took place during the IUPAC 2015 Congress. 56
Feature Female scientists have been selected based on excellence in basic or applied research, distinguished accomplishments in teaching or education, or demonstrated leadership or managerial excellence in the chemical sciences. This year, during IUPAC 2017, scientists that were honored: Prof. Lifeng Chi, Prof. Concepciรณn Gimeno, Prof. Misako Aida, Prof. Zafra Lerman, Prof. Thisbe Lindhorst, Dr. Veronika Ruth Meyer, Prof. Ingrid Montes, Prof. Frances Separovic, Prof. Ekaterina S Lokteva, Prof. Mei-Hung Chiu. Among them was a Brazilian, Prof. Yvonne Mascarenhas, from the Physics Institute of Sรฃo Carlos, USP. IUPAC President Natalia Tarasova delivered the prizes. Ada Yonath (left) winner of the 2009
Abiquim Seminar on Technology and Innovation 2017
Nobel Prize in Chemistry and Yvonne Mascarenhas (right), one of the winners of Distinguished Women in Chemistry and Chemical Engineering. Photo: mci events
The chemical industry was present with the Chemistry for Innovation in the Chemical Industry symposium and the Abiquim Seminar on Technology and Innovation, which brought executives from several leading industries such as Dow, Basf, Rhodia-Solvay, Braskem, Elekeiroz and others. "It is very important to have industry and academia together", said Willi Nass, vice president of technical services at BASF South America. "In 150 years we have always worked in partnership with the academy in our research centers. In South America, our agenda prioritizes the genetic improvement part of cultivars: plants that are resistant to drought and diseases", he concluded. For Rafael Pellicciotta, responsible for innovation at Elekeiroz and coordinator of Abiquim's technology commission, the industry participation at IUPAC 2017 was a milestone. "I am very pleased that we have achieved a very close relationship between professionals working in technology and innovation in the industry, with students, teachers, institutes and academia."
Willi Nass, Vice President of Basf Technical Services for South America, during the Abiquim Seminar on Technology and Innovation Photo: mci events
SBQ Ordinary General Meeting SBQ Secretary General, Prof. Rossimiriam Freitas (UFMG), announced the city of Foz do Iguaรงu as the venue for the next Annual Meeting of the SBQ, from May 20 to 24, 2018. "The positive feedback from the participants was incredible, they were all very enthusiastic. All of us who were actively involved in the organization of this great event, are very happy with the result, particularly since I have been in direct contact with hundreds of these participants during the organizing phase", she said. The board also praised the work of the previous boards that built the way for IUPAC 2017 in Brazil. The Prof. Norberto Peporine Lopes, who will take over the presidency of the SBQ from May 2018, highlighted the presence of young people and women at the event. "It
Rossimiriam Freitas, SBQ Secretary General, at the Ordinary General Meeting. Photo: mci events
57
Feature was something remarkable. The board of IUPAC was sensitized with the motivation of young Brazilians", he said during the company's ordinary general meeting. 49th General Assembly of IUPAC In parallel to the congress, the 49th IUPAC General Assembly took place, bringing together the main leaders of the association with the objective of defining the guidelines for the coming years. It is in this assembly, for example, that the future president, board members and committees, and the location of the next congresses are elected. The future president of IUPAC will be Briton Christopher Brett, based in Portugal. Emeritus Professor, Department of Chemistry, University of Coimbra, Brett assumed the vice presidency by the biennium 2019-2020 and, as a result, will occupy the presidency between 2021 and 2022.
"As we grow older, it's our turn to help the community", said Christopher Brett, future president of IUPAC.
"I understand that when we are young, we get a lot of support from the chemistry community", said Brett, about what the new positions mean to him. "When we get older, it's our turn to help the community", he concluded. This is because IUPAC has a very unique way of defining its presidents. Presidents are elected first for a term of two years as vices, and then automatically assume the
presidency. Who will succeed the current president, Natália Tarasova, from January 1, 2018, will be the current vice president, Chinese Qi-Feng Zhou. Another decision was where to host the IUPAC 2021 edition, and Canada was chosen to host the world's largest chemistry event in Montreal. Canada has already received IUPAC twice, in 1981 and 2003, in the cities of Vancouver and Ottawa. Canada competed with China, Thailand and Israel. The Hague was elected the seat of 2023 after a dispute with four other candidate countries. Like Brazil, Holland will organize the first world congress of its history. New elements of the Periodic Table It is now official: the periodic table has new elements. The names and symbols of the chemical elements proposed five months ago were approved by the general assembly. "It's a process that takes six to seven years, or even more, from the moment that the discovery is claimed", said the executive director of IUPAC Secretariat, Lynn Soby. Once a researcher or group of researchers arrives at what they believe to be a new element, it is necessary to notify IUPAC and wait for evaluation. The discovery still needs to be published and reviewed in the world's leading scientific journals. The assessment is long, cautious and commanded by an extensive team of scientists that involves not only the chemical association but also the physics association. It is up to the responsible laboratories to suggest the name and the symbol of two letters that the elements will lead, in a process open also to the collaborations of the society. Approved in December 2016, the new elements, brought to the forefront by researchers from the United States, Russia and Japan, were named nihonium (Nh), moscovium (Mc), tennessine (Ts) and oganesson (Og) positions 113, 115, 117 and 118 of the periodic table. They are artificially obtained in the laboratory and have stability of a few seconds or even of milliseconds. All are part of the group of so-called super-heavy elements because they contain in their nucleus a high number of protons. It was the first time in history that four It is noteworthy that for the first time in history, four elements are elements were nominated at the same time and confirmation was made in named at the same time and confirmation was made in Brazil, a gift Brazil. Photo: Divulgação for the 40 years of the Brazilian Society of Chemistry. 58
Br. J. Anal. Chem., 2017, 4 (16), pp 59-68
Sponsor Report
Download
This section is dedicated for sponsor responsibility articles
Forensic Screening for Drugs in Urine Using High-Resolution MS/MS Spectra and Simplified High-Performance Screening Software Marta Kozak, Kristine Van Natta Thermo Fisher Scientific, San Jose, CA, USA The goal of this study is to evaluate the performance of a hybrid quadrupole-Orbitrap mass spectrometer as a LC-MS/MS screening platform for forensic detection and quantitation of very large numbers of drugs in human urine. Keywords: Q Exactive Focus, ToxFinder, forensic toxicology, screening, drugs of abuse. INTRODUCTION Forensic toxicologists need an economical solution to screen for a virtually unlimited number of compounds in urine. Here we present a method for screening using a dilute-and-shoot approach with the Q Exactive Focus mass spectrometer and Thermo Scientific™ ToxFinder™ software. MATERIALS AND METHODS Sample Preparation Samples were processed by simple dilution. Briefly, an aliquot of centrifuged urine was spiked with stable-isotope-labeled internal standard and diluted 30-fold before an aliquot was analyzed by gradient HPLC on a Q Exactive Focus mass spectrometer. No hydrolysis was performed. The internal standard used was tolbutamide-d9. This compound was used for its versatility because it ionizes in both positive and negative mode. Limits of detection were determined by spiking compounds of interest into pooled blank urine in the range of 1 to 500 ng/mL. Liquid Chromatography Gradient elution was performed using a Thermo Scientific™ Dionex™ UltiMate™ 3000 Rapid Separation LC with OAS autosampler (Figure 1). Mobile phases consisted of 10 mM ammonium formate in water and methanol (Fisher Chemical brand) for mobile phases A and B, respectively. The column used was a Thermo Scientific™ Accucore™ PFP column, 2.6 μm, 100 x 2.1 mm fused core (PN 17426-102130). The gradient was run at a flow rate of 0.45 mL/min from 5 to 100% mobile phase B over 6 minutes followed by a column wash and re-equilibration to starting conditions. The total run time was 10 minutes.
Figure 1. Q Exactive Focus MS with UltiMate 3000 RSLC pump and UltiMate 3000 OAS autosampler. 59
Sponsor Report Mass Spectrometry Compounds were detected on a Q Exactive Focus hybrid quadrupole-Orbitrap mass spectrometer equipped with a Thermo Scientific™ Ion Max source and heated electrospray ionization (HESI II) sprayer. Data were acquired in full-scan data-dependent MS2 (ddMS2) mode. In this mode, both positive and negative high-resolution, full-scan data at resolution of 70 k were collected, then MS2 spectra at a resolution of 17.5 k were triggered for compounds entered in the inclusion list (Figure 2). Figure 3 shows an example of the data acquired with this method.
Figure 2. Diagram of data-dependent MS2 method for detection and quantitation of drugs in urine.
Figure 3. Fentanyl data, showing full scan at 5 ppm, product ion scan, and product ion spectra.
Method Evaluation Three hundred compounds, both positively and negatively ionizing, from different classes including therapeutic drugs, drugs of abuse, and environmental toxins, were selected for evaluation. Spiking solutions of 8 – 10 compounds each were prepared and used to make test mixes at concentration of 500, 100, 50, 10, 5, and 1 ng/mL in pooled donor urine. Test mixes were processed using the previously described sample preparation procedure and then analyzed. Additionally, positive donor samples from a collaborator laboratory were processed and analyzed. Data Analysis Data was processed using ToxFinder software. ToxFinder software uses a database that contains compound-related information and tolerances for identification. It also utilizes proprietary spectral libraries including forensic toxicology libraries containing drugs of abuse, therapeutic drugs, and environmental toxins, and food safety and environmental libraries containing pesticides, mycotoxins, veterinary drugs, and PFCs. Other important features include semi-quantitation, relative retention time calculation, a custom reporting package, and easy output for importation into LIMS systems. The ToxFinder software database and libraries are combined into a processing method (Figure 4). After a method is created, the analyst imports a sample list and processes the data. Results can be printed immediately or reviewed before printing (Figure 5). 60
Sponsor Report In this note, the primary method identified compounds based on retention time, accurate m/z, and spectral library matching. The LOD/cut-off for each compound was determined to be the lowest spiked concentration in which peaks were identified by the ToxFinder software. If even greater identification confidence is required, isotopic pattern matching can also be added to the method parameters. Table , shows the parameters used in each method.
Figure 4. Example of a ToxFinder method using library matching (Method #2).
Figure 5. ToxFinder software workflow.
Table I. ToxFinder method parameters used for compound identification.
Method 1
Method 2
Accurate m/z
Accurate m/z
Retention time
Retention time
Library search
Library search
—
Isotopic pattern 61
Sponsor Report RESULTS AND DISCUSSION Using the primary data processing method, the vast majority of compounds analyzed had detection limits at or below 10 ng/mL. Figure 6 shows the number of compounds detected at each concentration, and Table II shows the limits of detection for all compounds. When the additional requirement of isotopic pattern matching was employed, the limits of detection were slightly higher. This is to be expected because of the naturally lower abundance of isotopic ions. Figure 7 shows the ToxFinder software Data Review page with precursor scan, library search results matching, and isotopic pattern comparison results for oxycodone. Complete results for this method are again shown in Figure 6 and Table II. Figure 8 shows reconstructed chromatograms for compounds detected in a donor urine sample. Figure 9 shows the ToxFinder results for cyclobenzaprine from the same samples.
Figure 6. Number of compounds at each limit of detection using ToxFinder methods with and without isotopic pattern matching.
Figure 7. ToxFinder software data review page. 62
Sponsor Report Table II. Limits of detection for compound, with and without isotopic pattern matching. LOD (ng/mL) Analyte
No Isotopic Isotopic Pattern Pattern Matching Matching
LOD (ng/mL) Analyte
No Isotopic Isotopic Pattern Pattern Matching Matching
1-(3-Chlorophenyl)-Piperizine
5
5
&DIIHLQH
5
5
1,1-Dimethylbiguanide
50
50
Carbamazepine
5
5
2-Bromo-Alpha-Ergocryptine 4bromo2,5dimethoxyphenethylamine 6-Acetylcodeine
10
50
Carbinoxamine
5
5
5
10
Chloroquine
500
500
5
5
Chlorothiazide
50
50
6-Acetylmorphine
50
5
Chlorpromazine
10
50
7-Amino-Flunitrazepam
10
10
Acebutolol
5
5
10 10 100
50 100 100
Acetaminophen
5
5
Chlorprothixene Cimetidine Cinnarizine Ciprofloxacin
100
100
Albuterol
5
10
Cisapride
5
50
100
500
Citalopram
5
5
Allobarbital Alprazolam
5
5
Clozapine
5
10
Alprenolol
50
50
Clenbuterol
10
50
Aminorex
5
5
Clobazam
5
5
Amitriptyline
1
5
Clomipramine
5
10
Amobarbital
100
500
Clonazepam
10
10
Amoxapine
5
10
Clozapine N-Oxide
50
50
Amphetamine
5
10
Cocaethylene
5
5
AnhydroecgonineMethylEster
1
5
Cocaine
5
5
Codeine
5
5
>500
>500
5
5
Antipyrine
5
5
Apomorphine
500
500
Codeine-glucuronide
Aprobarbital
100
500
Coumetetrayl
Astemizole
50
500
Cyclobenzaprine
5
5
Atenolol
5
5
Desalkylflurazepam
10
10
Desipramine
5
5
Atropine
5
5
Barbital
>500
>500
Desmethyl-citalopram
5
5
BDB
5
5
Desmethyl-clomipramine
5
5
Benzocaine
10
10
Desmethyldoxepin
5
5
Benzoylecgonine
5
5
Desmethyl-flunitrazepam
10
50
Benzylpiperazine
5
10
Desmethyl-selegiline
5
5
Betamethasone
50
50
Dexamethasone
50
50
Betaxolol
5
10
Dextromethorphan
5
5
Bisoprolol
10
10
Diazepam
5
10
10
50
5
5
Bromazepam
50
50
Diclofenac
Brompheniramine
5
10
Dihydrocodeine
Bufotenine
10
50
Disopyramide
1
5
Bupivocaine
5
5
Dothiepin
10
50
Buprenorphine
5
10
Doxepin
5
5
Doxylamine
5
5
EcgonineMethylEster
5
5
Buprenorphine-glucuronide Buspirone Butabarbital
>500
>500
1
1
100
500
EDDP
5
5
10
10
10
10
Butorphanol
5
5
EMDP
Caffeine
5
5
Enalapril
63
Sponsor Report LOD (ng/mL)
LOD (ng/mL) Analyte
No Isotopic Isotopic Pattern Pattern Matching Matching
Analyte
No Isotopic Isotopic Pattern Pattern Matching Matching
Ephedrine
10
10
Ketoconazole
10
50
Estazolam
5
5
Ketoprofen
10
10
Ethylamphetamine
5
5
Ketorolac
5
50
Etomidate
5
5
Labetalol
50
50
Fendiline
10
10
Lamotrigine
5
5
Fenoprofen
Levotiracetam
50
50
500
500
Fentanyl
1
1
Lidocaine
5
5
Flecainide
5
5
Loratadine
50
50
Flumethasone
50
50
Lorazepam
10
50
Flunitrazepam
5
5
Lorazepam-glucuronide
>500
>500
Flunixin
5
5
Lormetazepam
5
50
Fluoxetine
10
10
LSD
5
5
Fluphenazine
50
50
Malathion
50
100
Flurazepam
5
5
Maprotiline
5
5
Flurbiprofen
>500
>500
MBDB
5
5
Fluvoxamine
5
10
MDA
5
5
Furosemide
100
100
MDEA
5
5
Gabapentin
10
50
MDMA
Glafenine
10
10
MeclofenamicAcid
Gliclazide
5
50
Glimepiride
50
Glipizide
50
Glutethimide Glyburide Haloperidol
5
5
500
500
Meperidine
5
5
100
Mepivacaine
5
5
100
Meprobamate
50
50
50
50
Mescaline
10
50
50
100
Mesoridazine
5
50 50
5
50
Metaproterenol
10
Heroin
500
500
Methadone
5
5
Hexobarbital
500
500
Methamphetamine
5
10
HMMA
50
50
Methaqualone
5
5
Hydrocodone
10
10
Methohexital
500
500
Hydromorphone
5
10
Methotrexate
50
50
Hydroxy-Benzoylecgonine
5
5
Methoxyverapamil
5
5
Hydroxy-Ethyl-Flurazepam
50
50
Methylphenydate
5
5
Hydroxy-Midazolam
50
50
Methyprylon
5
5
Hydroxy-Nordiazepam
5
5
Metoclopramide
5
5
Hydroxy-Triazolam
50
50
Metronidazole
5
50
Hydroxyzine
50
50
Mexiletine
5
5
Ibogaine
5
5
Mianserin
5
5
Imipramine
5
5
Miconazole
500
500
Indomethacin
1
5
Midazolam
5
5
Isocaffeine
5
5
Mirtazapine
5
5
500
500
Molsidomine
5
10
5
10
Morphine
1
1
Isoproterenol Ketamine 64
Sponsor Report /2' QJ P/
LOD (ng/mL) Analyte
Morphine-3-beta-glucuronide Morphine-6-beta-glucuronide Nabumetone N-Acetylprocainamide Nalbuphine Nalorphine Naloxone Naltrexol Naltrexone Naproxen N-desmethyl-cis-tramadol N-Desmethylselegiline N-Desmethyltrimipramine Nicardipine Nifedipine Nimodipine Nitrazepam Nitrendipine Nizatidine Norbenzoylecgonine Norbuprenorphine Norcocaethylene Norcocaine Norcodeine Nordiazepam Nordoxepin Norfentanyl Norfluoxetine Norhydrocodone Norketamine Nor-LSD Normeperidine Normorphine Noroxycodone Noroxymorphone Norpropoxyphene Nortriptyline Noscapine O-demethyl-cis-tramadol O-desmethyl-venlafaxine Ondansetron Opipramol Oxazepam Oxazepam-glucuronide Oxcarbazepine Oxycodone
No Isotopic Isotopic Pattern Pattern Matching Matching 100 500 >500 >500 100 100 5 10 5 5 5 10 5 5 5 5 5 5 10 50 50 50 10 10 5 5 50 50 50 50 50 50 5 5 50 50 50 50 5 10 10 50 10 10 5 5 10 10 5 5 5 5 5 5 50 50 10 10 5 10 50 50 5 50 10 50 5 10 50 50 50 50 5 5 10 10 10 10 50 50 5 5 5 50 5 5 >500 >500 50 50 5 10
$QDO\WH
1R ,VRWRSLF Isotopic Pattern Pattern Matching Matching
2[\PRUSKR
5
10
Papaverine
5
5
Paraxanthine
5
10
10
10
Pentazocine
5
10
Pentobarbital
50
100
Perphenazine
50
100
Phenobarbital
50
100
Phenolphthalein
50
50
Phenterm ine
10
10
Phenylpropanolam ine
10
50
Paroxetine
Phenyltoloxam ine
5
5
500
500
Physostigm ine
5
5
Pindolol
5
5
100
100
PMA
5
50
PMMA
5
5
Prazosin
5
5
Phenytoin
Piroxicam
Prilocaine
5
5
Prim idone
50
50
Procainam ide
5
5
Procaine
5
5
Prom azine
5
10
50
50
100
100
5
10
Prom ethazine Prom etryn Propafenone Propoxyphene
10
10
Propranolol
5
5
Protriptyline
5
5
Pseudoephedrine
5
5
Pyrilam ine
5
5
Quetiapine
5
50
Quinidine
5
5
Quinine
1
1
50
50
Ranitidine Risperidone
5
5
Ritalinic Acid
5
10
Scopolam ine
5
10
Secobarbital
100
500
Selegiline
50
50
Sertraline
10
50
Sotalol
5
5
Spironolactone
50
50
Strychnine
10
10
Sufentanil
50
50
Sulindac
10
50
65
Sponsor Report LOD (ng/mL) Analyte
6XOSLULGH
5
5
Tamoxifen
100
100
Tapentadol
5
5
Telmisartan
5
10
Temazepam
50
50
Tenoxicam
5
50
Terbutaline
5
10
Terfenadine
50
10050
Tetracaine
50
5
Theophylline
5
100
Thiopental
100
100
Thioridazine
100
50
Thiothixene
5
100
Tiagabine
5
5
Tiapride
5
5
Timolol
5
5
Tolmetin
5
10
Topiramate
5
5
Tramadol
5
10
Trazodone
10
10
Triazolam
5
10
Trifluoperazine
10
50
Trimethoprim
5
5
Trimipramine
5
5
Triprolidine
5
5
Venlafaxine
5
105
Verapamil
5
5
Vincamine
5
5
Warfarin
5
5
Zaleplon
5
5
Zimelidine
5
10
Zolpidem
5
5
Zolpidem phenyl-4-COOH
10
10
Zonisamide Zopiclone
66
No Isotopic Isotopic Pattern Pattern Matching Matching
5
10
500
500
Sponsor Report
Figure 8. Donor #2 urine analysis results - identiďŹ ed compounds.
Figure 9. Cyclobenzaprine identiďŹ ed in donor sample.
67
Sponsor Report CONCLUSION A urine screening method for about 300 compounds, both positively and negatively ionizing, including drugs of abuse and environmental toxins, was successfully evaluated. Collected data demonstrated good method sensitivity and specificity in diluted urine samples. ToxFinder software's simple user interface enabled quick method development and rapid data review. The Q Exactive Focus mass spectrometer and ToxFinder software together provided high confidence in data output by combining the power of an Orbitrap mass analyzer with the comprehensive identification software workflow. This sponsor report is the responsibility of Thermo Fisher Scientific.
68
Br. J. Anal. Chem., 2017, 4 (16), pp 69-72
Sponsor Report
Download
This section is dedicated for sponsor responsibility articles
Sample Preparation and Trace Elemental Determination in Traditional Chinese Medicine Sanja Asendorf Thermo Fisher Scientific, Bremen, Germany
Samples of Traditional Chinese Medicine (TCM) were submitted to a microwave assisted acid digestion using 6 mL of nitric acid and 2 mL of peroxide hydrogen. The maximum temperature in the microwave method was 200 °C. A method of elemental determination of As, Cd, Cr, Cu, Hg, and Pb was developed using ICP OES. Spike recoveries were calculated. The values were within ± 10% of the spike concentration for all elements. Keywords: traditional Chinese medicine, sample preparation, microwave, trace elements, ICP OES INTRODUCTION Traditional Chinese Medicine (TCM) are therapeutic practices that have been developed over the past 2000 years and are used for the prevention and treatment of diseases. The administration of natural drugs is one of the five pillars of TCM that additionally encompasses acupuncture, massage techniques, kinesiatrics and dietetics. Over 90% of the used drugs are herbal products, mineral and animal products play a less important role. Typically, the herbal drugs are administered in the form of teas or infusions. Less used dosage forms include granulates, hydrophilic concentrates or even pills and capsules of readymade mixtures of the herbal components. As TCM was the only practiced medicine in the region before the arrival of western medicines, its field of application is diverse. The tradition is still widely practiced in many Asian countries and recently the usage has also increased in the western countries. However, the safety of these remedies has been questioned due to cases of illness and fatalities. Ongoing environmental pollution leads to enrichment of toxic substances in the soils and accumulation of toxic substances in the harvestable parts of the plants used as medicine. The potential danger of contamination can only be minimized by control from the responsible drug authorities and sale of the products via pharmacies or drug stores rather than non-regulated outlets. A first step to securing the quality of these products is being achieved with the recommendations of the World Health Organization (WHO) for maximum allowances of heavy metals and other toxic elements in herbal materials and the introduction of a new classification of TCMs within the United States Food and Drug Administration (FDA) draft guidance for Complementary and Alternative Medicine products (CAM). Table I gives an overview of existing regulations and recommendations. Table I. Recommendations and regulations for trace element concentrations in TCMs in mg kg-1. Element
Hong Kong (HKCMMS, 2010)
China Mainland (CP, 2015)
USA (NSF/ANSI 173 – 2010)
WHO (2005)
UK (BP)
Korea (KP X, 2012)
As Cd Cr Cu Hg Pb
2 1 0.2 5
2 0.3 20 0.2 10
5 0.3 2 0.2 10
0.3 5
5 5
3 0.3 0.2 5 69
Sponsor Report MATERIALS AND METHODS Instrumentation For the sample preparation, it was used the Milestone Ethos EZ microwave, equipped with an SK-10 segmented rotor and a temperature sensor. The SK-10 rotor features up to 10 TFM vessels with a volume of 100 mL and suitable for application that requires up to 100 bar of maximum pressure and temperature of 220 ºC. For the sample analysis, the Thermo Scientific™ iCAP™ 7400 ICP-OES Duo was used together with an aqueous sample introduction kit, consisting of a concentric glass nebulizer and a cyclonic glass spray chamber as well as a 2 mm injector tube, aqueous pump tubing and an internal standard kit for online addition of the internal standard. The duo configuration was chosen for its low detection capability that is necessary when working in a pharmaceutical environment. A Teledyne CETAC ASX-560 autosampler was used to transfer the sample to the introduction system of the ICP-OES. The Thermo Scientific™ Qtegra™ Intelligent Scientific Data Solution™ (ISDS) Software simplifies method development and provides easy options for post-analysis data manipulation. Standard Preparation All solutions were prepared from 1000 mg kg-1 single element solutions provided by Spex CertiPrep (SPEX CertiPrep Group, Metuchen, US). The individual solutions were made up with 18 MΩ ultra-pure water and TraceMetal™ grade HNO3 (Fisher Chemical, Loughborough, UK) to a final concentration of 7.8% HNO3. A spike solution and an internal standard solution of yttrium (10 mg kg-1) were prepared in the same way. Sample Preparation The sample preparation was based on microwave assisted acid digestion. Three different TCM samples (plant roots) were used for this study: Huang Qi, Dan Shen and Dang Shen. The samples were dried, ground and digested, each in three replicates of which one was spiked with the concentration of analytes in the middle of the calibration range (Table I). Two duplicates were analyzed to show reproducibility of the digestion. For the digestion, the ground plant root material was weighed (~0.5 g) into a PTFE high pressure vessel and 6 mL of concentrated nitric acid were added. If material adhered to the walls of the vessel, it was washed down carefully with the acid. For better oxidation of the organic matrix, 2 mL of concentrated hydrogen peroxide (Primar™ grade, Fisher Chemical, Loughborough, UK) were added as well. The digestion was conducted in a Milestone Ethos EZ microwave, equipped with an SK-10 segmented rotor and a temperature sensor, according to the protocol in Figure 1. After digestion the digest was transferred to a 50 mL volumetric flask. The digestion vessels were rinsed with 18 MΩ ultra-pure water and after transferring this to the flask as well, it was filled up with ultra-pure water to the measured mark. Additionally, for each digestion cycle a duplicate of a digestion blank was run. This contained only acid and hydrogen peroxide and after digestion was treated the same way as the samples.
Figure 1. Temperature program of the digestion 70
Sponsor Report Method development and analysis -1
A method was created in Qtegra ISDS Software. Due to the low concentration range (µg kg ), wavelengths were only viewed axially. The wavelengths used for the analysis are shown in Table IV, these were selected as they were free from interferences and provided the sensitivity to quantify the elements of i nterest in the expected concentration range. The parameters used for the method can be found in Table II. The plasma was ignited and the instrument was allowed to warm up for a period of 15 minutes. A spectrometer optimization was performed directly before analysis. Following method development, the instrument was calibrated and the samples were analyzed. A method detection limit study was carried out by analyzing the digestion blank with ten replicates and multiplying the standard deviation of this analysis by three. This was repeated three times and the average values for detection limits were calculated. Table II. Instrument Parameters Parameter
Setting
Pump Speed
50 rpm
Nebulizer
Glass concentric
Nebulizer Gas Flow
0.55 L min
Auxiliary Gas
0.5 L min
Coolant Gas Flow
12 L min
Center Tube
2.0 mm
RF Power
1150 W
Exposure Time
UV 15 s, Vis 5 s
-1
-1
-1
RESULTS AND DISCUSSION After digestion, the digested solutions were clear and only some small white particulates remained in the solutions of Huang Qi and Dan Shen (possibly silicates that cannot be digested by nitric acid). The results for the spike recovery test prove that none of the target elements were lost during digestion. With the exception of mercury, all correlation coefficients of the calibration were greater than 0.9994, indicating very good linearity. A reason for the slightly worse calibration of mercury may be the adhesion of mercury to the walls of the LDPE vials from autosampler at low concentrations. This effect could be minimized by the addition of gold (in the form of AuCl3) to the standard solutions. The detection limits for all elements are in the single digit or sub μg kg-1 concentration range. Spike recoveries were calculated from the concentration values in Table III, not taking into account values that were below the detection limit (˂DL). The recoveries for the three samples were within ±10% of the spiked concentration for all elements, most of them being within ±5% of the expected value, showing very good accuracy of the method. The corrected concentrations of elements in the original plant root material are shown in Table IV. They are calculated by applying the factor derived from the dilution of the sample aliquot in 50 mL sample solution. The two replicates for each sample are in good agreement with each other, demonstrating the repeatability of the method. When comparing the concentrations of the measured elements in the TCM samples to the limits and recommendations of various pharmacopoeias and the World Health Organization (see Table I), it is obvious that all concentrations are around one order of magnitude below the recommended limits and therefore considered as safe for human consumption.
71
Sponsor Report Table III. Concentrations of elements in solution (µg kg-1). The first and second replicate as well as the measured spiked concentration and calculated recovery in percentage for each TCM sample: Huang Qi, Dan Shen and Dang Shen. Also given are correlation coefficients and detection limits for each element wavelength. Huang Qi
Element Wavelength (nm) As
Replicate 1
2
?DL <?DL <
Spike
Dan Shen Recovery
Replicate
Spike
Dang Shen Recovery Replicate
(%)
1
2
(%)
51.1
102.1
<?DL
<?DL
53.1
106.1
1
2
<?DL <?DL
Recovery
Spike
2
R
DL
(%)
50.8
101.5
0.999 3.6
Cd
0.2
0.2
25.5
101.1
0.4
0.4
25.3
99.7
0.3
0.3
25.3
100.1
0.999 0.1
Cr
1.4
1.7
26.2
98.6
7.4
7.5
32.3
99.5
2.2
2.5
26.9
98.4
0.999 0.3
Cu
64.5
66.4 171.4
105.9
128.2 129.2 228.6
99.9
60.9 60.5 156.6
96
0.999 0.9
Hg
0.7
< ?DL
49.5
97.4
<?DL
<?DL
50.1
100.2
?DL 1.5 <
47.0
91.1
0.996 0.6
Pb
2.6
2.8
25.5
91.3
6.2
7.2
30.6
95.4
27.7
98
0.998 1.9
3.2
3.2
Table IV. Calculated concentration of six elements in the TCM samples in mg kg-1. Huang Qi
Dan Shen
Dang Shen
Wavelength (nm)
1
2
1
2
1
2
As (193.759)
< ?0.4
< ?0.4
< ?0.4
< ?0.4
< ?0.4
< ?0.4
Cd (214.438)
0.02
0.02
0.04
0.03
0.03
0.03
Cr (205.560)
0.1
0.2
0.7
0.7
0.2
0.2
Cu (224.700)
6
6
13
12
6
6
Hg (184.950)
0.07
< ?0.06
?0.06 <
?0.06 <
?0.06 <
0.14
Pb (220.353)
0.3
0.3
0.6
0.7
0.3
0.3
Element
CONCLUSIONS Ethos EZ microwave digestion system shows great results for sample digestion. Some samples presented an expected white precipitate due to the presence of silicates. Despite this, the spike recoveries showed very good accuracy, most of them being within ±5% of the expected value, indicating that no target elements are lost during the sample preparation demonstrating microwave digestion is an excellent choice for sample preparation. The analysis shows that the Thermo Scientific iCAP 7000 Plus Series ICP-OES delivers excellent accuracy and sensitivity for analysis of trace elements in herbal products used as TCM in conformity with the present recommendations for concentration limits. The detection limits obtained are comparable to those in drinking water proving the excellent ability of the instrument of handling complex acidic matrices.
This sponsor report is the responsibility of Thermo Fischer Scientific.
72
Br. J. Anal. Chem., 2017, 4 (16), pp 73-75
Sponsor Report
Download
This section is dedicated for sponsor responsibility articles
Preparation of Biological Samples for Trace Metal Analysis Camilo Pirola Milestone Srl, Sorisole, BG, IT Clinical laboratory testing plays a crucial role in the detection, diagnosis, and treatment of disease. Many laboratories specialized in analyzing biological materials are equipping their lab with instrumentation suitable for trace analysis, such as ICP-OES or ICP-MS. In these conditions, sample preparation becomes a crucial operation before analysis. The use of micro-inserts in digestion vessels reduces the amount of acid required for digestion, reduces the dilution factor and increases the detection limit. Human hair samples were used to evaluate the accuracy of this digestion method and a recovery test was performed through internal standard addition. Animal blood samples were used to evaluate cross contamination among micro inserts samples. Keywords: biological sample, sample preparation, micro-sampling, microwave digestion, elemental determination, ICP OES. INTRODUCTION The investigations of body fluids and other biological materials with respect to nutrient (essential) elements and toxic elements - which are challenging topics for analytical chemistry – include the determination of concentrations at the trace and ultratrace level. Known as essential trace elements, elements like Co, Cu, Zn, Mn, Se are considered essential elements for the maintenance of the human body, since they participate in metabolic reactions, but in high concentrations bring health damage. Most of these elements have different oxidation states and their toxicity is related to only one specific species [1]. Metals such as Cr and Cu are involved in the reaction of Fenton metallo-dependent decomposition of hydrogen peroxide generating hydroxyl radical. The latter reacts with the most diverse types of biomolecules, such as lipids, proteins and DNA [2]. Arsenic, cadmium and lead are known as heavy metals. Despite their controversial nomenclature [3], they are known like this because their high toxicity, since most living beings cannot metabolize them, accumulating in organisms. According to IARC, the International Agency for Research on Cancer, As and Cd in inorganic forms are genotoxic but not mutagenic and are recognized as carcinogenic to humans. Pb also has no carcinogenic characteristics, but has neurological, reproductive, immunological, cardiovascular and renal health effects [4]. Clinical laboratory testing plays a crucial role in the detection, diagnosis, and treatment of disease. With increasing automation and the use of computer technology, the work of technologists and technicians has become less hands-on and more analytical. The complexity of tests performed implicates the need of technological advanced instrumentation. Many laboratories often need to perform analysis of low-level trace metal samples. In these conditions, sample preparation becomes a crucial operation before analysis. Micro-inserts, based on so-called Vessel-Inside-Vessel Technology, are smaller secondary vials that can be placed inside the primary high-pressure microwave vessel. This configuration reduces the amount of acid required for digestion to near stoichiometric quantities, which reduces the dilution factor and increases the detection limit.
73
Sponsor Report MATERIALS AND METHODS Sample Preparation The sample preparation was performed using Ethos UP (Milestone, Italy) microwave-assisted acid digestion. A 15 position rotor (SK-15 rotor) was used for these tests. Micro-inserts, based on so-called vessel-inside-vessel technology, capable to prepare samples employing small volume of acids were used too. This configuration reduces the amount of acid required for digestion to near stoichiometric quantities, which reduces the dilution factor and increases the detection limit. Micro-sampling inserts were used to digest two types of samples: human hair and animal blood. -1 In the human hair were added an amount of 50 μg kg of an internal standard containing the following elements: As, Cd, Cr, Pb, Se, Ni, Mn. The animal blood samples (non-certified) were used to check that any cross contaminations occur between each micro-insert vials. Both samples, human hair and animal blood, were weight (100 mg) and 2 mL of Nitric Acid was added to the micro-insert vials. It was added 10 mL of distilled water inside the SK-15 vessel. A 25 minute heating program was used to perform the digestion, as showed in Table I. Table I. Heating program used during digestion in microwave system Temperature (ºC) 180
Time (min)
Ramp (min)
10
15
Power (W) 1800
Elemental determination After sample preparation, the elemental determination was performed using an ICP OES equipment. The analysis parameters are shown in Table II. Table II. ICP OES parameters
Radiofrequency power (W)
1300
Pump rotation (rpm)
15 -1
Nebulizer gas (L min ) -1
0.75
Auxiliary gas (L min )
1.5
Plasma gas (L min-1)
15
To evaluate the accuracy of the method, in the human hair were added an amount of 50 μg kg-1 of an internal standard containing the following elements: As, Cd, Cr, Pb, Se, Ni, Mn. The animal blood samples (non-certified) were used to check that any cross contaminations occur between each micro-insert vials. RESULTS AND DISCUSSION Recovery Tests -1
Three different samples of human hair were digested and an amount of 50 μg kg of an internal standard containing arsenic, cadmium, lead, selenium, nickel and manganese were added in each one. The elemental determination of three replicates are showed in Table III. The results for this evaluation are very satisfactory once the recovery percentage is within the desired working range of 10% of variation.
74
Sponsor Report
Table III. Elemental determination of hair samples Replicate
As (µg/L)
Cd (µg/L)
Cr (µg/L)
Pb (µg/L)
Se (µg/L)
Ni (µg/L)
Mn (µg/L)
1
49.2
48.1
54.9
47.9
51.9
50.7
51
2
39
47.5
53
49.4
49.4
49.9
51.4
3
49.2
48.3
53.2
48.3
51.9
50.4
52.3
Average
45.8 + 5.9
48.0 + 0.4
53.7 + 1.0
48.5 + 0.8
51.1 + 1.4
50.3 + 0.4
51.6 + 0.7
% Recovery
91.6
95.9
107.4
97.1
102.1
100.7
103.1
Cross contamination test In order to evaluate the presence of cross contamination during samples digestion, the blood and blank samples were placed in two different configurations. In the first one SK-15 vessel was placed three diferent blank samples B1, B2 and B3. In the second one was placed one blank sample B4 and two blood samples S1 and S2. The results obtained in this test are showed in Table IV. Table IV. Cross contamination evaluation test
Sample B1
Cr (µg/L) <2
Cu (µg/L) <2
Mn (µg/L) <2
Ni (µg/L) <2
Pb (µg/L) <2
Zn (µg/L) < 10
B2
<2
<2
<2
<2
<2
< 10
B3
<2
<2
<2
<2
<2
< 10
S1
54.79
39.56
14.38
31.61
11
148.5
S2 B4 Avarage Std. Dev.
56.08 <2 55.4 0.9
39.52 <2 39.5 0
14.3 <2 14.3 0.1
32.59 <2 32.1 0.7
10.8 <2 10.9 0.1
148.2 < 10 148.4 0.2
CONCLUSIONS Human Hair and Animal Blood samples were prepared for elemental analysis using quartz micro-inserts configuration (vessel-inside-vessel technology). Micro-inserts demonstrate to provide a robust and reproducible way to prepare biological samples for trace metal analysis with low acid volumes and small quantity of sample. The data reported in this technical note shows that the “Vessel-Inside-Vessel Technology” is a great solution for clinical laboratories that need to examine and analyze biological material employing small volume of acids and small quantity of sample.
REFERENCES 1. Krug, F.J. Editor, Métodos de preparo de amostras: fundamentos sobre preparo de amostras orgânicas e inorgânicas para análise elementar, First edition (revised), Piracicaba, SP, BR, 2008. 2. Valko, M. Curr. Med. Chem., 2005, 12, pp 1161-1208. 3. Duffus, J.H. Pure Appl. Chem., 2002, 74 (5), pp 793–807. 4. International Conference on Harmonization of Technical Requirements for Registration of Pharmaceuticals for Human Use, Guideline for Elemental Impurities, Q3D Step 4, 2014.
This sponsor report is the responsibility of Milestone Srl. 75
Br. J. Anal. Chem., 2017, 4 (16), pp 76-78
Sponsor Report
Download
This section is dedicated for sponsor responsibility articles
Purification of Cannabidiol from Cannabis sativa Gilson, Inc., Middleton, WI, USA Cannabidiol (CBD), a major component of the Cannabis sativa plant, is of special interest for therapeutic use, which makes its purity a fundamental aspect for consumer safety. The objective of this work was to develop a fast and reproducible method for purification of CBD on a large scale by Centrifugal Partition Chromatography (CPC). In addition to the purification of CBD, the developed method provided a significant reduction in solvent consumption since for each 5 g sample, only 1 L of solvent was consumed. Keywords: Cannabidiol, Cannabis sativa, Centrifugal Partition Chromatography. INTRODUCTION CBD (Figure 1) is of special interest because it is non-psychotropic and studies suggest that it has therapeutic medicinal properties for the treatment of conditions including pain, inflammation, epilepsy, and cancer [1,2]. Recent changes in the legal status of Cannabis compounds for medicinal use, as well as the decriminalization of marijuana in some locations, has led to increased interest in purification, formulation, and detection of CBD. Although CBD is still classified as a Schedule I drug in the United States, the U.S. Food and Drug Administration has authorized clinical trials to evaluate the use of CBD to treat children with rare forms of epilepsy [3]. Cannabinoids are concentrated in a sticky resin found within the glandular trichomes, hairlike structures on the surface of the plant (Figure 2).
Figure 1. Chemical structure of cannabidiol
Figure 2. Closeup view of glandular trichomes on the surface of a Cannabis plant
Although most cannabinoids are nearly insoluble in water, they can typically be dissolved in oils, alcohols, and other non-polar solvents. To ensure consumer safety it is critical to develop standardized CBD products that are free of tetrahydrocannabinol (THC) and other contaminants. Gilson has developed a rapid and reproducible method for large-scale purification of CBD using centrifugal partition chromatography (CPC) (Figure 3). The method can be adapted from milligram to multi-kilogram scale, requires little solvent, and recovers close to 100% of the CBD from a complex crude extract.
76
Sponsor Report
Figure 3. CPC 250 with PLC 2250 Purification System
MATERIALS AND METHODS Purification of CBD A Gilson CPC 250 PRO column was run with an elution rate of 70 mL min-1, an extrusion flow rate of 70 mL min-1, and a rotation speed of 3000 rpm. The CPC column was controlled by a PLC 2250 Purification System (for preparative liquid chromatography) equipped with a 250 mL min-1 quaternary gradient pump, UV/Vis detector, fraction collector, and Gilson Glider control software. Analytical HPLC was performed on a Hitachi LaChrom Elite® HPLC System (VWR) equipped with a photodiode array detector (PDA) (200 800 nm). Crude extract was prepared from dried Cannabis sativa L. plant material and was filtered before being subjected to CPC. All organic solvents were analytical or high performance liquid chromatography (HPLC) reagent grade. RESULTS AND DISCUSSION In this study, 5 g of crude extract of C. sativa flowers were subjected to CPC. Using this one-step method resulted in clean separation of CBD from THC and other compounds (Figure 4). 205 mg of CBD was purified from 5 g of crude extract, and the final product had a purity of over 95% as shown by HPLC analysis. For each 5 g sample, 1 L of solvent was consumed for every 10 minutes of separation.
Figure 4. Chromatogram of CBD and THC purified using CPC
77
Sponsor Report CONCLUSIONS CPC technology employs a silica-free liquid-liquid chromatography (LLC) column that can be used to purify CBD from crude extracts of Cannabis in just one step. Purification parameters can be adjusted according to which cannabinoids are targeted or the desired purity level to achieve THC-free extracts, pure cannabinoids, pharmaceutical-grade products, or standard molecules for use as reference materials or for clinical evaluation. The methodology is adaptable from laboratory to industrial scale. Because the method does not use silica resin there is no irreversible adsorption of the sample to the matrix and therefore no sample loss.
REFERENCES 1. Russo, E. B. Trends Pharm. Sci., 2017, 38 (3), pp 198-201 (doi: 10.1016/j.tips.2016.12.004). 2. Zhornitsky, S.; Potvin, S. Pharmaceuticals, 2012, 5 (5), pp 529-552 (doi: 10.3390/ph5050529). 3. Throckmorton, D.C., Deputy Director for Regulatory Programs, Food and Drug Administration. Department of Health and Human Services. “Researching the Potential Medical Benefits and Risks of Marijuana” July 13, 2016. Statement to United States Cong. Senate, Committee on the Judiciary, Subcommittee on Crime and Terrorism. http://www.fda.gov/NewsEvents/Testimony/ucm511057.htm.
Trademarks All product and company names are trademarks™ or registered® trademarks of their respective holders. Use of the trademark(s) in this document does not imply any affiliation with or endorsements by the trademark holder(s). Notice This sponsor report has been produced and edited using information that was available at the time of publication. This sponsor report is subject to revision without prior notice.
This sponsor report is the responsibility of Gilson, Inc.
78
Br. J. Anal. Chem., 2017, 4 (16), pp 79-79
Releases
Nova Analitica has acquired the Anacom distribution business Last July, the Brazilian company Nova Analítica acquired the distribution business from Anacom and will be in charge of sales, support and services of the products from Milestone Italy (Microwave systems), Park Systems (Atomic Force Microscopes), Phenom World (Scanning Electronic Microscopes) and Fluxana (Sample Prep for XR). Anacom transferred these businesses as part of its strategy to invest in the manufacturing of Spectrometer of Optical Emission that was developed in Brazil by them. Nova Analitica has 25 years of expertise in the Brazilian Analytical Market, and has a team of 200 employees which includes highly qualified engineers, chemists and biologists to support customers. Nova Analitica will continue to support all the customers developed by Anacom in the last 18 years. This acquisition included the transfer of the technical and commercial teams, the stock of spare parts and instruments so that there will be no discontinuity in customer support. Anacom and Nova Analitica are working together for 15 months after the acquisition to ensure that all customers will be supported and satisfied.
79
Thermo ScientiďŹ c Q Exactive Focus Orbitrap LC-MS/MS System
VIDEO
WEBSITE
Br. J. Anal. Chem., 2017, 4 (16), pp 81-81
Release
Q Exactive Focus: Hybrid Quadrupole-Orbitrap Mass Spectrometer The sensitivity, selectivity, flexibility, and ease-of-use provided by hybrid quadrupole-Orbitrap mass spectrometers set the standard for screening, quantitation, identification, and confirmation of targeted and untargeted compounds. The Thermo Scientific™ Q Exactive™ Focus hybrid quadrupole-Orbitrap MS makes this power accessible to environmental, food safety, clinical research, forensic toxicology, and pharmaceutical labs challenged by growing sample volumes and constrained by strict budgets. The Q Exactive Focus system simplifies method development, saving time and decreasing costs while reliably delivering unsurpassed results. Superior performance The Q Exactive Focus mass spectrometer combines quadrupole precursor selection with high-resolution, accurate-mass detection to produce sensitivity that rivals triple quadrupole mass spectrometers and resolution that surpasses Q-TOF instruments. ·Exceptional sensitivity thanks to superior selectivity that eliminates interferences allowing lower limits of detection and quantitation ·Fast polarity switching so more classes of compounds can be processed in a single analysis ·High scan speeds for compatibility with fast chromatography and high-throughput screening ·Resolution superior to Q-TOF instruments for more confident identification and confirmation ·Exceptionally wide linear dynamic range Exceptional flexibility The unique hybrid quadrupole-Orbitrap configuration provides exceptional flexibility, allowing Q Exactive Focus instruments to perform both targeted and untargeted screening with confident identification and confirmation. Q Exactive Focus instruments can take advantage of high-resolution, accurate-mass in a number of quantification approaches, including: ·Full-scan – data-dependent MS/MS (FS-ddMS2) acquisition for ultimate scan speed and quantitative performance ·Variable data-independent acquisition (vDIA) for qualitative coverage for screening unknowns without compromising quantitative performance ·Selected-ion monitoring (SIM) for simple setup and highest sensitivity ·Parallel-reaction monitoring (PRM) for high selectivity and high throughput with confident confirmation Powerful software Application-specific software is available to make full use of the power of the Q Exactive Focus Instrument. For component identification in untargeted and unknown workflows, Thermo Scientific™ TraceFinder™ software includes libraries of high-resolution accurate-mass (HRAM) spectra. 1,594 compounds commonly targeted in food and environmental analyses are represented by 8,392 HRAM spectra. Another 1,052 compounds commonly targeted in clinical research and forensic / toxicological analyses are represented by 5,260 HRAM spectra. Combined with TraceFinder data analysis software, the Q Exactive Focus offers a powerful, yet simple-to-use solution for food safety, environmental, clinical research, forensic, and toxicological screening. 81
For routine analysis requirements and mid-range sample throughput Benefits - Ideal for QA/QC - Advanced level of performance - Minimum user set up and maintenance Keywords Automation, cost-efficiency, ease of use, elemental analysis, ICP-OES, simplified workflow, QA/QC
The Thermo Scientific™ iCAP™ 7400 ICP-OES is ideal for QA/QC and contract laboratories that require the highest sensitivity. The iCAP 7400 ICP-OES is a powerful simultaneous spectrometer based on the core technologies of the Thermo Scientific iCAP 7000 Plus Series ICP-OES for performance, versatility and productivity. Utilizing the latest hardware designs, the instrument achieves an advanced level of performance for regulatory compliance, extensive and routine solution applications with minimal user set-up and maintenance. The iCAP 7400 ICP-OES offers laboratories broad analytical capabilities with stability and sensitivity, combined with low operating costs. The instrument is driven by the Thermo Scientific™ Qtegra™ Intelligent Scientific Data Solution™ (ISDS) Software. Developed to combine easy data management, scalability and compliance, Qtegra ISDS Software delivers simplicity, productivity, efficiency and quality in a highly efficient analysis workflow.
VIDEO
WEBSITE
Br. J. Anal. Chem., 2017, 4 (16), pp 83-83
Release
iCAP™ 7400 ICP-OES Analyzer Enabling regulatory compliance for a wide range of trace element applications, the compact and robust Thermo Scientific™ iCAP™ 7400 ICP-OES delivers superb performance and productivity. With its broad analytical capabilities, this powerful instrument is allowing full wavelength coverage while retaining high sensitivity. It requires minimal user set-up and maintenance, and has a low cost per sample. The iCAP 7400 ICP-OES is controlled with the integrated Thermo Scientific™ Qtegra™ Intelligent Scientific Data Solution™ (ISDS) software, which enables quick set-up and easy operation.
Description Inductively Coupled Plasma-Optical Emission Spectrometry (ICP-OES) is an established and powerful technique for the analysis and quantitation of trace elements in both liquid and solid samples. The rugged and reliable iCAP 7400 ICP-OES is a powerful elemental analyzer with a small footprint. Other features and benefits of this spectrometer include the following: Sampling System ·Suitable for mid-range sample throughputs. ·4-channel, 12-roller, peristaltic pump, with a unique drain sensor, provides smooth, low noise signals and safe operation. ·Autosampler accessories allow analyzing of 180-720 liquid samples unattended. ·Instrument speed mode enables analysis of larger sample loads. ·Intelligently grouped wavelengths enhance data acquisition speed and increase sample throughput. ·Integrated hydride generation system accessory provides sub-ppb detection of hydride-forming elements. ·Optional sample handling kits available for organic/volatile solvent-based, hydrofluoric acid, and high solids solutions. Versatility ·Handles a wide range of applications in a broad range of industries. ·Supports QA/QC and contract laboratory workflows. ·Supports automated and intelligent sample preparation. Optical System ·A selection of wavelengths between 166–847nm and optimal signal-to-noise measurement. ·Dedicated radial or duo plasma view configurations to suit different sample types and elements of interest. ·Improved long-term signal stability using a mass flow-controlled nebulizer gas flow. ·Customizable to a range of challenging matrices and sample volumes, extending your laboratory's capabilities. Software ·Integrated Qtegra Intelligent Scientific Data Solution (ISDS) software minimizes task times and maximizes protocol automation. ·Integrated Element Finder plug-in automates method development, optimizing plasma parameters and selecting wavelengths best suited to the sample.
83
VIDEO
WEBSITE
Br. J. Anal. Chem., 2017, 4 (16), pp 85-85
Release
ETHOS UP and MILESTONE CONNECT: High Performance Microwave Digestion Systems Open the door to a new Milestone! The new ETHOS UP is the most advanced microwave digestion systems Milestone has ever manufactured.
The new Milestone ETHOS microwave cavity has a volume in excess of 70 litres, by far the largest currently available; up to 44 samples can be accommodated, improving productivity and sample preparation throughput. The new Milestone ETHOS UP is equipped with the most advanced yet easy to use reaction sensors for complete quality control of the digestion conditions. In combination with our 'vent-and-reseal' vessel technology, the sensors ensure complete and safe digestions without any loss of volatile compounds Included with the brand-new ETHOS UP microwave digestion system is a unique web based application – Milestone Connect. The app provides up to date information and extended instrument control from outside the laboratory. By adding the IP address of your network, operators will be able to control the ETHOS UP from outside the laboratory with remote monitoring of every sample in the digestion run and other information related to the system on any wifi-enabled mobile device. That ultimately helps to provide high quality sample preparation. The app works on various external devices such as PC, tablets or smartphones connected to the ETHOS UP. Users will be part of Milestone scientific community and will gain an exclusive access to Milestone contents: application notes, digestion tips and techniques, Milestone library, scientific articles, video tutorials, special offers, news and a help-on-line section. Milestone know-how and 26-year experience in sample preparation are now available for chemists to provide instant support available 24 hours a day, 7 days a week.
85
VIDEO
WEBSITE
Br. J. Anal. Chem., 2017, 4 (16), pp 87-87
Release
Accelerate the pace of your research INTRODUCTION Chromatographic purification of natural compounds presents many challenges to scientists because of the complex nature of the starting matrices that are used in the process. These starting materials can damage traditional columns and cartridges, decreasing the length of their usage and increasing costs; that is, if the particular system can even accommodate the starting material. Centrifugal partition chromatography (CPC), which uses both liquid stationary and mobile phases, can handle heavily particulated, complex starting materials, such as direct extracts from many biological sources, and has been shown useful for the isolation of piperine from Piper nigrum, gingerol from ginger, and Cannabidiol from the Cannabis sativa plant. Additionally, by relying on a liquid stationary phase, traditional columns and cartridges used by preparative HPLC and FLASH methods do not need to be replaced. CPC is a cost effective alternative for these purification techniques and yields a high quantity of pure compounds. CPC is your ideal solution for natural extract fractionation, natural compound purification, and protein separations. THE ADVANTAGES OF CPC • High injection capacity • No need for pre-treatment prior to injection • No denaturation of fragile molecules • No risk of a blocked or contaminated column BENEFITS OF CPC VS. FLASH AND PREP HPLC • Purity > 99% and recovery > 95% • No sample loss • Cost effective - No expensive columns to replace • Five times less solvent consumption • High flow rate for low run times • Easily scalable (milligrams to kilograms)
CPC process. Mobile phase (yellow) is pushed through the stationary phase (blue) across a series of cells. The solutes (A, B, and C) in the mobile phase are left behind in separate cells according to their respective affinities to the stationary phase.
CPC column design. The CPC column rotates on an axis and is designed to be resistant to high pressures. The column is composed of numerous stacked discs, each of which are engraved with hundreds of twin cells. This design provides better retention of the stationary phase, allowing for higher flow rates for faster separations.
Chromatogram of CBD separated from THC using CPC. In this study, 5 g of crude extract of C. sativa flowers were subjected to CPC. Using this one-step method resulted in clean separation of CBD from THC and other compounds. 205 mg of CBD was purified from 5 g of crude extract, and the final product had a purity of over 95% as shown by HPLC analysis. For each 5 g sample, 1 L of solvent was consumed for every 10 minutes of separation. 87
Br. J. Anal. Chem., 2017, 4 (16), pp 88-89
Notices of Books Química em 50 Ensaios Ljubica Tasić, Organizer September 2017, Publisher: Editora Átomo th
The book "Chemistry in 50 assays" was launched in commemoration of the 50 anniversary of the Institute of Chemistry at the University of Campinas (Unicamp, SP, BR), and was written by more than 40 authors. It is a collection of 50 essays that guide experimental classes in undergraduate chemistry. The reported experiments are divided into six chapters, in a multidisciplinary way, leaving aside the division of the themes of classical chemistry. Read more… Excelência em Pesquisa: 50 anos do Instituto de Química da Unicamp Camila Delmondes; edited and coordinated by Ronaldo Aloise Pilli October 2017, Publisher: Editora Caluh, Campinas, SP, Brazil ISBN: 978-85-68505-02 The emergence and academic evolution of IQ-Unicamp are told in this book in a light and well-humored way by several of the leading role players of this success story. The main focus is the narrative of the facts that led to the implementation of IQ-Unicamp research lines. The book summarizes the trajectory of a success story and also serves as an important historical reference to how it is possible to create an institution of excellence in such a short time. Those interested in this book can contact Prof. Dr. Ronaldo Aloise Pilli (pilli@iqm.unicamp.br). Microwave Chemistry Giancarlo Cravotto and Diego Carnaroglio, Editors September 2017, Publisher: De Gruyter Intended to not only give an overview on the microwave technology, its historical development and theoretical background, this book also presents the exceptionally broad spectrum of applications. This book aims to enable graduate students and scientists to learn and apply the methods successfully to accelarate and enhance chemical processes. Read more… Getting READY for USP 232, 233 and 2232 - Microwave-Assisted Sample Preparation and Determination of Elemental Impurities in Pharmaceutical Products Joaquim de Araújo Nóbrega and Camillo Pirola, Authors June 2017, Milestone Srl and Ikonos Srl This book is dedicated to the new USP methods 232, 233, and 2232, which will st become effective as of January 1 , 2018. The aim of the book is to provide QA/QC practitioners and Lab Managers insights into the evolution and current status of methods and guidelines for the determination of elemental impurities, whilst educating in the best practices and optimum workflows for this demanding application. Download free eBook 88
Books Think Blank: Clean Chemistry Tools for Atomic Spectroscopy Camillo Pirola, Joaquim de Araújo Nóbrega, Robert C. Richter, Authors February 2016, Milestone Srl and Ikonos Srl Determination of trace elements is becoming a routine task in analytical laboratories. However, a lab must have full control of analytical blanks and sample preparation for obtaining accurate results. This book discusses how to control contaminations and modern strategies for microwave-assisted sample preparation. The goal of the authors was to produce a readable text for practical analysts and for everyone interested in the evolution of sample preparation strategies. Download free eBook Pharmaceutical Analysis for Small Molecules Behnam Davani, Editor August 2017, John Wiley & Sons This book provides an introduction to pharmaceutical analysis for small molecules (non-biologics) using commonly used techniques for drug characterization and performance tests. The driving force for industry to perform pharmaceutical analyses is submission of such data and supporting documents to regulatory bodies for drug approval in order to market their products. In addition, related required supporting studies including good laboratory/documentation practices as analytical instrument qualification are highlighted in this book. Read more… Analytical Techniques and Methods for Biomass Sílvio Vaz Jr., Editor 2016, Springer International Publishing This book deals with the application of techniques and methods of chemical analysis for the study of biomass and its conversion processes. The use of various techniques and analytical methods is presented and discussed in a straightforward manner, providing the reader with the possibility of choosing the most appropriate methodologies for analysis of the major classes of plant biomass and its products. Read more… Análise Química da Biomassa Sílvio Vaz Júnior, Author 2015, Publisher: Embrapa (Brasília, DF, BR) The contribution of analytical chemistry to the study of biomass production chains is essential. The chemical analyzes can be used for the determination of chemical composition, characterization of physico-chemical properties, and monitoring of the conversion processes. The use of several analytical techniques and methods is discussed in a clear way, giving the reader the opportunity to implement the most appropriate methodologies for analyzing the main classes of vegetal biomass and its products. Read more…
89
Br. J. Anal. Chem., 2017, 4 (16), pp 90-90
Periodicals & Websites
Nov./Dec. 2017 Volume 49, Nº 9
American Laboratory The American Laboratory® publication is a platform that provides comprehensive technology coverage for laboratory professionals at all stages of their careers. Unlike ® single-channel publications, American Laboratory is a multidisciplinary resource that engages scientists through print, digital, mobile, multimedia, and social channels to provide practical information and solutions for cutting-edge results. Addressing basic research, clinical diagnostics, drug discovery, environmental, food and beverage, forensics, and other markets, American Laboratory combines in-depth articles, news, and video to deliver the latest advances in their fields. Read more… LCGC
November 2017 Volume 35, Issue 11
Chromatographyonline.com is the premier global resource for unbiased, peer-reviewed technical information on the field of chromatography and the separation sciences. Combining all of the resources from the regional editions (LCGC North America, LCGC Europe, and LCGC Asia-Pacific) of award winning magazines, Chromatographyonline delivers practical, nuts-and-bolts information to help scientists and lab managers become more proficient in the use of chromatographic techniques and instrumentation, thereby making laboratories more productive and businesses around the world more successful. Read more…
Scientia Chromatographica
2017, Volume 9, Nº 2
Scientia Chromatographica is the first and to date the only Latin American scientific journal dedicated exclusively to Chromatographic and Related Techniques (Mass Spectrometry, Sample Preparation, Electrophoresis, etc.). With a highly qualified and internationally recognized Editorial Board, it covers all chromatography topics (HPLC, GC, SFC) in all their formats, in addition to discussing many related topics such as "The Pillars of Chromatography", Quality Management, Troubleshooting, Hyphenation (GC-MS, LC-MS, SPE-LC-MS/MS) and others. It also provides columns containing general information for the area, such as: calendar, meeting report, bookstore, etc. Read more… Select Science ® SelectScience promotes scientists and their work, accelerating the communication of successful science. SelectScience® informs scientists about the best products and applications through online peer-to-peer information and product reviews. Scientists can make better decisions using independent, expert information and gain easy access to manufacturers. SelectScience® informs the global community through Editorial Features, Event Coverage, Video and Webinar programs. Read more… Spectroscopy Spectroscopy's mission is to enhance productivity, efficiency, and the overall value of spectroscopic instruments and methods as a practical analytical technology across a variety of fields. Scientists, technicians, and laboratory managers gain proficiency and competitive advantage for the real-world issues they face through unbiased, peerreviewed technical articles, trusted troubleshooting advice, and best-practice application solutions. Read more…
November 2017 Volume 32, Issue 11 90
Br. J. Anal. Chem., 2017, 4 (16), pp 91-92
Events February 18 - 21 th 34 International Symposium on Microscale Separations and Bioanalysis (MSB 2018) Windsor Barra Hotel (Barra da Tijuca), Rio de Janeiro, RJ, Brazil www.msb2018.org February 26 - March 1 PITTCON Conference and Expo 2018 Orange County Convention Center, Orlando, FL, USA www.pittcon.org/pittcon-2018/ February 26 - March 2 11th Winter Symposium on Chemometrics (WSC 11) "Avrora-Klub" Center, St. Petersburg, Russia wsc.chemometrics.ru/wsc11/ May 21 - 24 41th Annual Meeting of the Brazilian Chemical Society (41th RASBQ) Rafain Palace Hotel, Foz do Iguaçu, PR, Brazil www.sbq.org.br/41ra/ June 3 - 6 2nd Latin American Congress of Clinical and Laboratory Toxicology (II TOXILATIN) Federal University of Rio Grande do Sul, Porto Alegrre, RS, Brazil June 19 - 22 40th International Conference on Environmental & Food Monitoring Santiago de Compostela, Spain www.iseac40.es June 25 - 29 17th Conference on Chemometrics in Analytical Chemistry (CAC 2018) Halifax, Canada www.cac2018halifax.com July 24 - 27 XII Workshop on Sample Preparation (XII WPA) Institute of Chemistry, University of São Paulo, São Paulo, SP, Brazil www3.iq.usp.br/ September 10 - 12 3rd International Plant Proteomics Organization World Congress (3rd INPPO) Padova, Italy www.inppo2018.dafnae.unipd.it
91
Events
September 16 - 19 19th Brazilian Meeting on Analytical Chemistry (19th ENQA) 7th Ibero-American Congress of Analytical Chemistry (7th CIAQA) Complexo Acqua DiRoma, Caldas Novas, GO, Brazil www.enqa2018.com.br/ November 4 - 8 6th Brazilian Meeting on Forensic Chemistry (6th ENQFor) & 3rd Meeting of the Brazilian Society of Forensic Sciences (SBCF) Convention Center of RibeirĂŁo Preto, SP, Brazil www.sbcf.org.br November 12 - 15 XIII Latin American Symposium on Environmental Analytical Chemistry (XIII LASEAC) La Serena, Chile December 8 - 12 7th Brazilian Conference on Mass Spectrometry (7th BrMASS) Windsor Barra Hotel, Rio de Janeiro, RJ, Brazil http://www.brmass.com
92
Br. J. Anal. Chem., 2017, 4 (16), pp 93-96
Author's Guidelines The Brazilian Journal of Analytical Chemistry (BrJAC) is a peer-reviewed scientific journal intended for professionals and institutions acting mainly in all branches of Analytical Chemistry. BrJAC is an open access journal which does not charge authors an article processing fee. Scope BrJAC is dedicated to professionals involved in science, technology and innovation projects in the area of analytical chemistry at universities, research centers and in industry. About this journal BrJAC publishes original, unpublished scientific articles and technical notes that are peer reviewed in the double-blind way. In addition, it publishes reviews, interviews, points of view, letters, sponsor reports, and features related to analytical chemistry. BrJAC's review process begins with an initial screening of the manuscripts by the editor-in-chief, who evaluates the adequacy of the study to the journal scope. Manuscripts accepted in this screening are then forwarded to at least two referees indicated by the editors. As evaluation criteria, the referees will employ originality, scientific quality and contribution to knowledge in the field of Analytical Chemistry, the theoretical foundation and bibliography, the presentation of relevant and consistent results, compliance to the journal's guidelines, and the clarity of writing and presentation. Brief description of the BrJAC sections · Articles: Full descriptions of an original research finding in Analytical Chemistry. Manuscripts submitted for publication as articles, either from universities, research centers, industry or any other public or private institution, cannot have been previously published or be currently submitted for publication in another journal. Articles undergo double-blind full peer review. · Reviews: Articles on well-established subjects, including a critical analysis of the bibliographic references and conclusions. Manuscripts submitted for publication as reviews must be original and unpublished, and undergo double-blind full peer review. · Technical Notes: Concise descriptions of a development in analytical method, new technique, procedure or equipment falling within the scope of BrJAC. Technical notes also undergo double-blind full peer review. The title of the manuscript submitted for technical note must be preceded by the words "Technical note". · Sponsor Reports: Concise descriptions of technical studies not submitted for review by referees. Sponsor responsibility documents. · Letters: Discussions, comments, suggestions on issues related to Analytical Chemistry, and consultations to authors. Letters are welcome and will be published at the discretion of the editor-in-chief. · Points of view: The expression of a personal opinion on some relevant subject in Analytical Chemistry. · Interviews: Renowned chemist researchers are invited to talk with BrJAC about their expertise and experience in Analytical Chemistry. · Releases: Articles providing new and relevant information for the community involved in analytical chemistry, and companies' announcements on the launch of new products of interest in analytical chemistry. · Features: A feature article gives to the reader a more in-depth view of a topic, a person or opinion of acknowledged interest for Analytical Chemistry. Manuscript preparation (download a template on the BrJAC website) The manuscript submitted to BrJAC must be written in English and should be as clear and succinct as possible. It must include a title, an abstract, a graphical abstract, keywords, and the following sections: Introduction, Methods, Results and Discussion, Conclusion, and References. Because the manuscripts are subjected to double-blind review, they must NOT contain the authors' names, affiliations, or acknowledgments. The manuscript must be typed in Arial font size 11 pt., and the lines numbered consecutively and double-spaced throughout the text, except in the figure captions, titles of tables and references. 93
Author's Guidelines The manuscript title should be short, clear and succinct, and a subtitle may be used, if needed. The abstract should include the objective of the study, essential information about the methods, the main results and conclusions. Then, three to five keywords must be indicated. The section titles should be typed in bold and subsections in italics. Graphics and tables must be numbered according to their citation in the text, and should appear close to the discussion about them. For figures use Arabic numbers, and for tables use Roman numbers. The captions for the figures must appear below the graphic; for the tables, above. The same result should not be presented by more than one illustration. For figures, graphs, diagrams, tables, etc. identical to others previously published in the literature, the author must ask for permission for publication from the company or scientific society holding the copyrights, and send this permission to the BrJAC editor-in-chief with the final version of the manuscript. The chemical nomenclature should conform to the rules of the International Union of Pure and Applied Chemistry (IUPAC) and Chemical Abstracts Service. It is recommended that, whenever possible, authors follow the International System of Units, the International Vocabulary of Metrology (VIM) and the NIST General Table of Units of Measurement. Abbreviations are not recommended except those recognized by the International Bureau of Weights and Measures or those recorded and established in scientific publications. If the abbreviations are numerous and relevant, place their definitions in a separate section (Glossary). The manuscript must include only the consulted references, numbered according to their citation in the text, with numbers in square brackets. It is not recommended to mention several references with identical statements - select the author who demonstrated them. It is recommended that references older than 5 (five) years be avoided, except in relevant cases. Include references that are accessible to readers. References should be thoroughly checked for errors before submission. Manuscripts must be submitted in conjunction with an analysis report of plagiarism obtained through anti-plagiarism software. BrJAC indicates CopySpider© 2013 freeware to support plagiarism checking analyzes. Download the CopySpider freeware: www.copyspider.com.br
Examples of reference formatting Journals 1. Arthur, K. L.; Turner, M. A.; Brailsford, A. D.; Kicman, A. T.; David A. Cowan, D. A.; Reynolds, J. C.; Creaser, C. S. Anal. Chem. 2017, 89, pp 7431- 7437 (DOI: 10.1021/acs.analchem.7b000940). The titles of journals must be abbreviated as defined by the Chemical Abstracts Service Source Index (http://cassi.cas.org/search.jsp). If a paper does not have a full reference, please provide its DOI, if available, or its Chemical Abstracts reference information. Electronic journals 2. Natarajan, S.; Kempegowda, B. K. LCGC North America, 2015, 33 (9), pp 718-726. Available from: http://www.chromatographyonline.com/analyzing-trace-levels-carbontetrachloride-drugsubstanceheadspace-gc-flame-ionization-detection [Accessed 10 November 2015]. Books 3. Burgot, J.-L. Ionic Equilibria in Analytical Chemistry. Springer Science & Business Media, New York, 2012, Chapter 11, p 181. 4. Griffiths, W. J.; Ogundare, M.; Meljon, A.; Wang, Y. Mass Spectrometry for Steroid Analysis. In: Mike, S.L. (Ed.). Mass Spectrometry Handbook, v. 7 of Wiley Series on Pharmaceutical Science and Biotechnology: Practices, Applications and Methods. John Wiley & Sons, Hoboken, N.J., 2012, pp 297-338. Standard methods 5. International Organization for Standardization. ISO 26603. Plastics — Aromatic isocyanates for use in the production of polyurethanes — Determination of total chlorine. Geneva, CH: ISO, 2017.
94
Author's Guidelines Master’s and doctoral theses or other academic literature 1. 6. Ek, P. New methods for sensitive analysis with nanoelectrospray ionization mass spectrometry. Doctoral thesis, 2010, School of Chemical Science and Engineering, Royal Institute of Technology, Stockholm, Sweden. Patents 2. 7. Trygve, R.; Perelman, G. US 9053915 B2, June 9 2015, Agilent Technologies Inc., Santa Clara, CA, US. Web pages 3. 8. http://www.chromedia.org/chromedia [Accessed 21 June 2015]. Unpublished source 9. Mendes, B.; Silva, P.; Pereira, J.; Silva, L. C.; Câmara, J. S. Poster presented at: 36th International 4. Symposium on Capillary Chromatography, 2012, Riva del Garda, Trento, IT. 10. Author, A. A. J. Braz. Chem. Soc., in press. 5. 11. Author, B. B., 2015, submitted for publication. 6. 7. 12. Author, C. C., 2011, unpublished manuscript. Note: Unpublished results may be mentioned only with express authorization of the author(s). Personal communications can be accepted exceptionally. Manuscript submission Three different PDF files, as described below, must be sent online through the website www.brjac.com.br I. A cover letter addressed to the editor-in-chief with the full manuscript title, the full names of the authors and their affiliations, the complete contact information of the corresponding author, including the ORCID iD, and the manuscript abstract. This letter must present why the manuscript is appropriate for publication in BrJAC, and contain a statement that the article has not been previously published and is not under consideration for publication elsewhere. The corresponding author must declare on behalf of all the authors of the manuscript any financial conflicts of interest or lack thereof. This statement should include all potential sources of bias such as affiliations, funding sources and financial or management relationships which may constitute a conflict of interest. When the manuscript belongs to more than one author, the corresponding author must also declare that all authors agree with publication in BrJAC. II.The manuscript file that must NOT mention the names of the authors or the place where the work was performed, but must include the title, abstract, keywords, and all sections of the work, including tables and figures, but excluding acknowledgments that will be included in the final paper upon completion of the review process. III. An analysis report of plagiarism on the manuscript. A Sponsor Report should be sent as a Word file attached to a message to the email brjac@brjac.com.br Revised manuscript submission Based on the comments and suggestions of the reviewers and editors a revision of the manuscript may be requested to the authors. The revised manuscript submitted by the authors must contain the changes made in the manuscript clearly highlighted. A letter without any author's information must also be sent with each reviewer's comment items and a response to each item. Copyright When submitting their manuscript for publication, the authors agree that the copyright will become the property of the Brazilian Journal of Analytical Chemistry, if and when accepted for publication. The copyright comprises exclusive rights of reproduction and distribution of the articles, including reprints, photographic reproductions, microfilms or any other reproductions similar in nature, including translations. Final Considerations
Whatever the nature of the submitted manuscript, it must be original in terms of methodology, information, interpretation or criticism. As to the contents of published articles, the sole responsibility belongs to the authors, and Br. J. Anal. Chem. and its editors, editorial board, employees and collaborators are fully 95
Author's Guidelines exempt from any responsibility for the data, opinions or unfounded statements BrJAC reserves the right to make, whenever necessary, small alterations to the manuscripts in order to adapt them to the journal rules or make them clearer in style, while respecting the original contents. The article will be sent to the authors for approval prior to publication.
96
rd meeting of the
3
6 ENQ th
Brazilian Society of Forensic Sciences
For
National Meeting of Forensic Chemistry
Integrated Congress
04 to 08 november 2018 Convention Center - Ribeirão Preto - SP - Brazil
"The challenges of Forensic Sciences in the integration between knowledge, intelligence and expert technique" Organized by
Held by
Brazilian Society of Forensic Sciences UN
ER
LO
University of São Paulo IV
U PA S ID ADE DE SÃO
Brazilian Society of Forensic Sciences, Faculty of Philosophy, Sciences and Letters of Ribeirão Preto (FFCLRP), and University of São Paulo (USP)
http://www.sbcf.org.br
July â&#x20AC;&#x201C; September 2017 Volume 4 Number 16