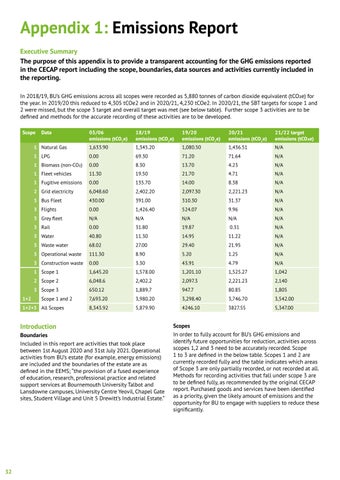
Appendix 1: Emissions Report Executive Summary The purpose of this appendix is to provide a transparent accounting for the GHG emissions reported in the CECAP report including the scope, boundaries, data sources and activities currently included in the reporting. In 2018/19, BU’s GHG emissions across all scopes were recorded as 5,880 tonnes of carbon dioxide equivalent (tCO2e) for the year. In 2019/20 this reduced to 4,305 tCOe2 and in 2020/21, 4,230 tCOe2. In 2020/21, the SBT targets for scope 1 and 2 were missed, but the scope 3 target and overall target was met (see below table). Further scope 3 activities are to be defined and methods for the accurate recording of these activities are to be developed. Scope
1+2
Data
05/06 emissions (tCO2e)
18/19 emissions (tCO2e)
19/20 emissions (tCO2e)
20/21 emissions (tCO2e)
21/22 target emissions (tCO2e)
1 Natural Gas
1,633.90
1,345.20
1,080.50
1,436.51
N/A
1 LPG
0.00
69.30
71.20
71.64
N/A
1 Biomass (non-CO2)
0.00
8.30
13.70
4.23
N/A
1 Fleet vehicles
11.30
19.50
21.70
4.71
N/A
1 Fugitive emissions
0.00
135.70
14.00
8.38
N/A
2 Grid electricity
6,048.60
2,402.20
2,097.30
2,221.23
N/A
3 Bus Fleet
430.00
391.00
310.30
31.37
N/A
3 Flights
0.00
1,426.40
524.07
9.96
N/A
3 Grey fleet
N/A
N/A
N/A
N/A
N/A
3 Rail
0.00
31.80
19.87
0.31
N/A
3 Water
40.80
11.30
14.95
11.22
N/A
3 Waste water
68.02
27.00
29.40
21.95
N/A
3 Operational waste
111.30
8.90
5.20
1.25
N/A
3 Construction waste
0.00
3.30
43.91
4.79
N/A
1 Scope 1
1,645.20
1,578.00
1,201.10
1,525.27
1,042
2 Scope 2
6,048.6
2,402.2
2,097.3
2,221.23
2,140
3 Scope 3
650.12
1,889.7
947.7
80.85
1,805
7,693.20
3,980.20
3,298.40
3,746.70
3,542.00
8,343.92
5,879.90
4246.10
3827.55
5,347.00
Scope 1 and 2
1+2+3 All Scopes
Introduction Boundaries Included in this report are activities that took place between 1st August 2020 and 31st July 2021. Operational activities from BU’s estate (for example, energy emissions) are included and the boundaries of the estate are as defined in the EEMS; “the provision of a fused experience of education, research, professional practice and related support services at Bournemouth University Talbot and Lansdowne campuses, University Centre Yeovil, Chapel Gate sites, Student Village and Unit 5 Drewitt’s Industrial Estate.”
32
Scopes In order to fully account for BU’s GHG emissions and identify future opportunities for reduction, activities across scopes 1,2 and 3 need to be accurately recorded. Scope 1 to 3 are defined in the below table. Scopes 1 and 2 are currently recorded fully and the table indicates which areas of Scope 3 are only partially recorded, or not recorded at all. Methods for recording activities that fall under scope 3 are to be defined fully, as recommended by the original CECAP report. Purchased goods and services have been identified as a priority, given the likely amount of emissions and the opportunity for BU to engage with suppliers to reduce these significantly.


