1 minute read
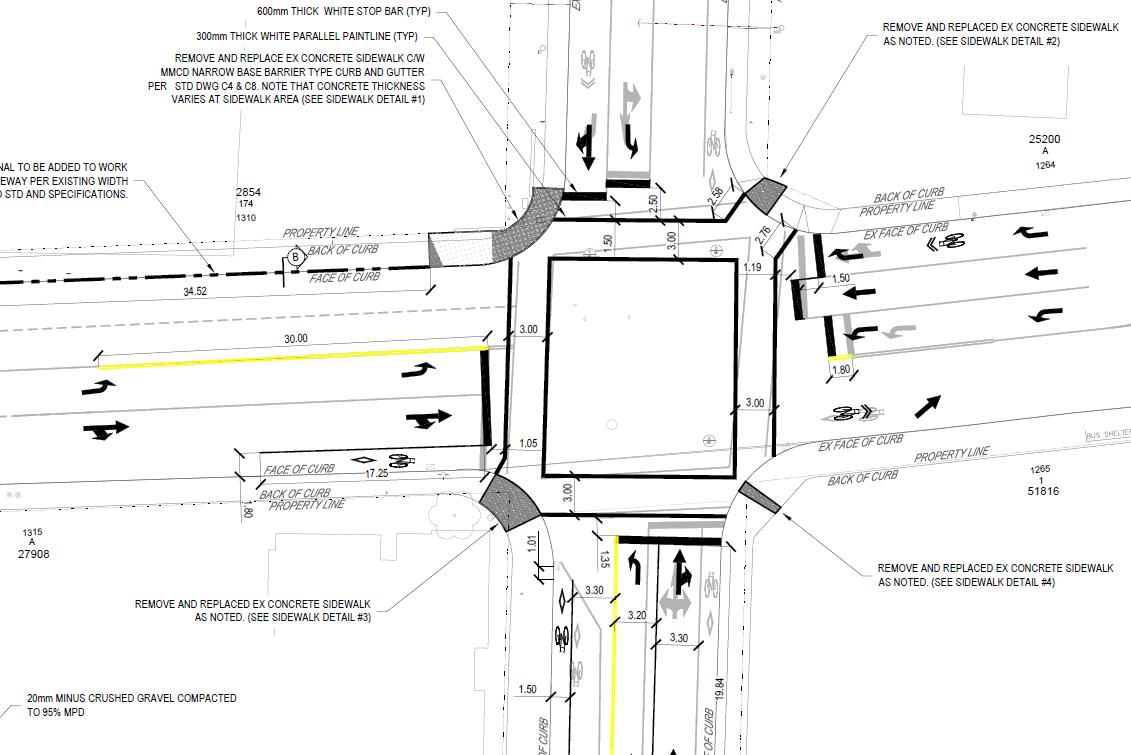
Figure 3: Future Esquimalt Road / Admirals Road Intersection Geometry


signal phasing will be changed to split phasing for all approached. This means that each direction of traffic will proceed on a green while all other directions are stopped. The Sychro modelling reflects this updated intersection geometry and signal phasing. See Figure 3 for the proposed changes to the intersection.

Figure 3: Future Esquimalt Road / Admirals Road Intersection Geometry
Other intersections in the study area have the following traffic control: • Lyall Street / Admirals Road – All Way Stop Control; • Lyall Street / Fraser Street – All Way Stop Control; • Fraser Street / Esquimalt Road – North Stop Control; • Fraser Street / Carlisle Avenue – East Stop Control; and • Fraser Street / Site Access – East Stop Control.
2.3 TRAFFIC VOLUMES
Traffic counts were undertaken during AM and PM peak hours on March 11, 2021 at the Fraser Street / Lyall Street and Fraser Street / Carlisle Avenue intersections. The remaining intersections we counted as part of a city-wide network analysis WATT Consulting conducted in 2018 for the Township. The peak hours occurred between 8:00 - 9:00AM and 4:00 - 5:00PM.
At the time of the count, the province of BC was under a provincial health order to have individuals limit contact with others outside of their immediate family (Phase 3 of the restart plan). Travel habits have continued to adjust back to more ‘normal levels’ as time has progressed; however, the 2021 count volumes were adjusted by a COVID-19 factor. The factor was obtained via comparisons to the permanent MOTI traffic counter located on West Burnside Road, 0.5km East of Route 1, Colwood as this is the nearest counter (8km away). The most recent MOTI traffic data available is December 2020 (during Phase 3 of the restart plan). The December 2020 volume was compared to the December 2019 volumes (pre-COVID pandemic). After adjusting for background traffic growth, a COVID-19 factor of 1.2 (20% increase) has been applied to count volumes collected in 2021 to reflect ‘non-COVID conditions’. See Figure 4 for the 2020 and 2019 traffic volumes from the count station.


