|
Alternative Reimbursement Models
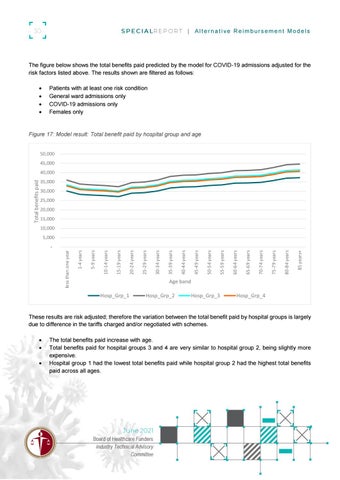
The figure below shows the total benefits paid predicted by the model for COVID-19 admissions adjusted for the risk factors listed above. The results shown are filtered as follows:
Patients with at least one risk condition General ward admissions only COVID-19 admissions only Females only
Figure 17: Model result: Total benefit paid by hospital group and age 50,000 45,000
Total benefits paid
40,000 35,000 30,000 25,000 20,000 15,000 10,000 5,000
85 years+
80-84 years
75-79 years
70-74 years
65-69 years
60-64 years
55-59 years
50-54 years
45-49 years
40-44 years
35-39 years
30-34 years
25-29 years
20-24 years
15-19 years
10-14 years
5-9 years
1-4 years
less than one year
-
Age band Hosp_Grp_1
Hosp_Grp_2
Hosp_Grp_3
Hosp_Grp_4
These results are risk adjusted; therefore the variation between the total benefit paid by hospital groups is largely due to difference in the tariffs charged and/or negotiated with schemes.
The total benefits paid increase with age. Total benefits paid for hospital groups 3 and 4 are very similar to hospital group 2, being slightly more expensive. Hospital group 1 had the lowest total benefits paid while hospital group 2 had the highest total benefits paid across all ages.
Board of Healthcare Funders Industry Technical Advisory Committee