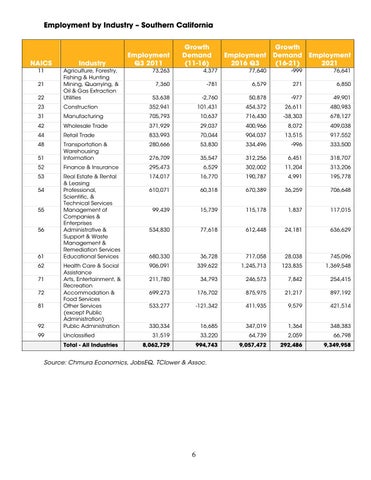
Employment by Industry – Southern California
Employment Q3 2011
Growth Demand (11-16)
Employment 2016 Q3
Growth Demand (16-21)
Employment 2021
NAICS
Industry
11
22
Agriculture, Forestry, Fishing & Hunting Mining, Quarrying, & Oil & Gas Extraction Utilities
53,638
-2,760
50,878
-977
49,901
23
Construction
352,941
101,431
454,372
26,611
480,983
31
Manufacturing
705,793
10,637
716,430
-38,303
678,127
42
Wholesale Trade
371,929
29,037
400,966
8,072
409,038
44
Retail Trade
833,993
70,044
904,037
13,515
917,552
48
280,666
53,830
334,496
-996
333,500
51
Transportation & Warehousing Information
276,709
35,547
312,256
6,451
318,707
52
Finance & Insurance
295,473
6,529
302,002
11,204
313,206
53
Real Estate & Rental & Leasing Professional, Scientific, & Technical Services Management of Companies & Enterprises Administrative & Support & Waste Management & Remediation Services Educational Services
174,017
16,770
190,787
4,991
195,778
610,071
60,318
670,389
36,259
706,648
99,439
15,739
115,178
1,837
117,015
534,830
77,618
612,448
24,181
636,629
680,330
36,728
717,058
28,038
745,096
906,091
339,622
1,245,713
123,835
1,369,548
211,780
34,793
246,573
7,842
254,415
699,273
176,702
875,975
21,217
897,192
533,277
-121,342
411,935
9,579
421,514
92
Health Care & Social Assistance Arts, Entertainment, & Recreation Accommodation & Food Services Other Services (except Public Administration) Public Administration
330,334
16,685
347,019
1,364
348,383
99
Unclassified
31,519
33,220
64,739
2,059
66,798
8,062,729
994,743
9,057,472
292,486
9,349,958
21
54 55 56
61 62 71 72 81
Total - All Industries
73,263
4,377
77,640
-999
76,641
7,360
-781
6,579
271
6,850
Source: Chmura Economics, JobsEQ, TClower & Assoc.
6