A summary of UNFI's sustainability efforts during Fiscal Year 2025.
This year’s report was published on: November 18, 2025. A summary of UNFI’s sustainability efforts during Fiscal Year 2025.
We are proud to share UNFI's Fiscal Year 2025 Impact Report, our 15th annual disclosure on our progress toward sustainability commitments and our related impact goals. Unless stated otherwise, the information in this report covers Fiscal Year 2025, which ran from August 4, 2024, to August 2, 2025.
For questions, please contact impact@unfi.com
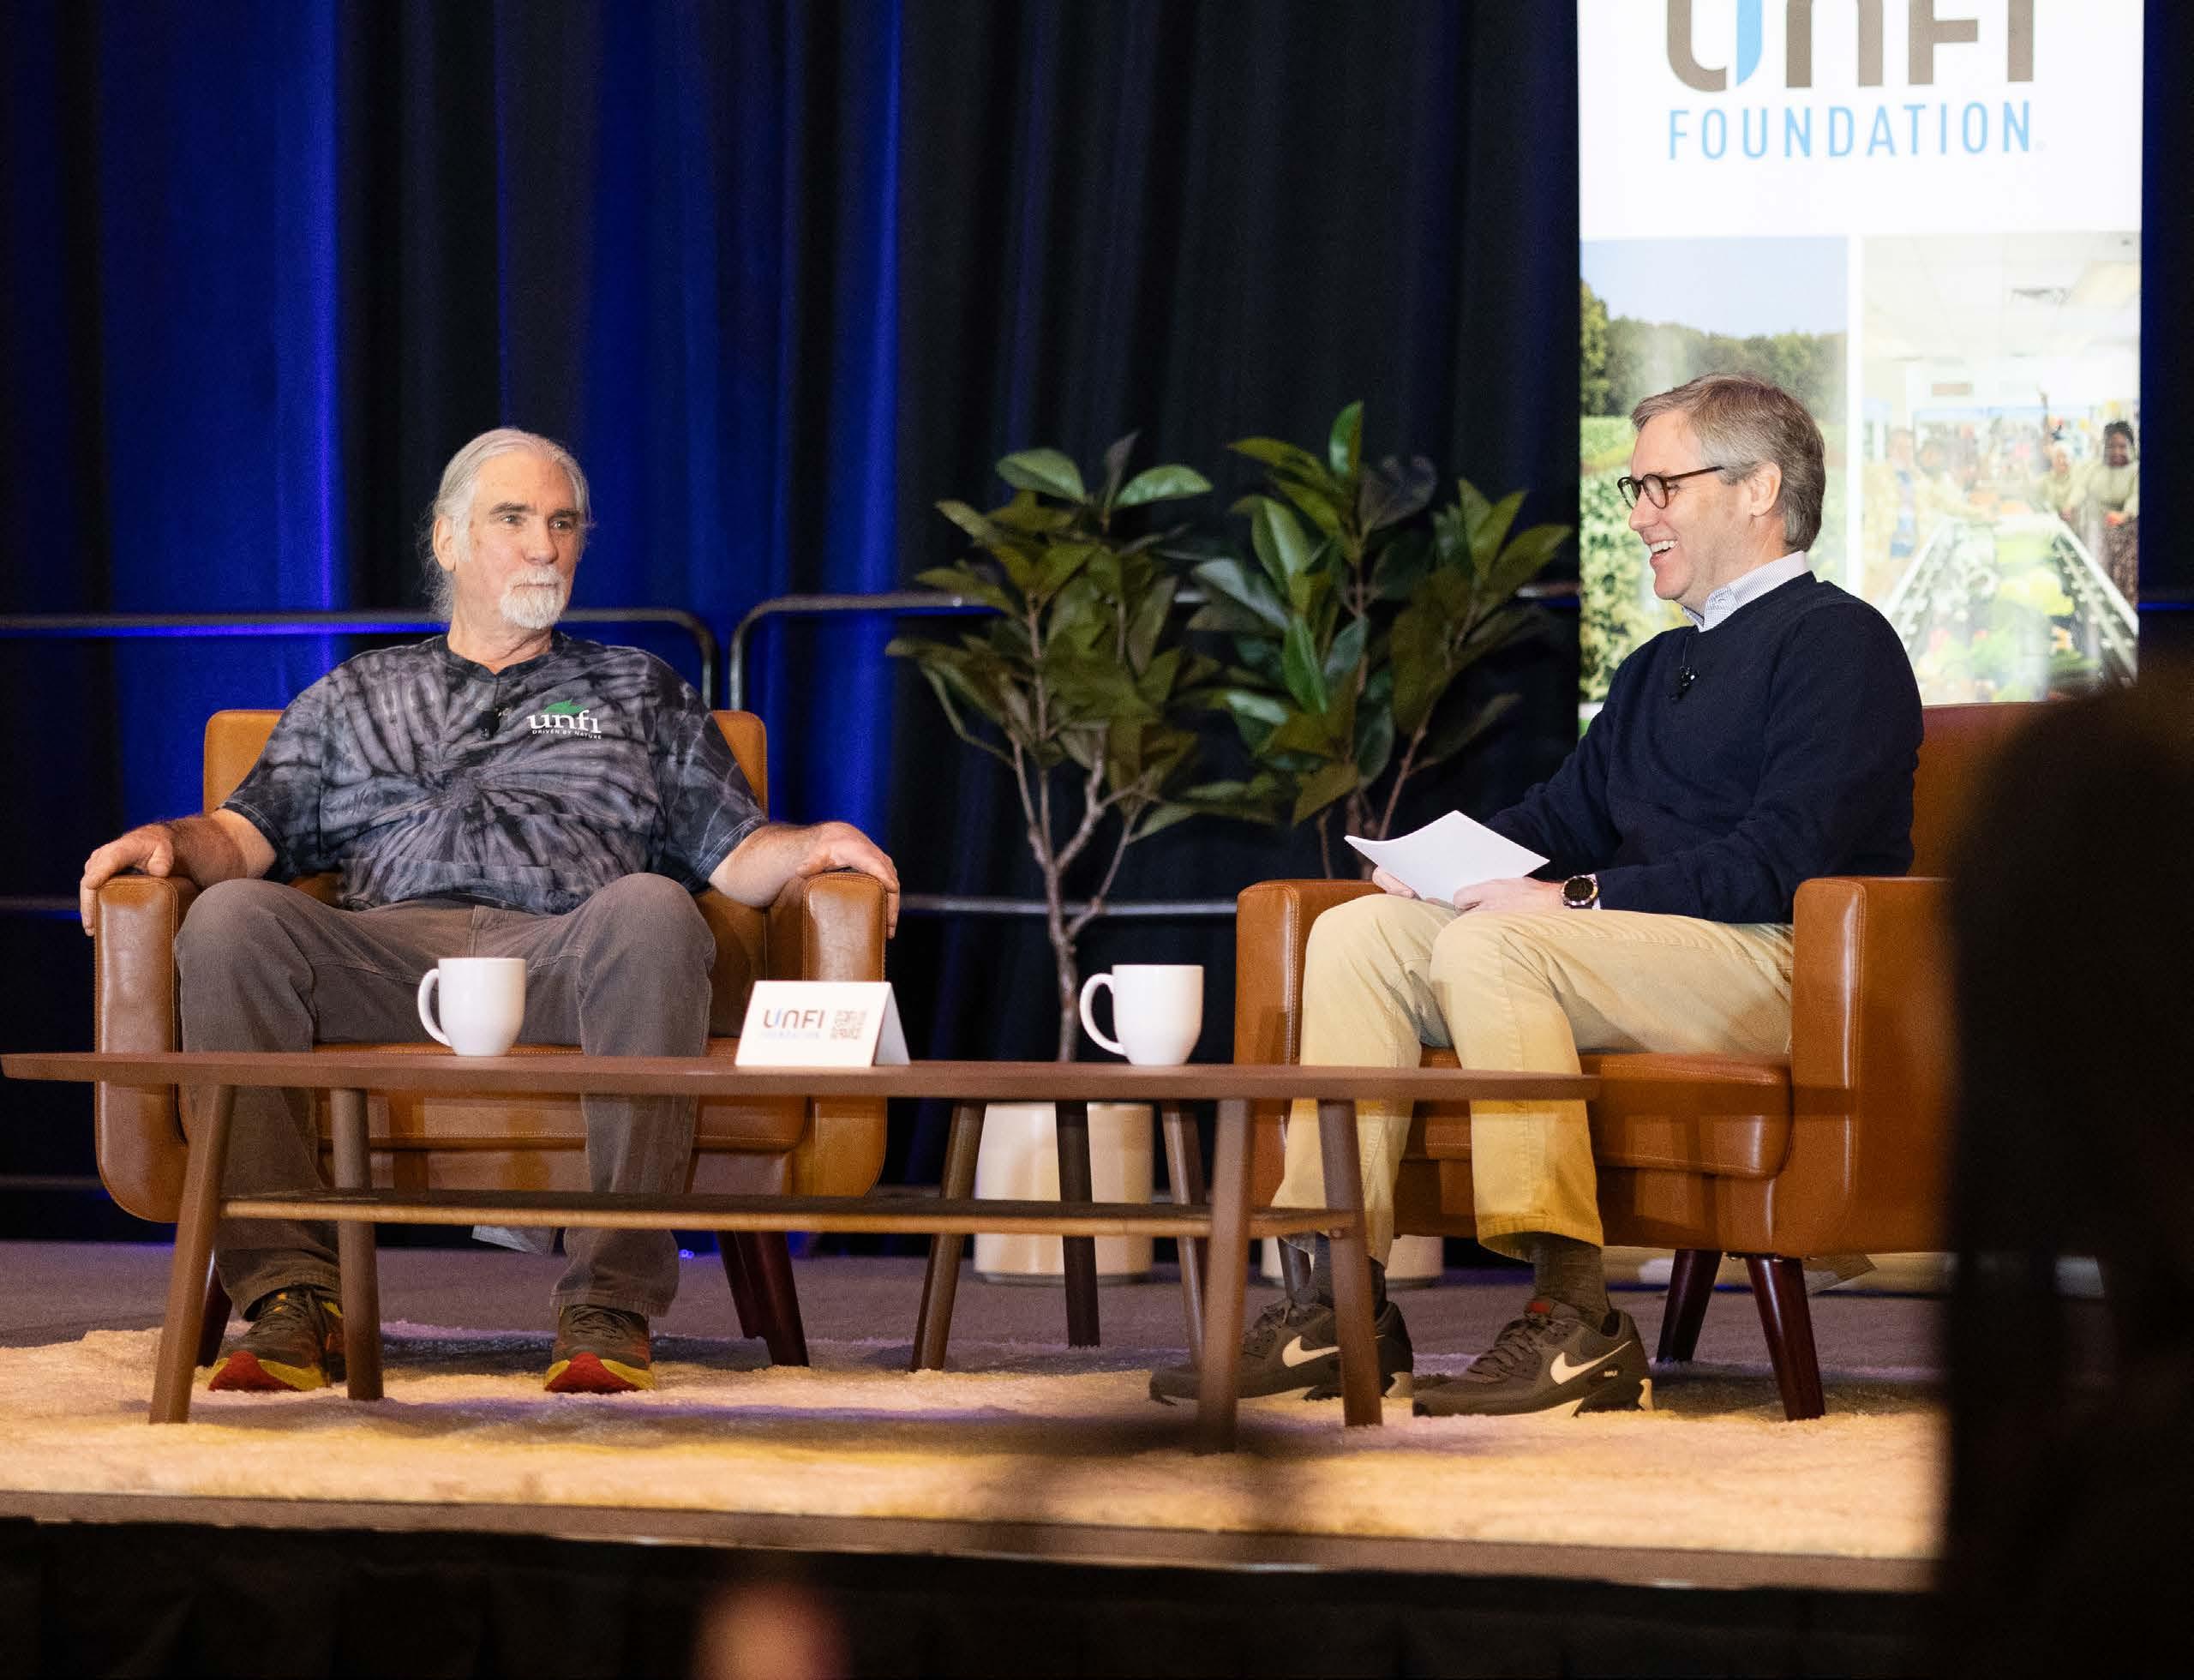
A Letter from Leadership | Sandy Douglas
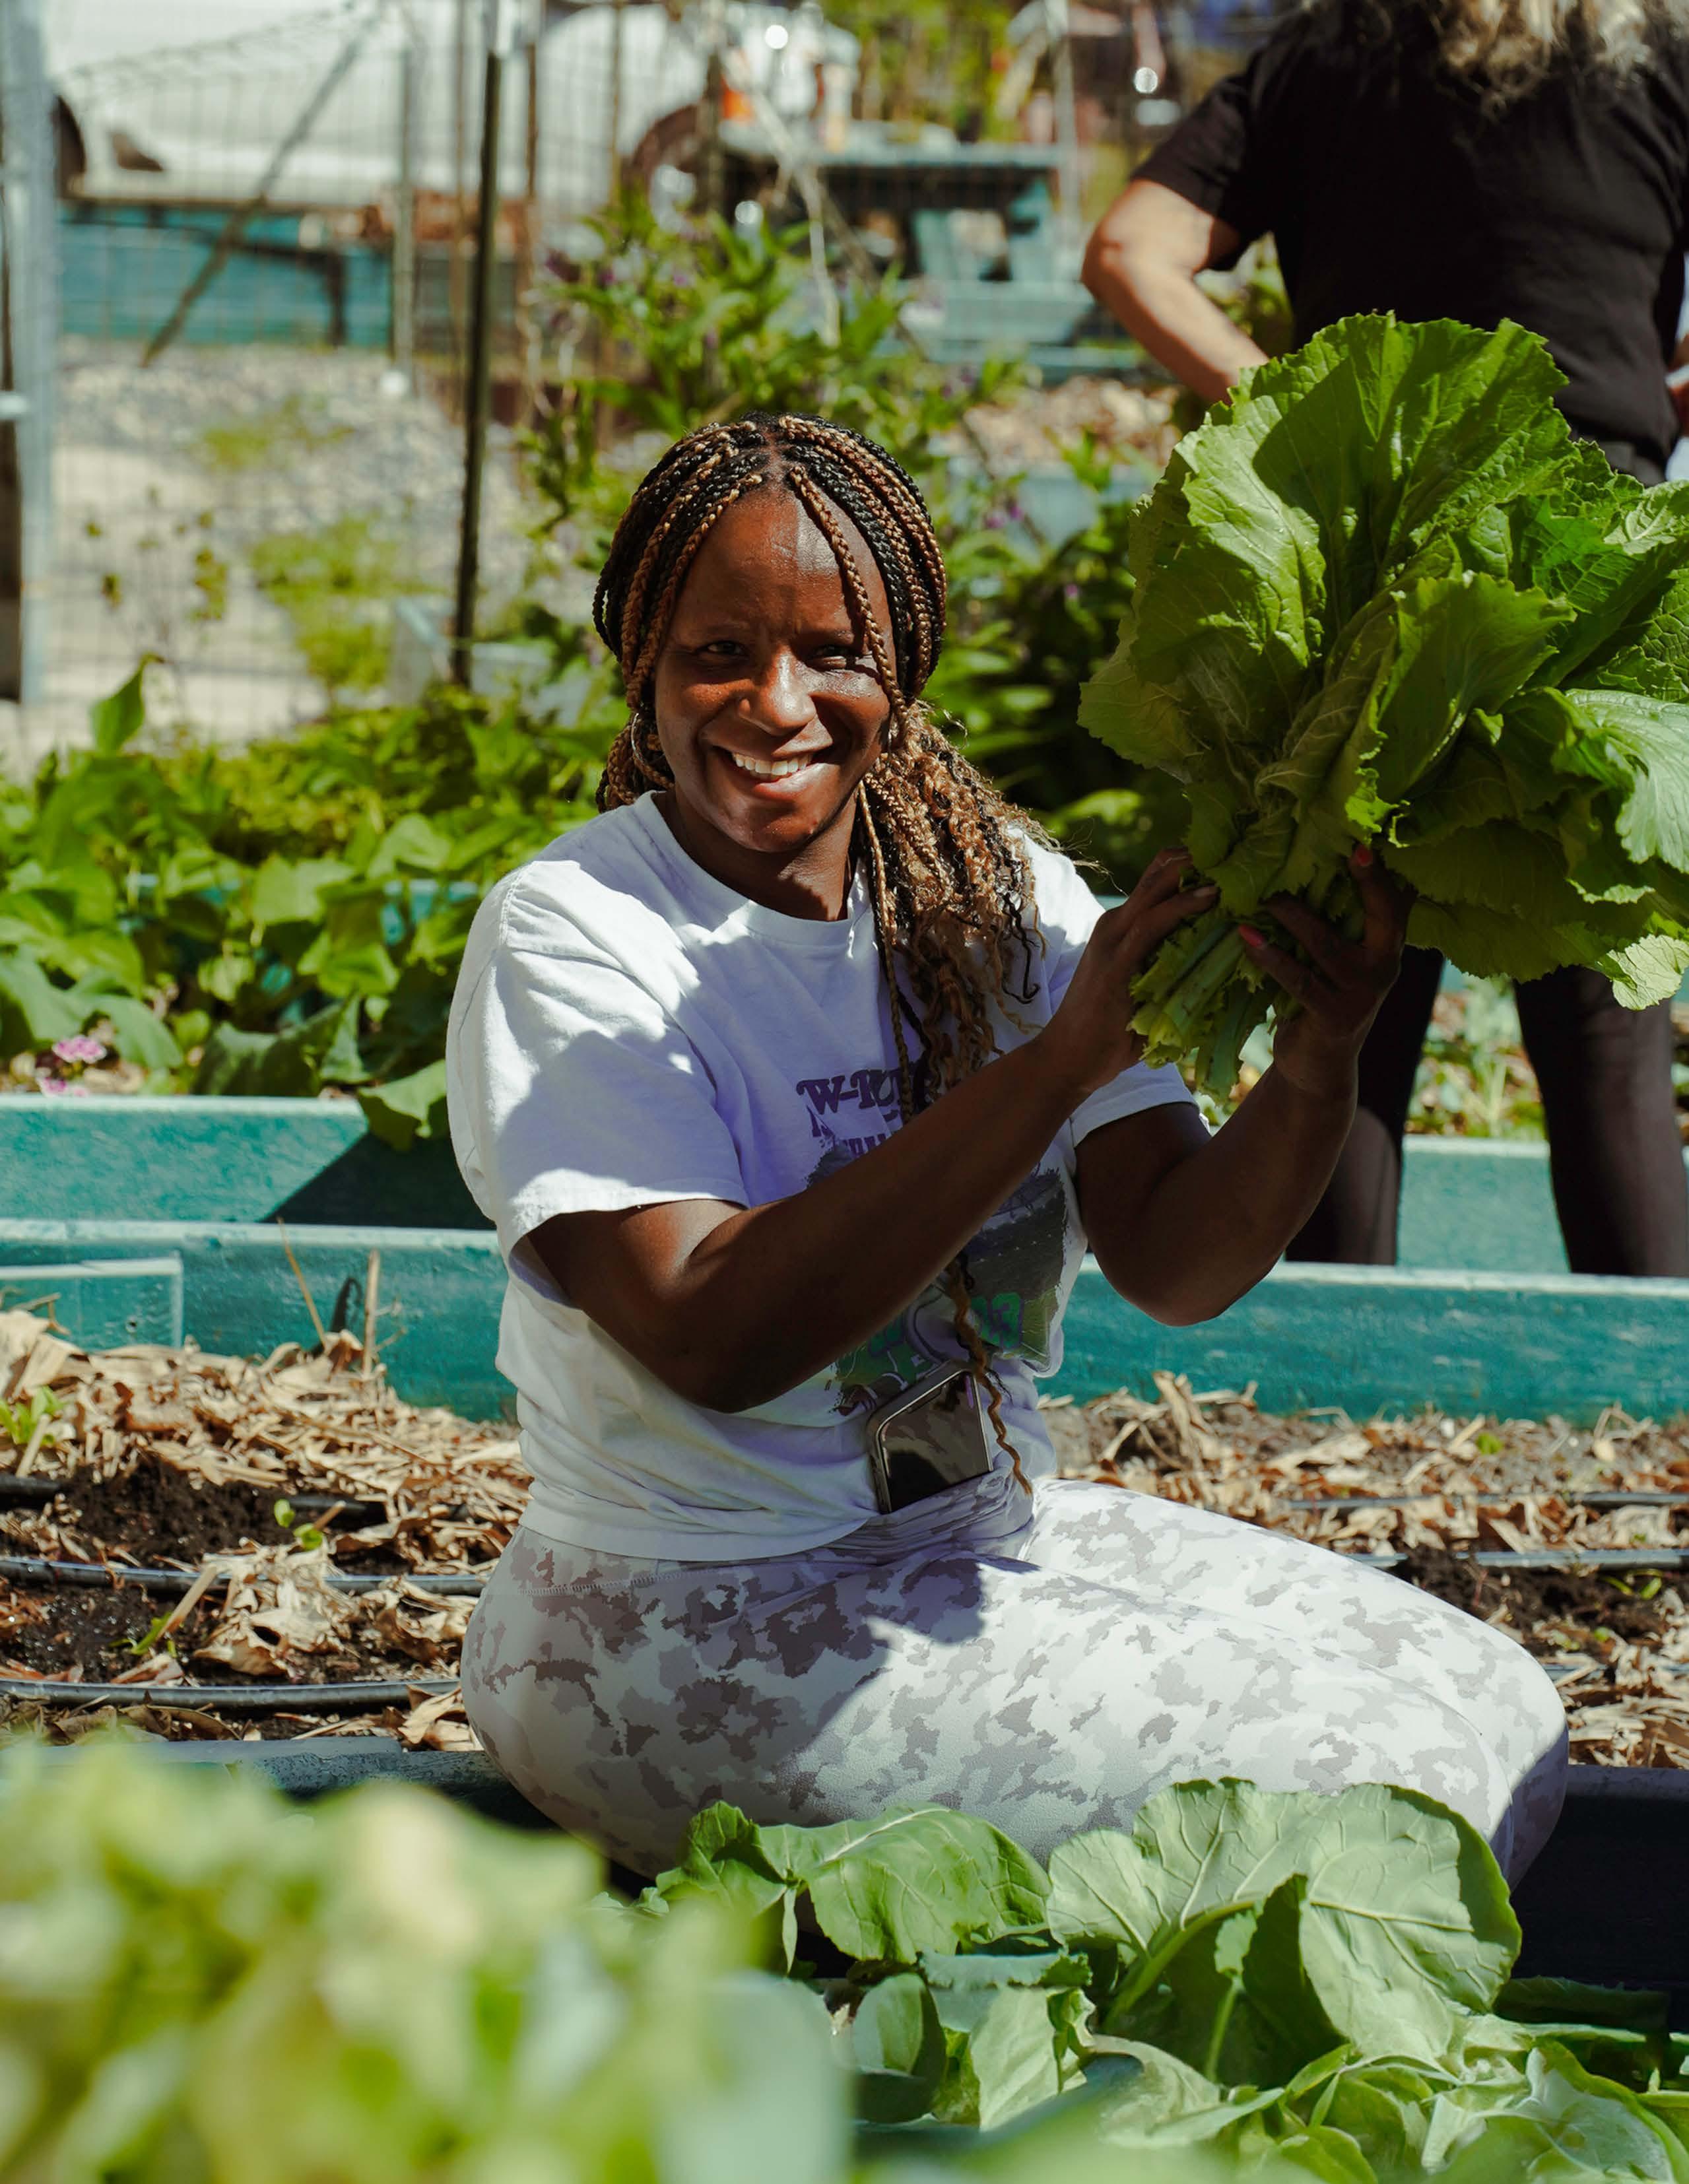
For nearly 50 years, UNFI has proudly supported the growth of local grocers and food manufacturers by helping them bring healthy, high-quality food to communities across North America.
Over time, we’ve grown our distribution network, expanded our supplier base, and incorporated more quality products into the supply chain. As our business continues to evolve, our purpose remains constant: deliver better food and create a better future for everyone we serve.
UNFI’s Better for All impact strategy is embedded in our business strategy: to create value for our customers and suppliers while becoming a more effective and efficient company.
We’ve streamlined our impact pillars to connect even more closely to our business goals: Resilient Supply Chains, Thriving Associates, Efficient and Sustainable Operations, and Nourished Communities. As we continue to make progress in each of these impact areas, we believe we will strengthen our business, create more value for our stakeholders, and protect our planet, now and in the future.
This year, we achieved two of our impact goals: 1) we supported soil health through regenerative and organic practices on over one million acres of land—ahead of our target deadline of 2030; and 2) we achieved Safe Quality Food (SQF) certification at all eligible distribution centers.
We’re proud of the progress we’ve made, and we see even more opportunity ahead to collaborate with our customers, suppliers, and associates on solutions that benefit the food retail industry, the communities we serve, and the planet we share.
Thank you to our associates and partners for being part of this 50-year journey to bring better food to more people. We invite you to explore the stories, milestones, and learnings that have guided us so far, and join us as we continue building a better food system—and a better future—for all.
Sandy Douglas, Chief Executive Officer
About UNFI
As North America’s premier wholesale grocer, we work to deliver a wide variety of fresh, branded, and owned brand products to more than 30,000 locations—from natural product superstores and independent retailers to conventional supermarket chains, eCommerce providers, and foodservice customers. We offer value-added services and marketing support, including data, market insights, and shelf management, to help our customers and suppliers build their businesses and brands, further differentiating themselves in the marketplace.
Our business-aligned impact strategy, Better for All, both complements and enhances our operations through a focus on creating shared value across our ecosystem.
Together with our partners, we are working toward a food system that serves everyone better, bringing great food, more choices, and fresh thinking to communities across the U.S. and Canada.
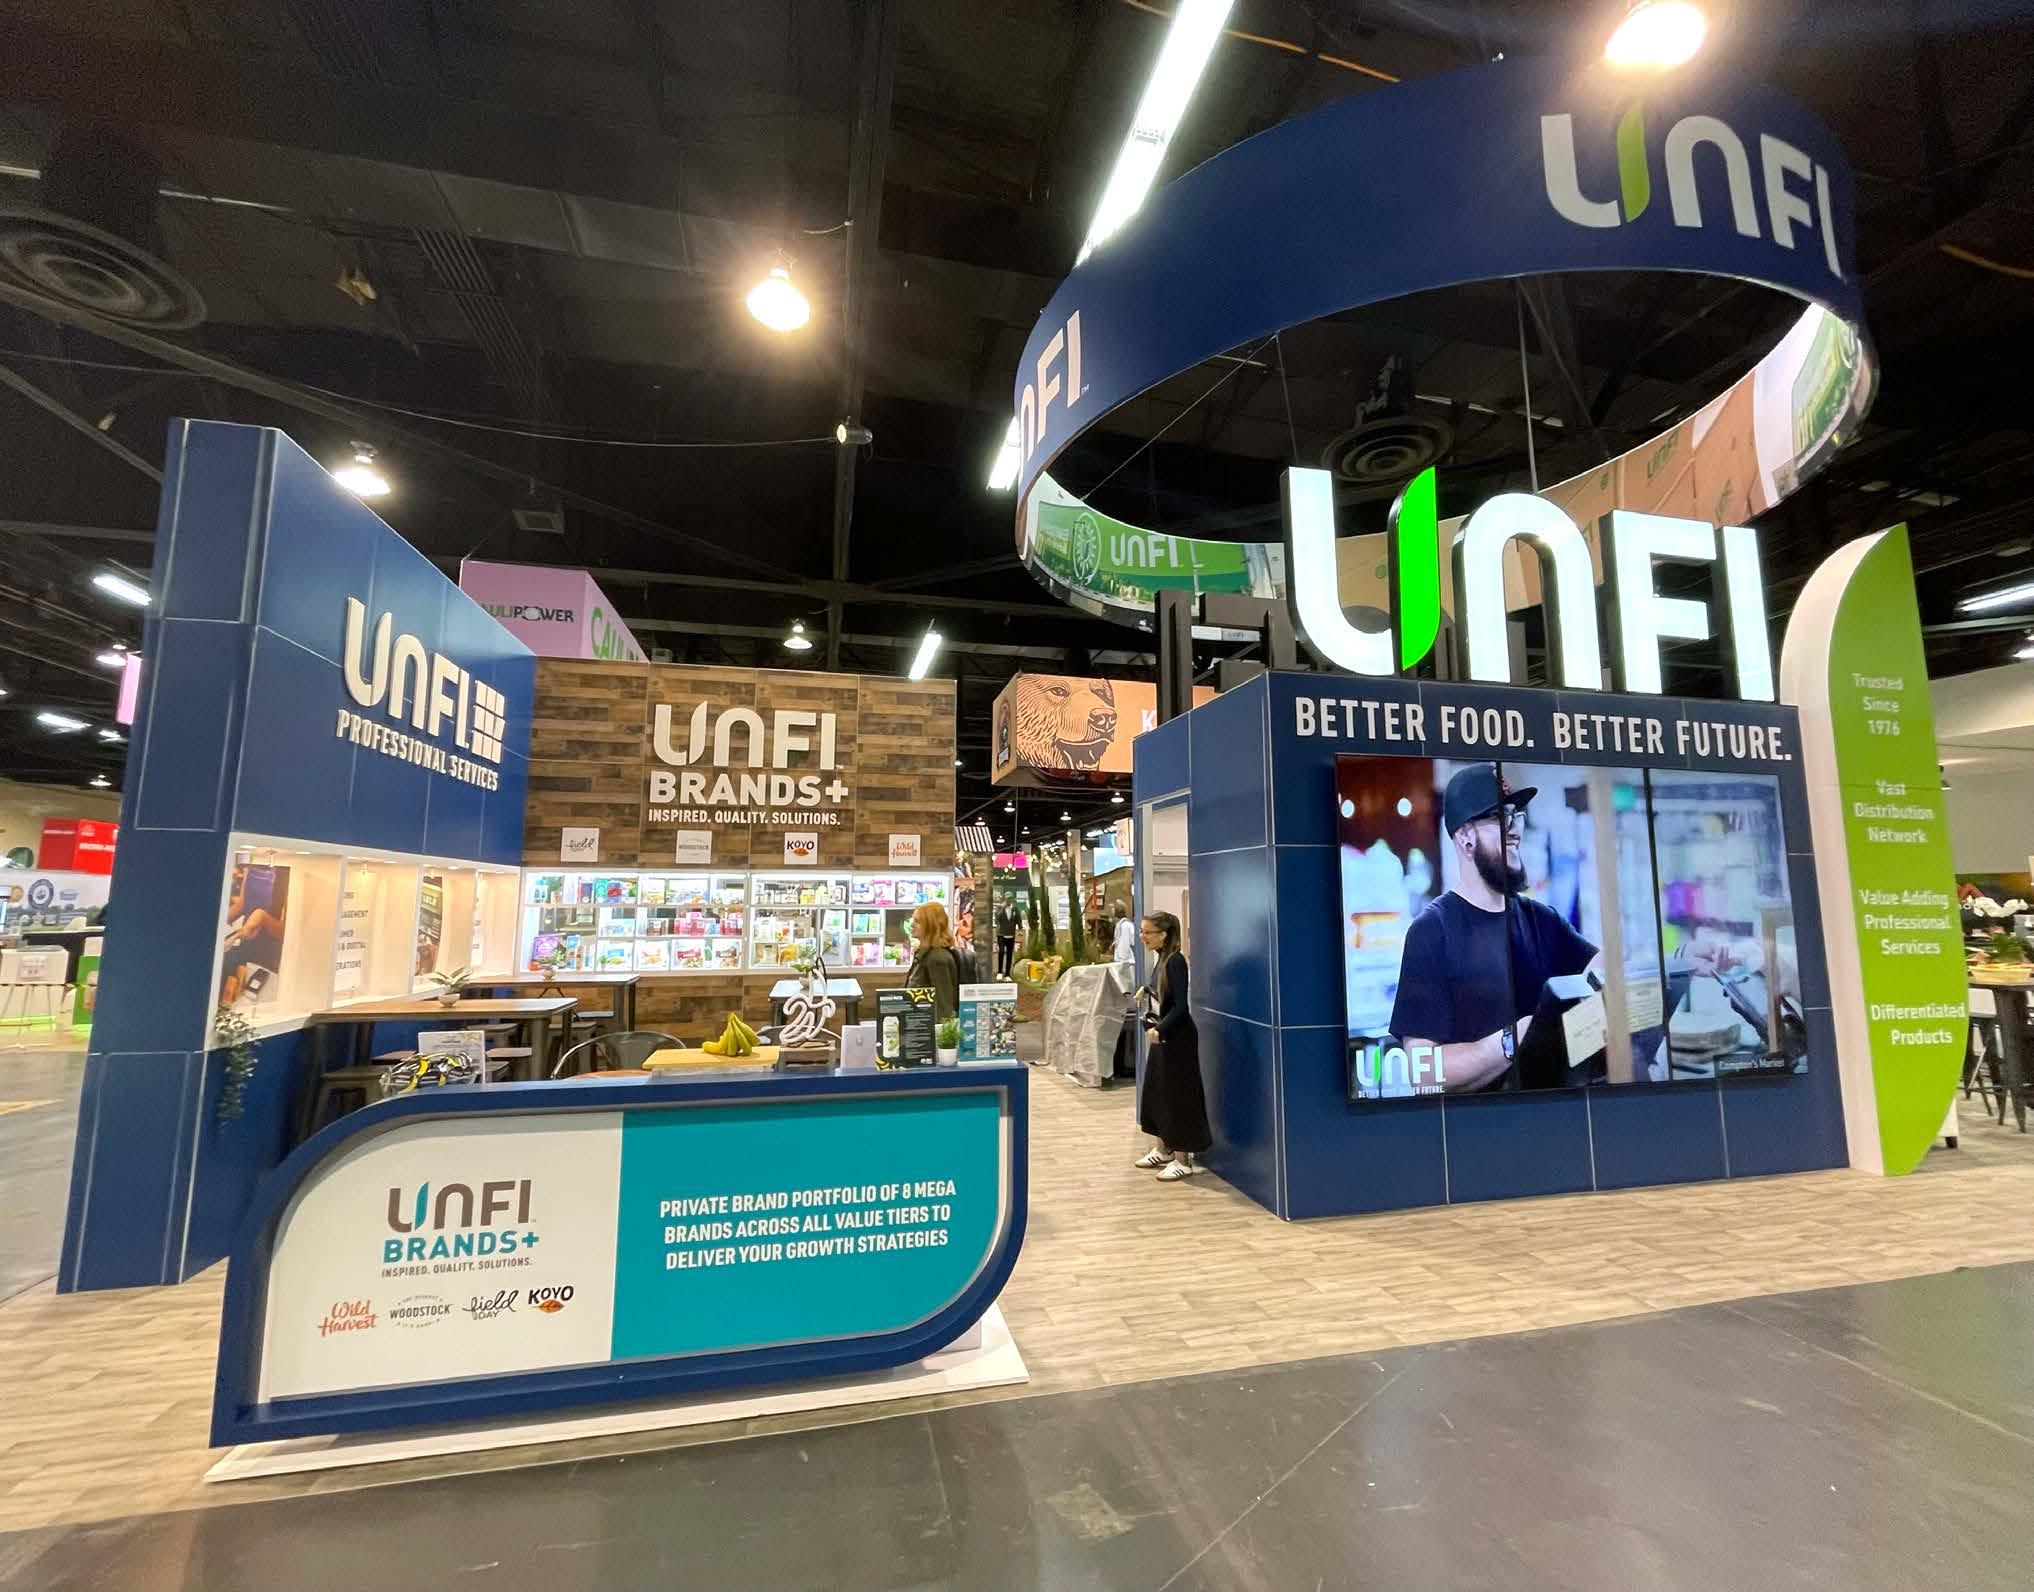
Better Food. Better Future. Better for All.
We are focused on adding value throughout the supply chain and creating a Better Future for all our stakeholders:
For Customers
by providing a superior experience, a portfolio of differentiated and competitively priced products, and value-added programs and services.
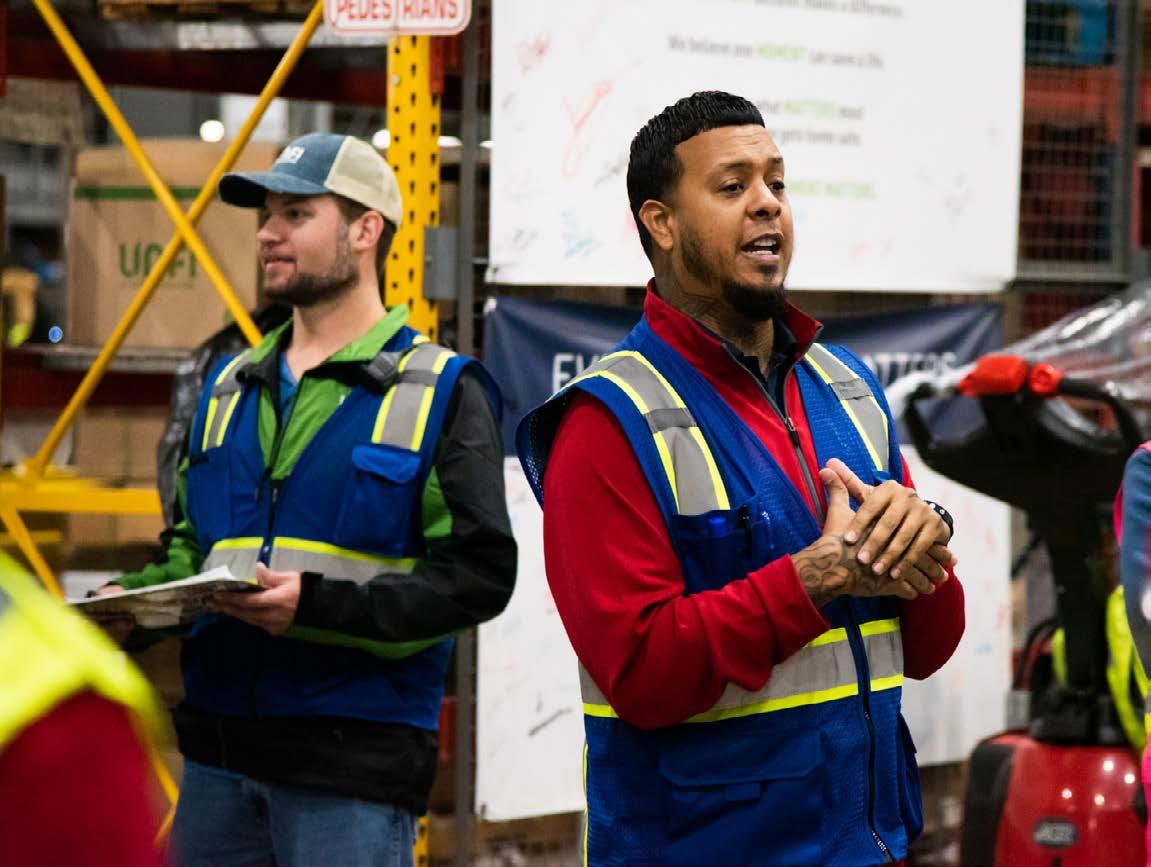
For Associates by building an inclusive, high-performing culture that focuses on safety and operational excellence and inspires everyone to reach their full potential.
For Suppliers by offering a seamless experience, go-to-market services, and insights to help them grow their brands with UNFI’s diverse retailer network.
For Communities by improving access to quality food, empowering associates to give back, and protecting the planet we share.
By the Numbers
Nearly 10,000 suppliers
11 owned brands
~ 230,000 product SKUs
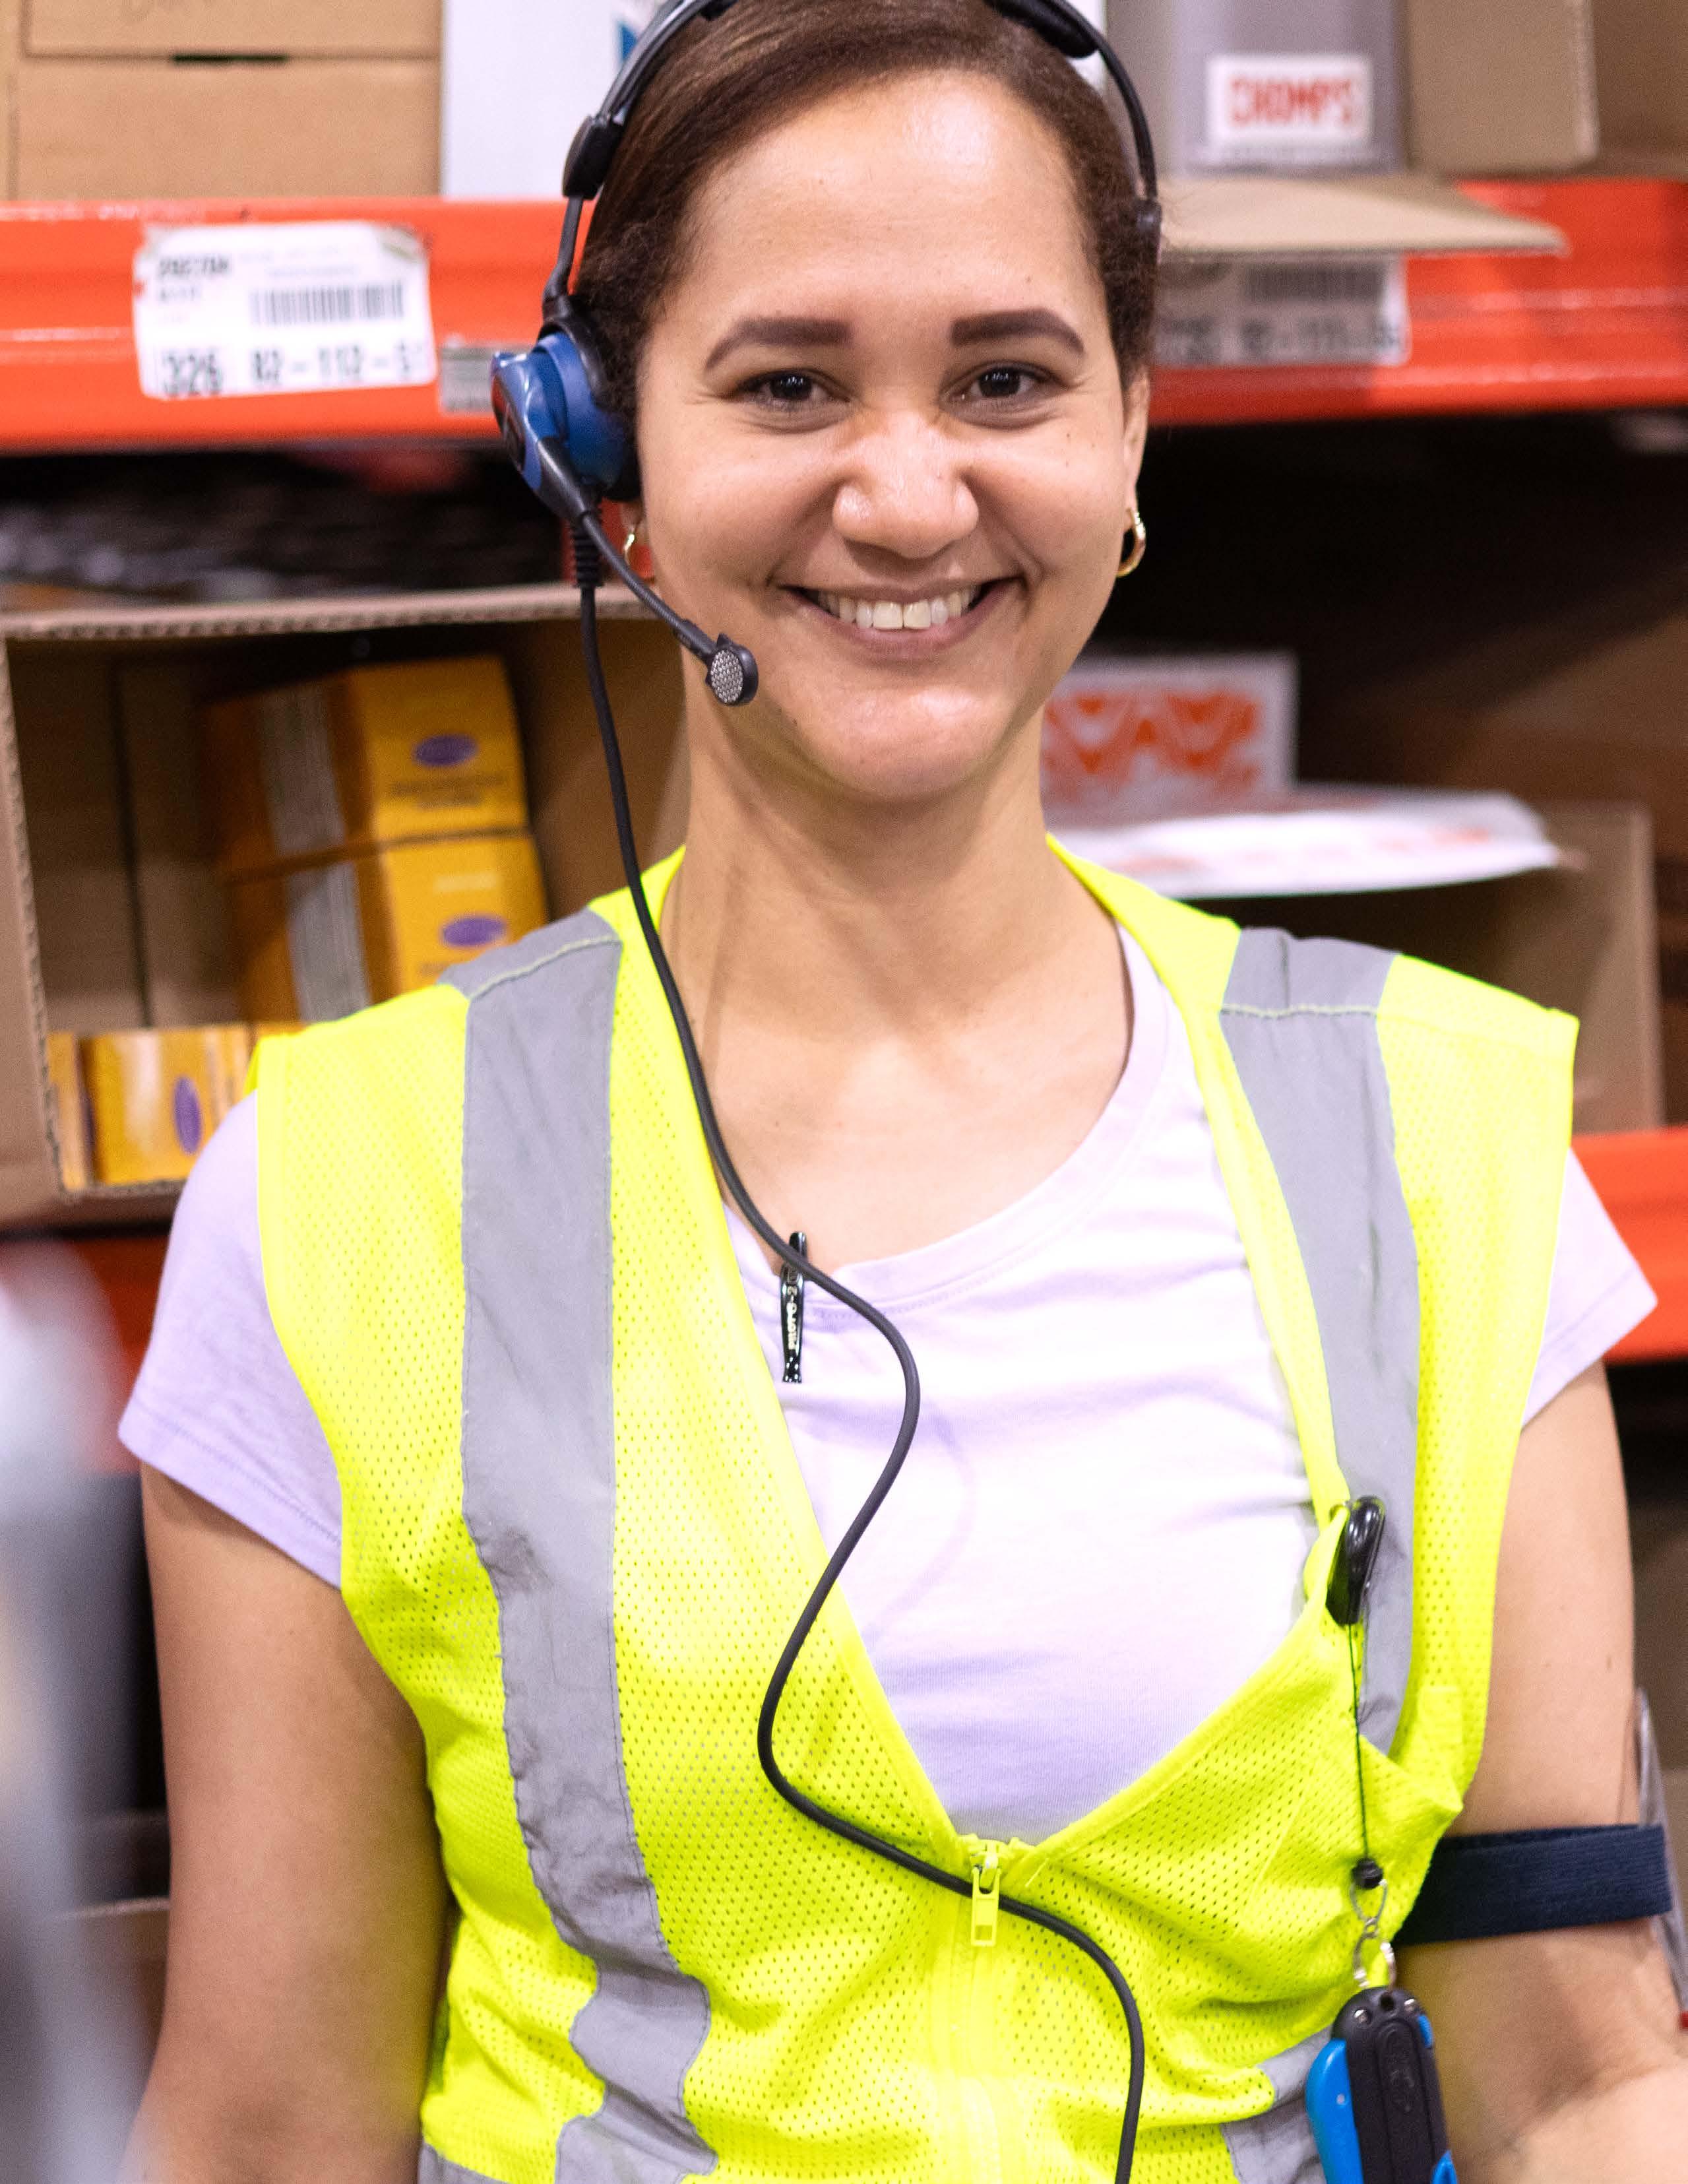
~ 25,600 full-time and part-time associates
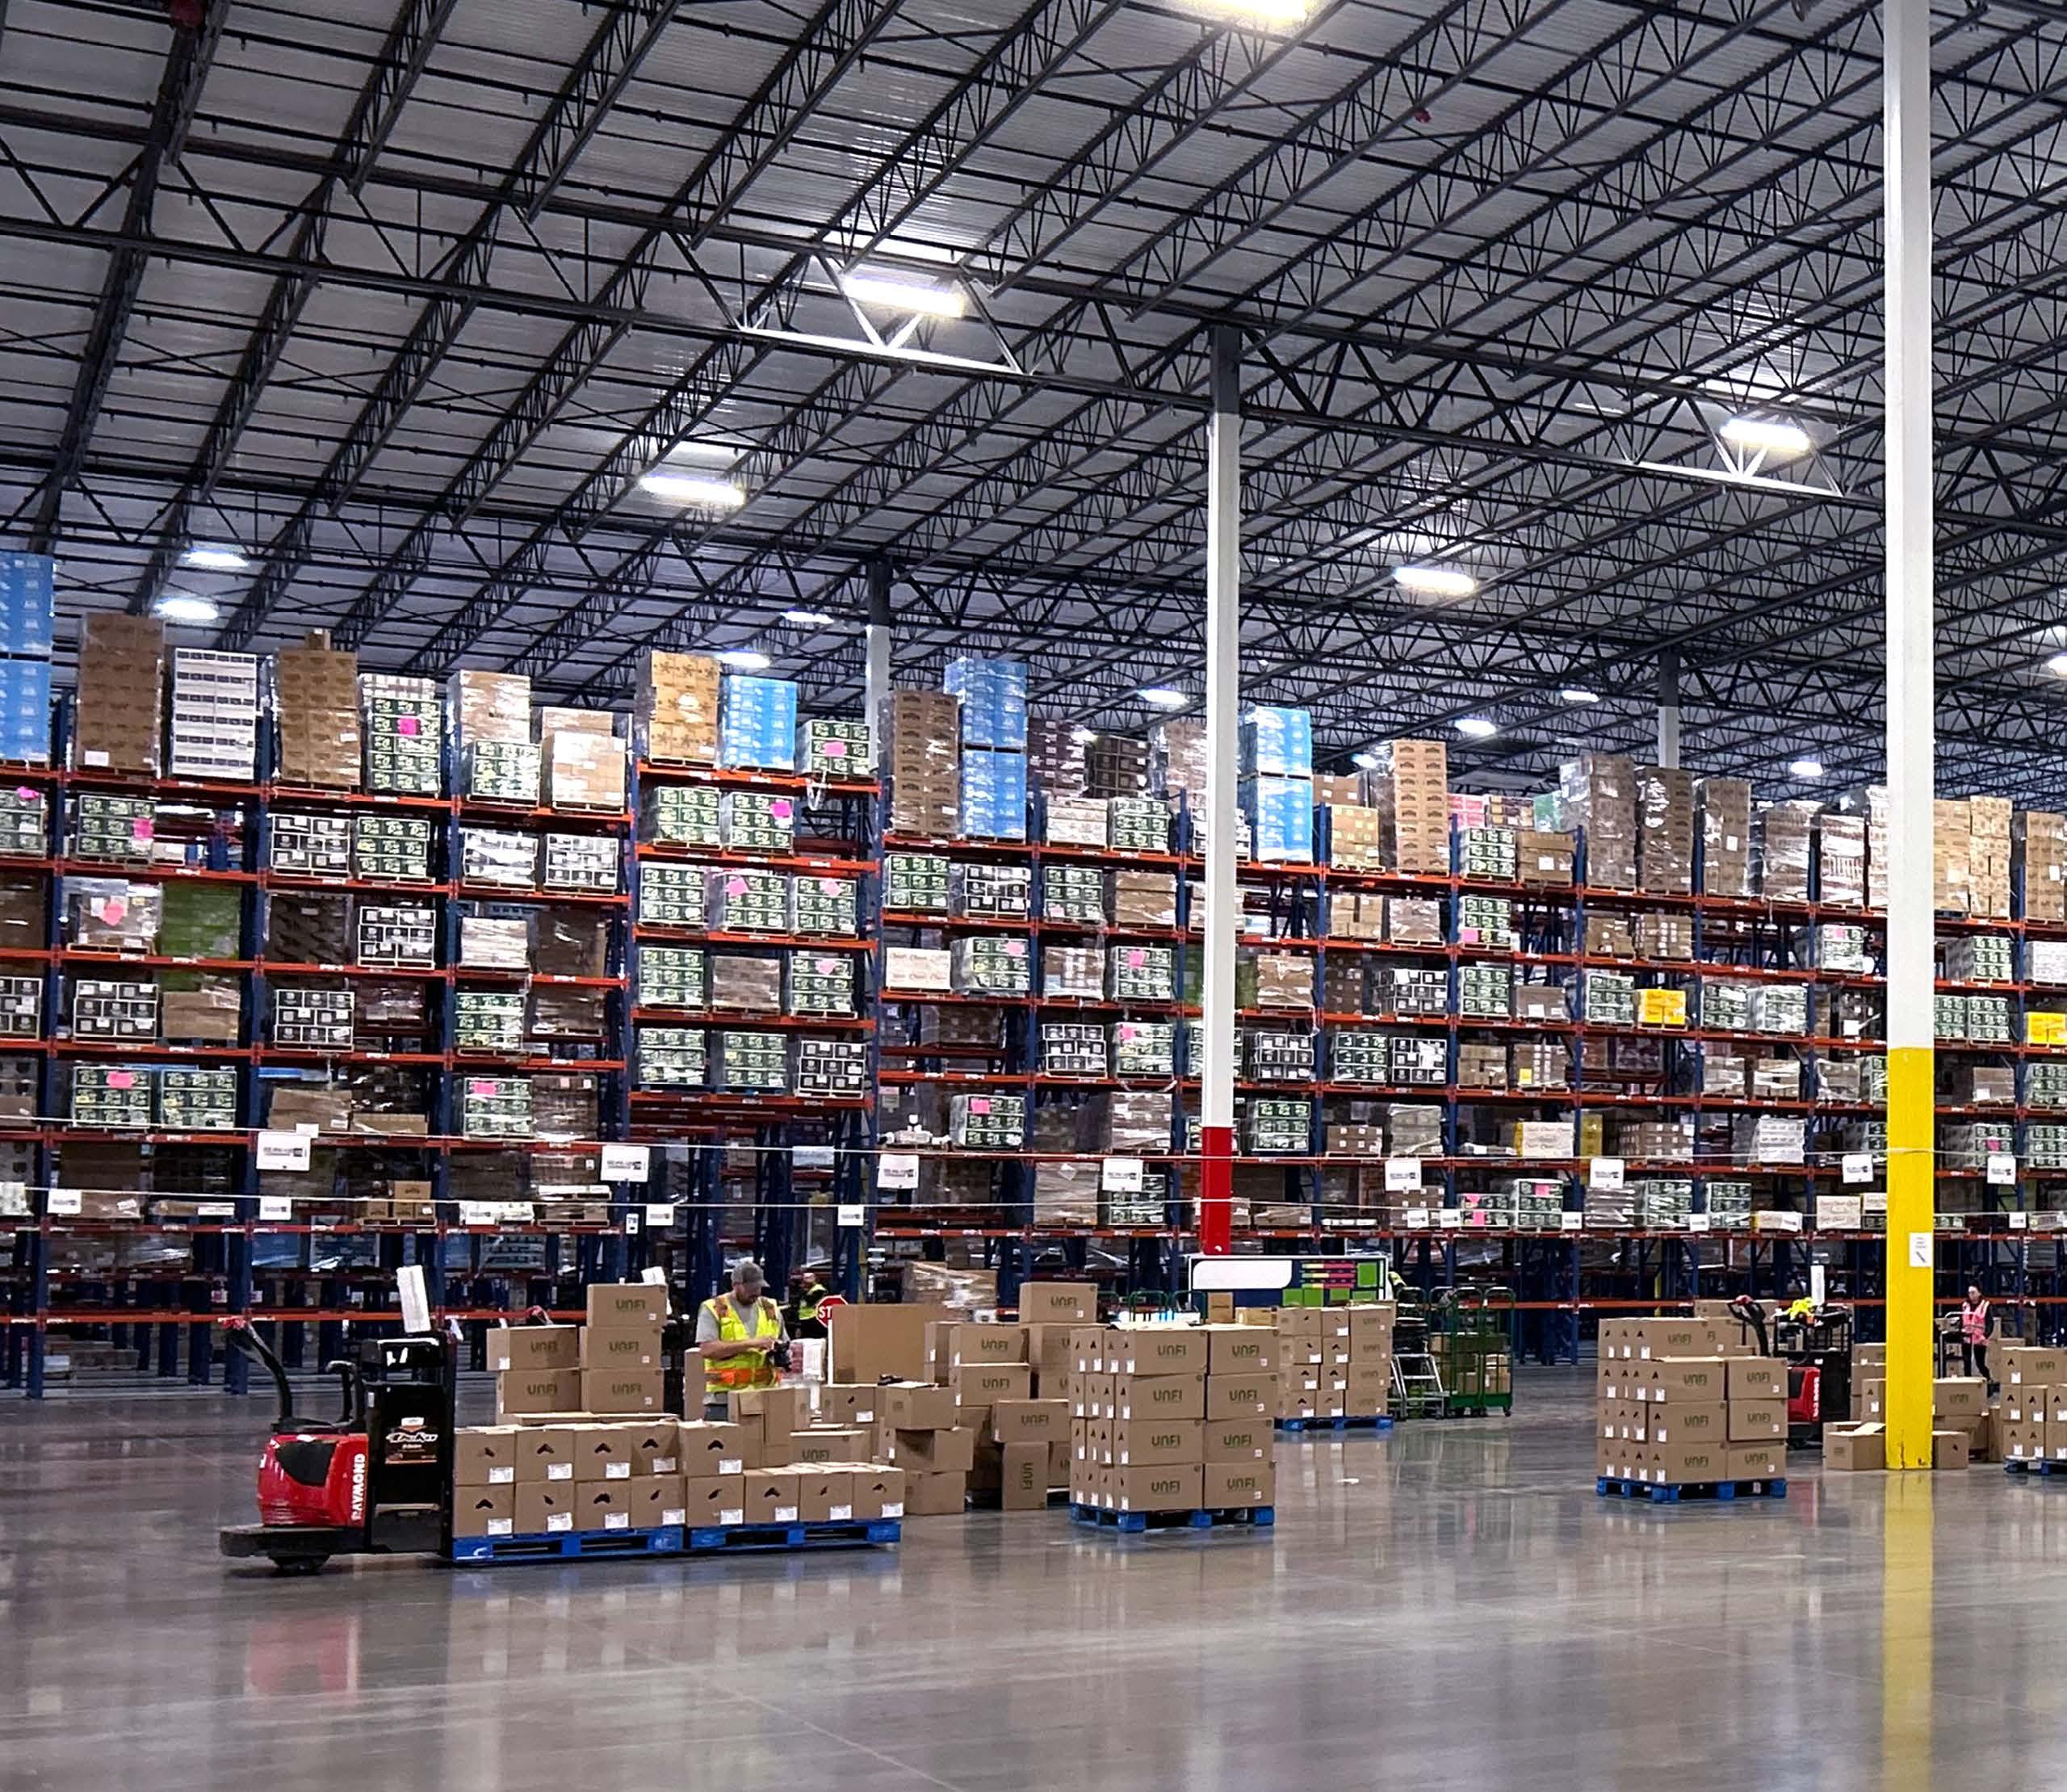
54% of associates work in UNFI distribution centers
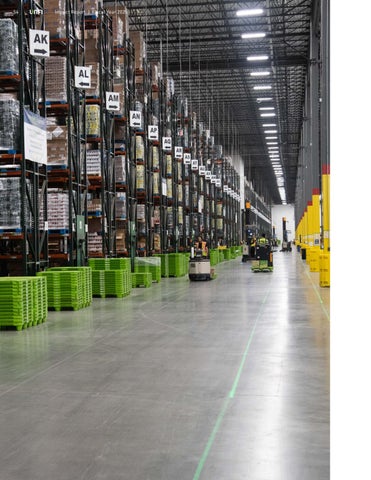
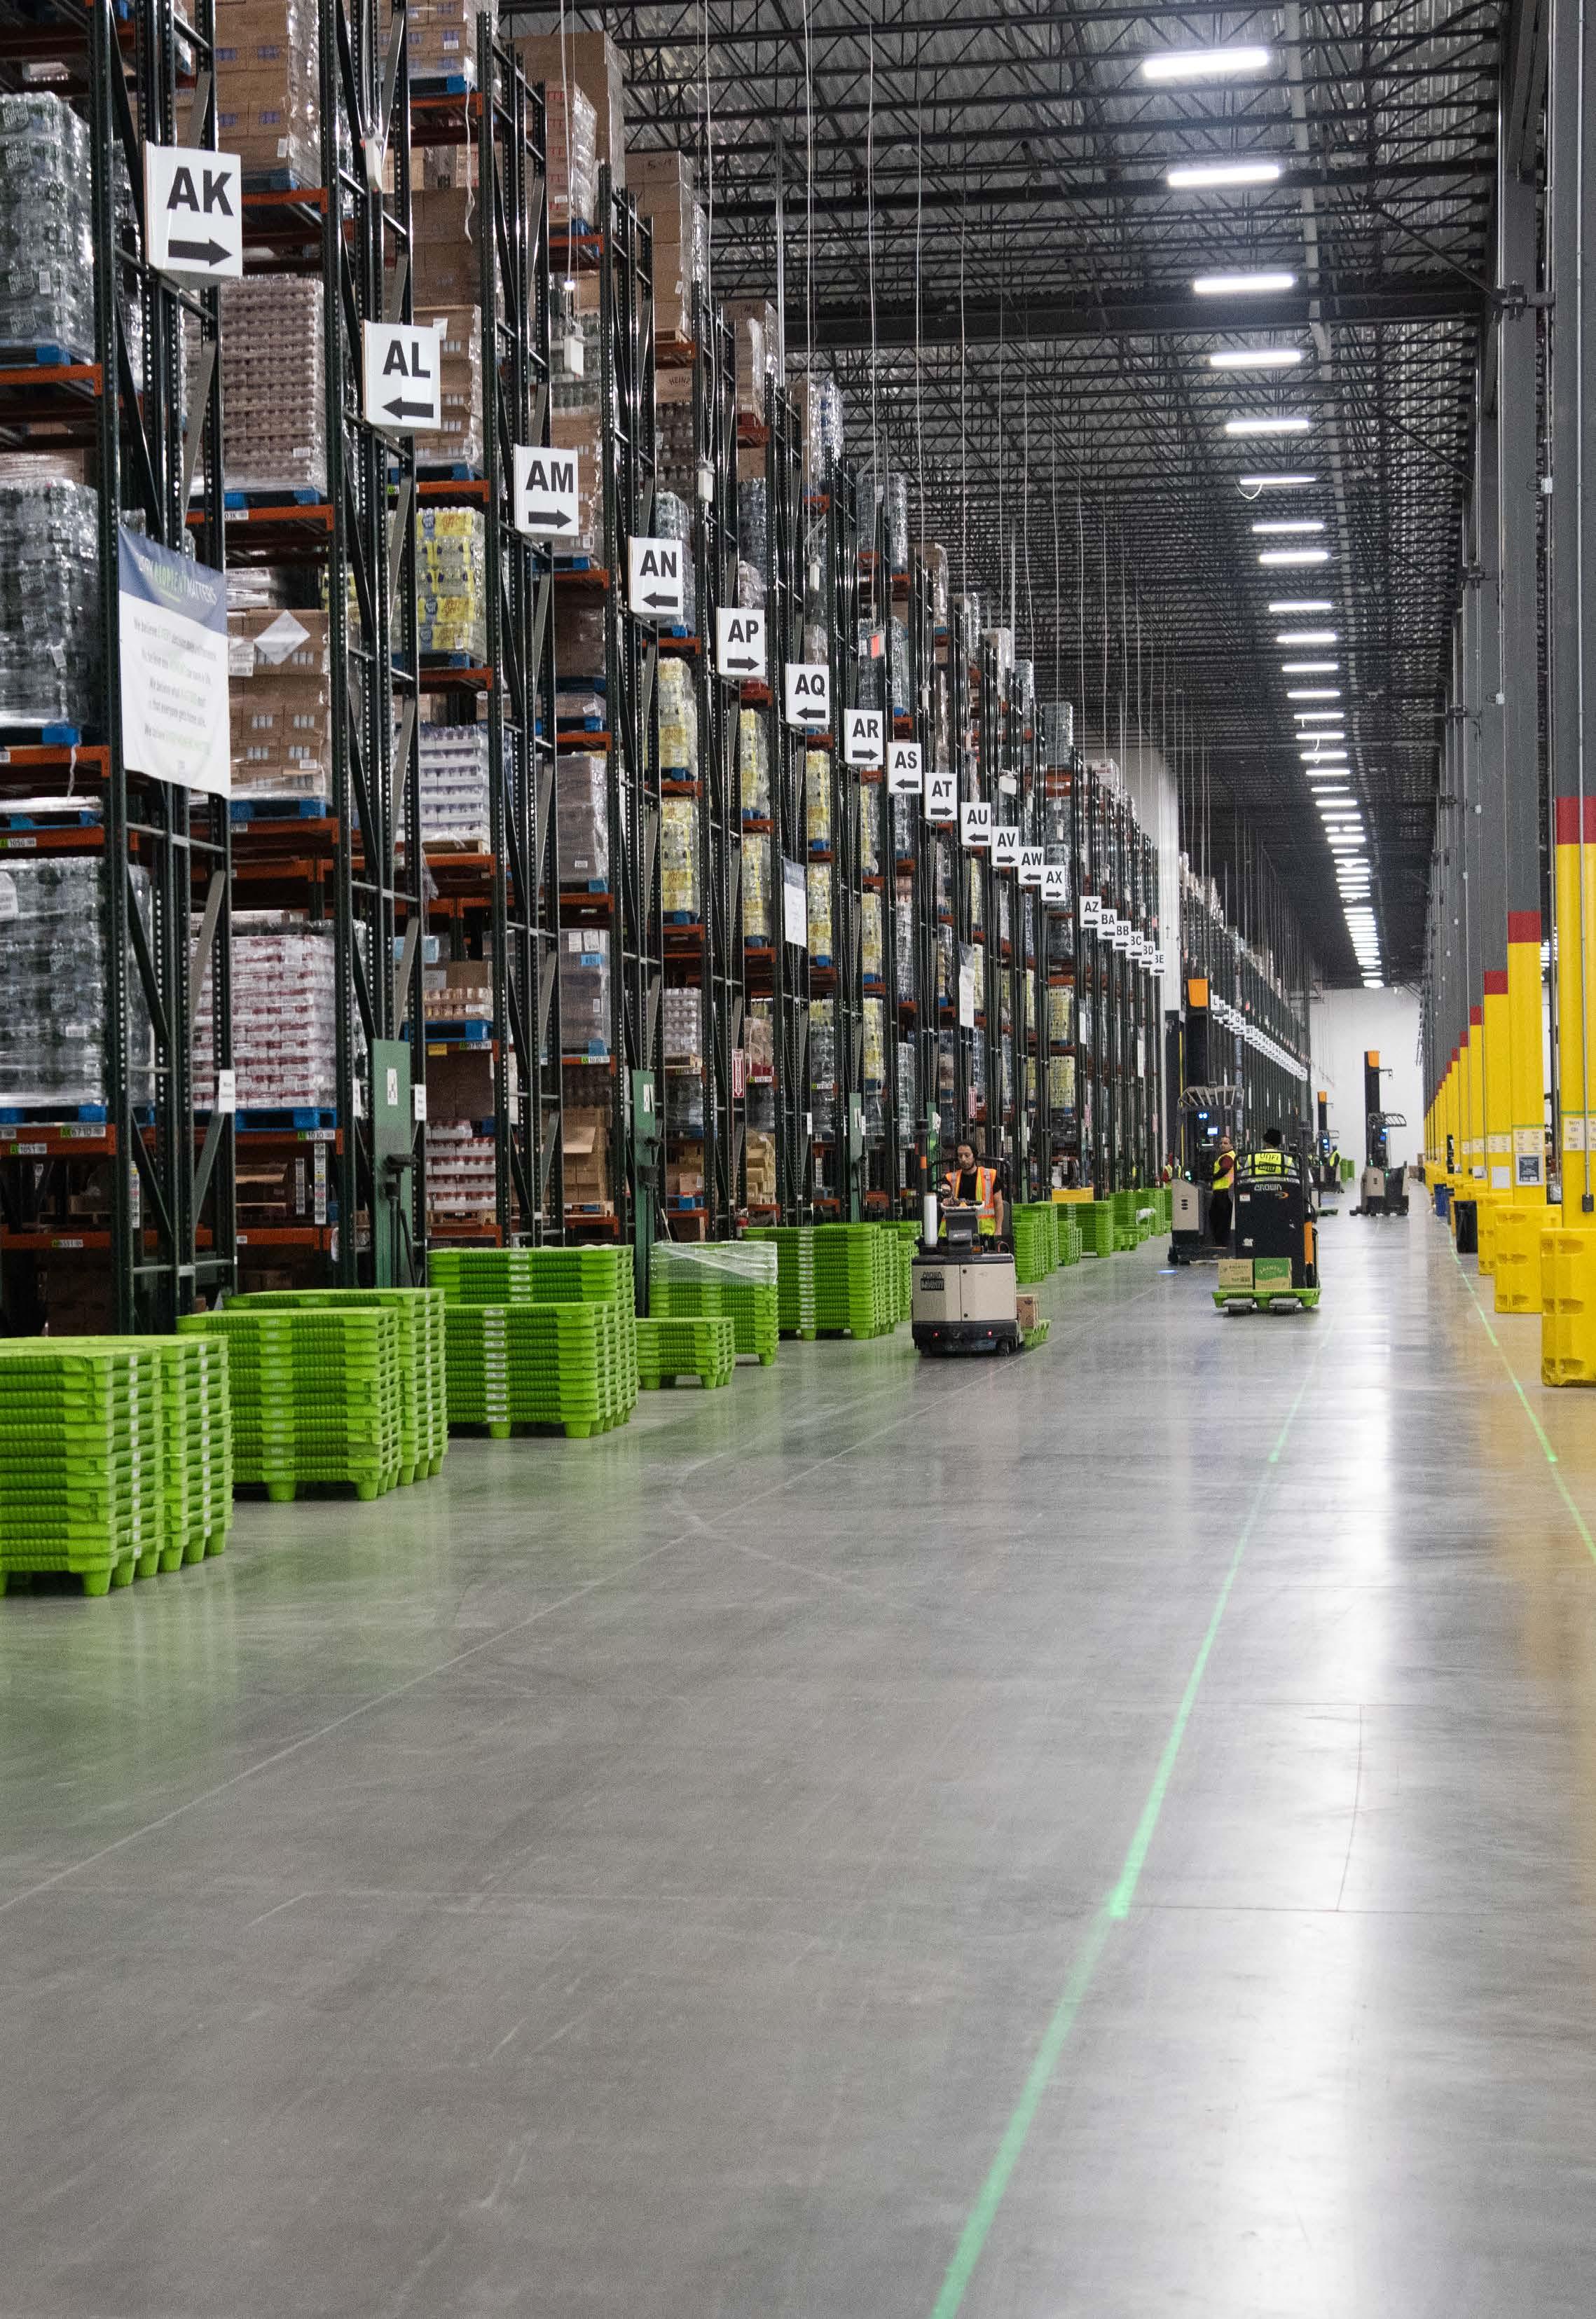
52 distribution centers
~ 1.7M delivery stops
~ 7.5M cases planned for delivery
101 retail locations1
Over 30,000 unique customer locations
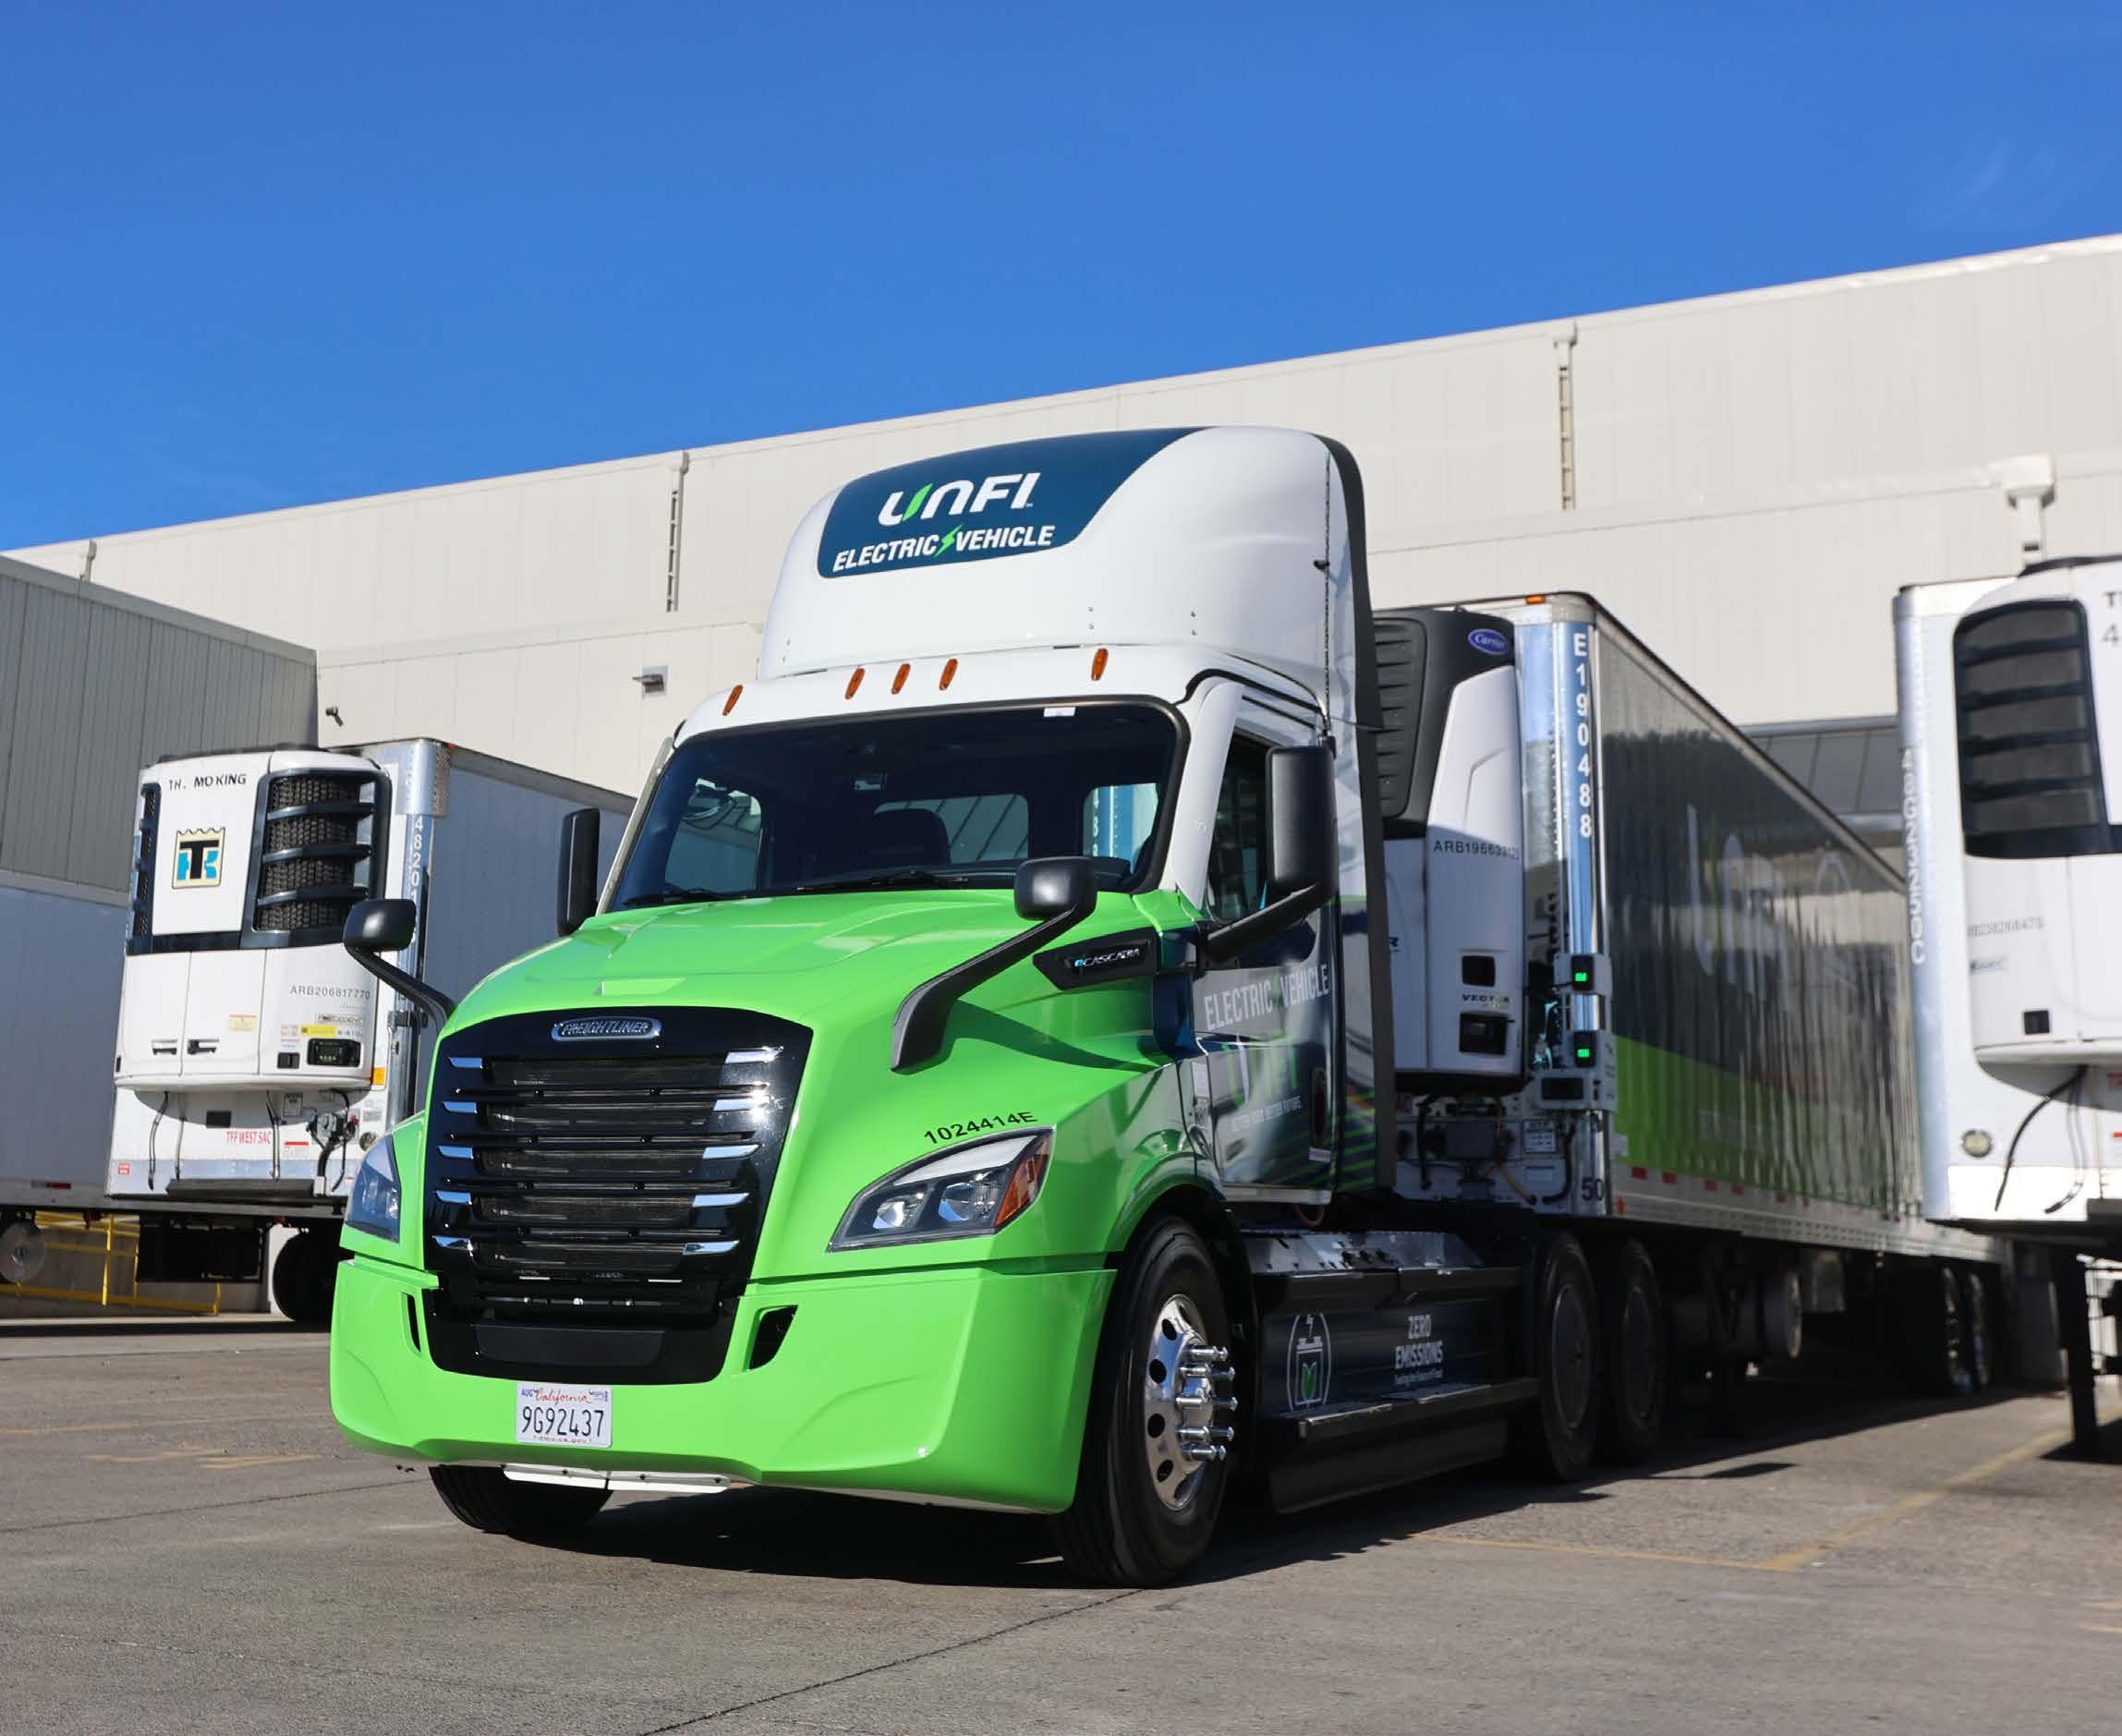
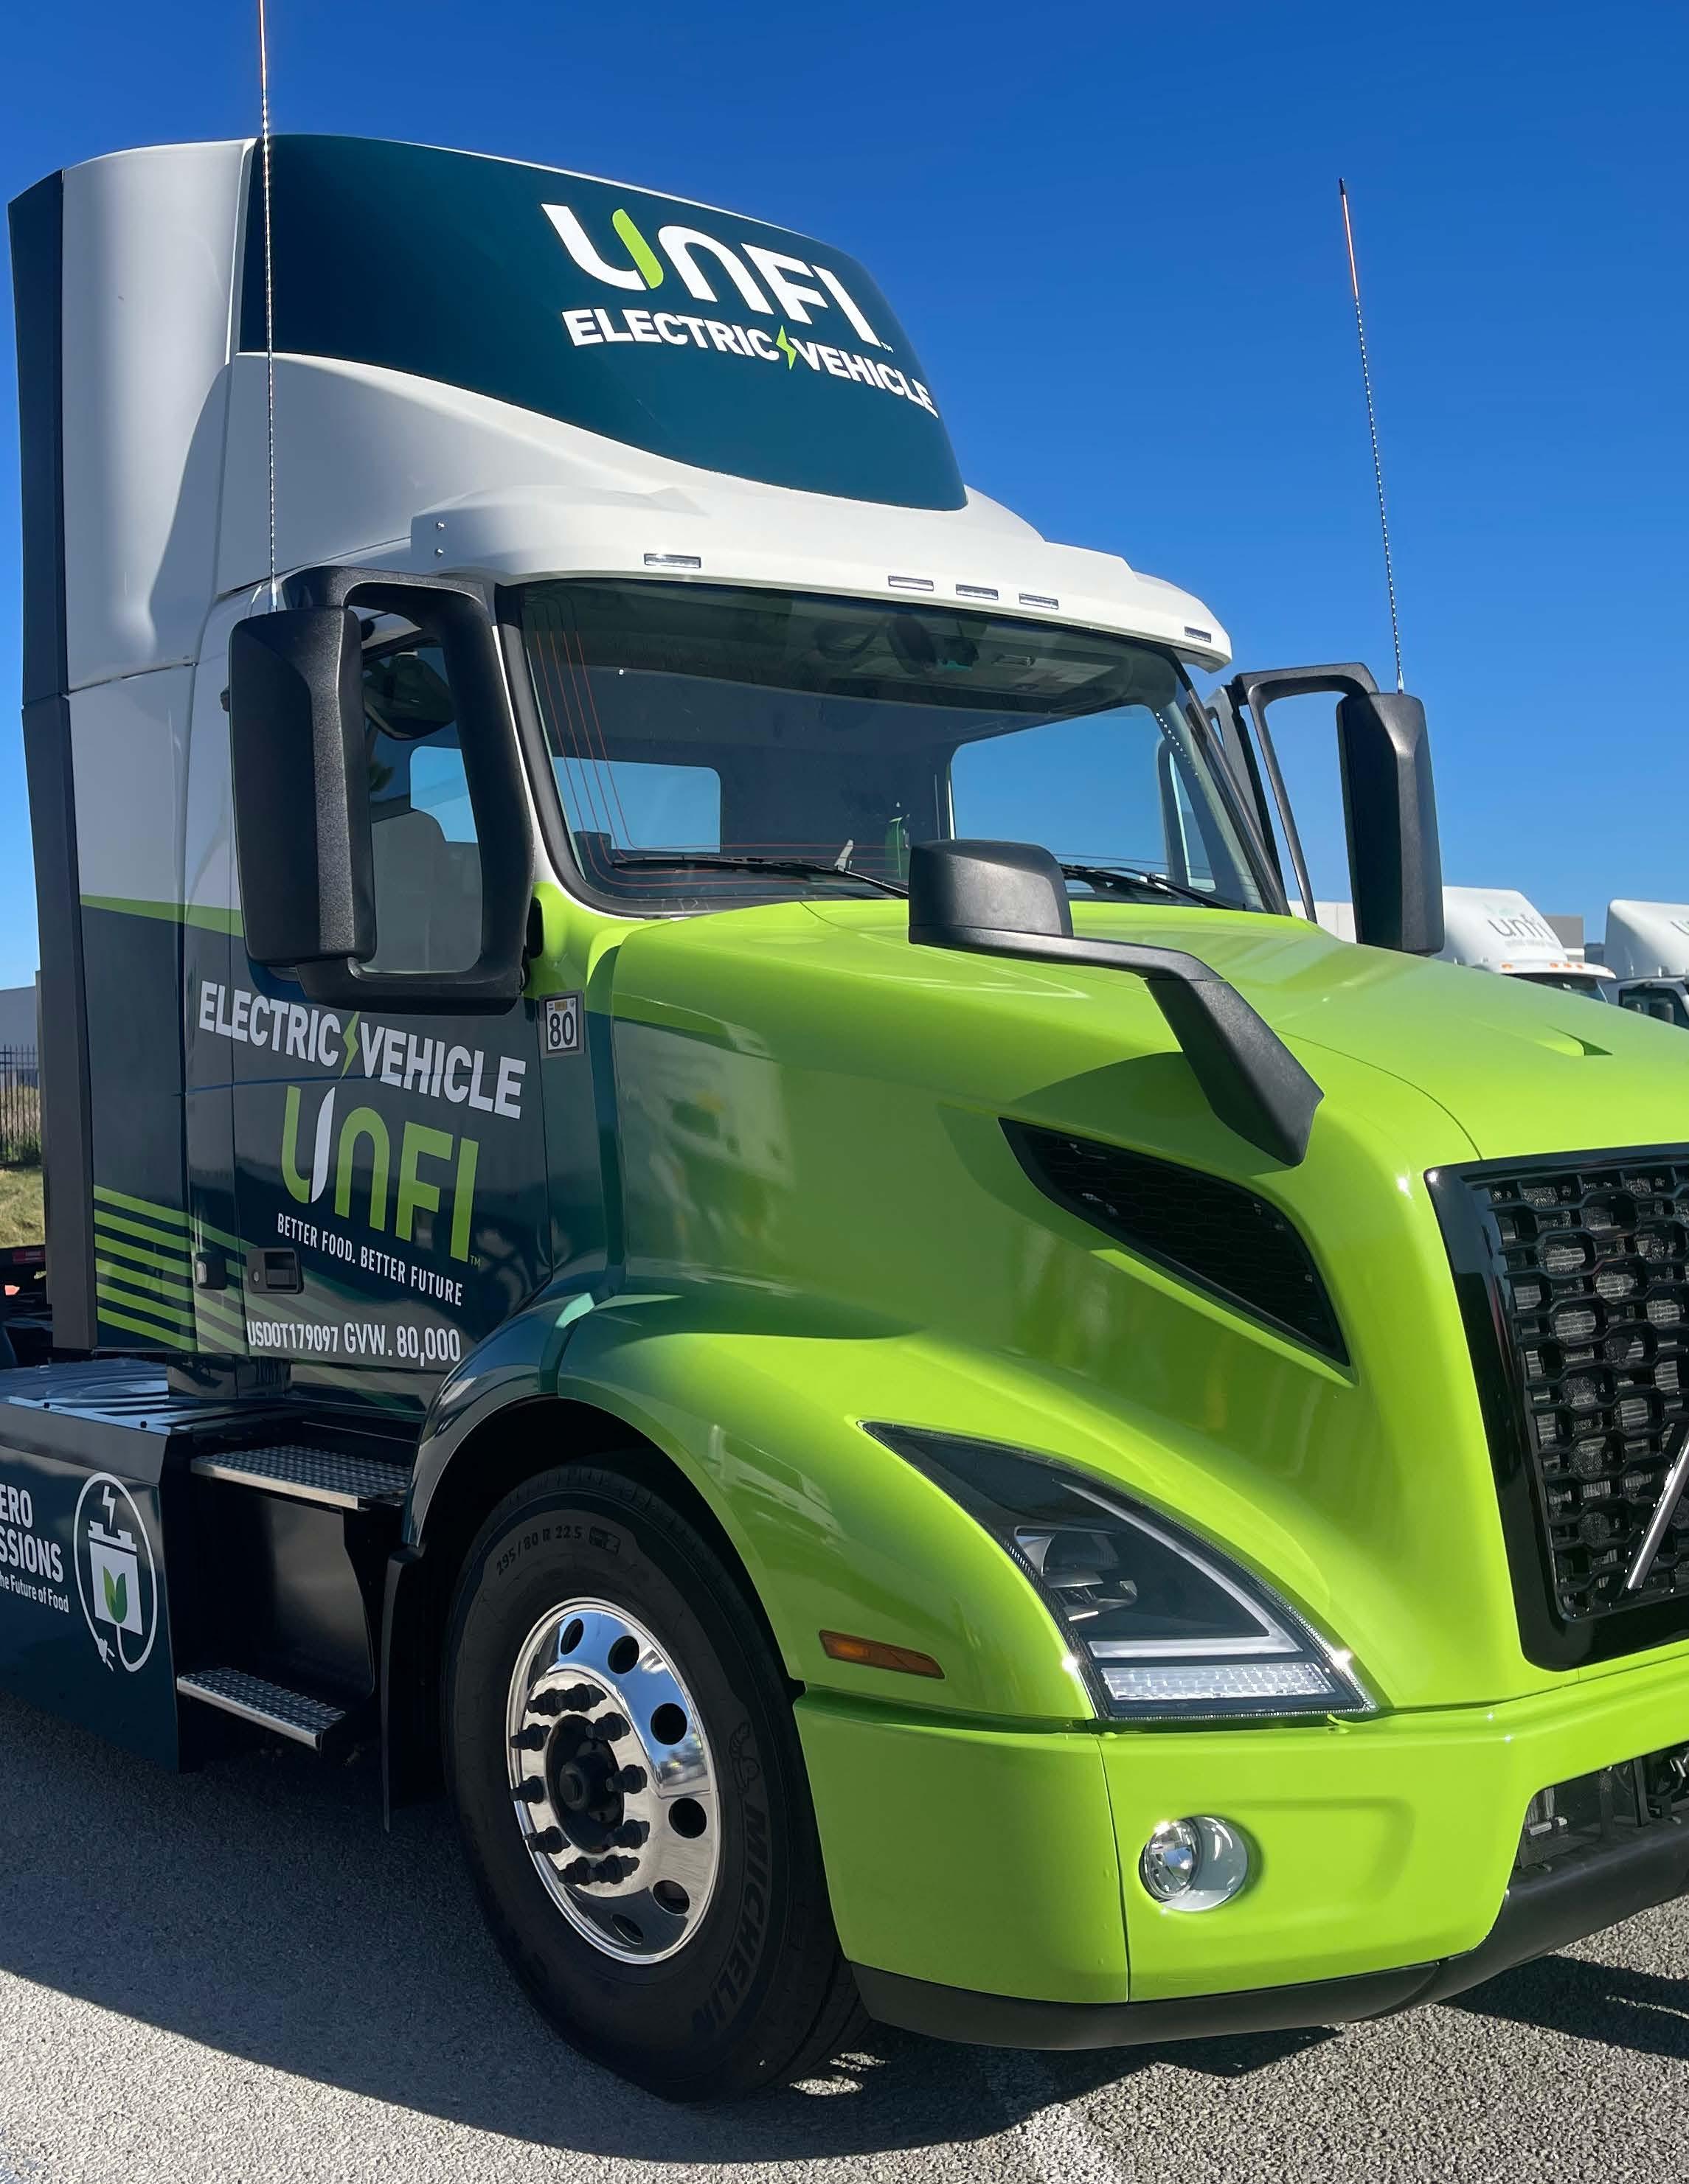
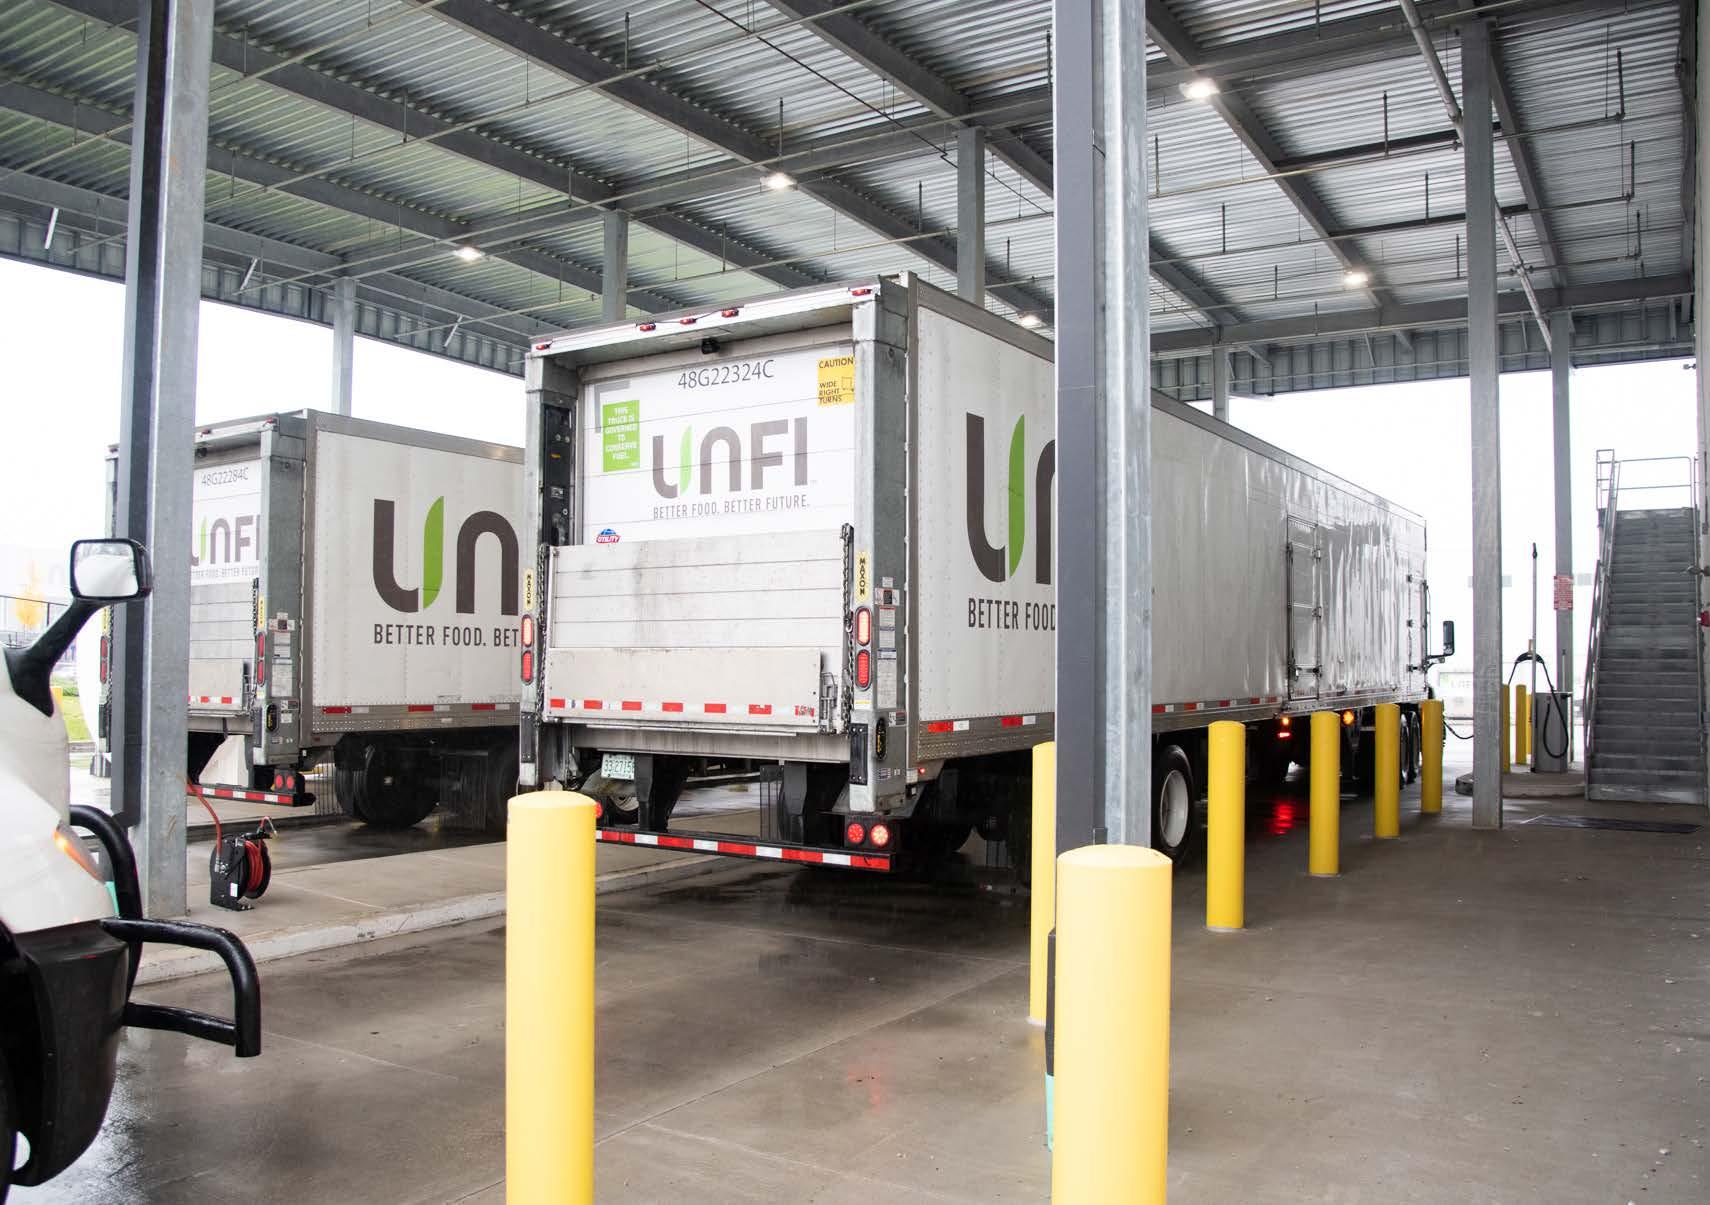
2,119 trucks in UNFI’s U.S.commercial fleet
~ $32B in net sales
Our Values in Action
Better Every Day Highlight
We continuously improve by staying curious, never settling for the status quo, and challenging ourselves to learn every day. By leading with integrity, acting with urgency, and focusing on our shared goals, we drive better results for UNFI and our partners.
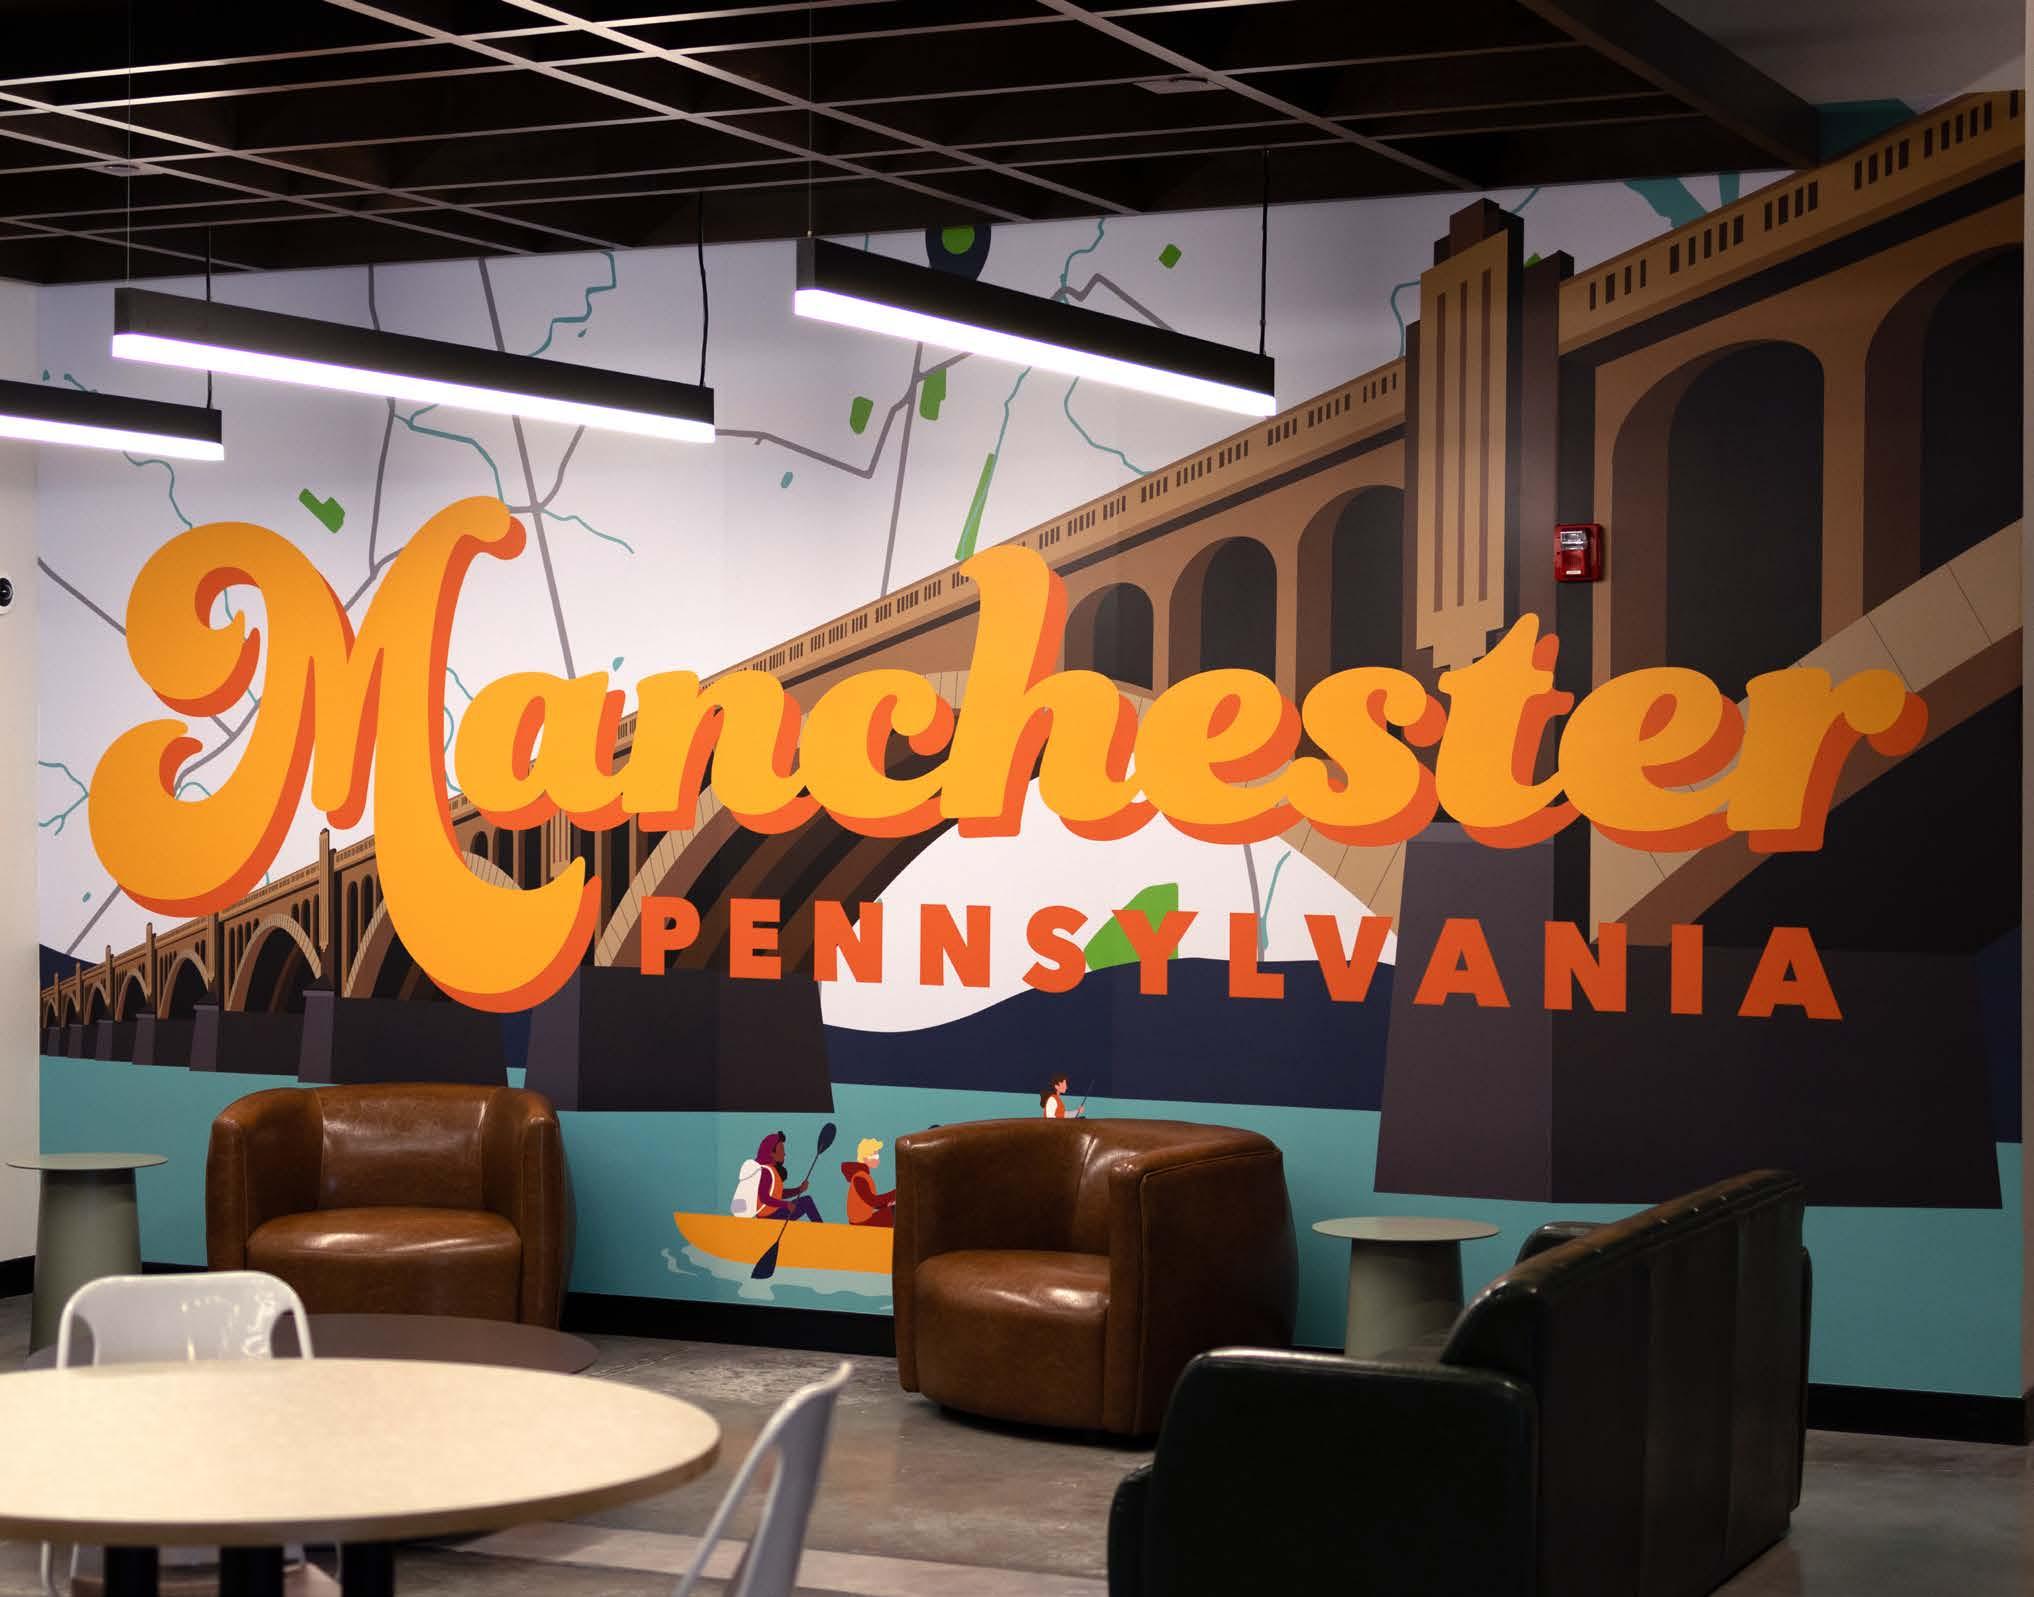
This year, we began delivering natural, organic, and specialty products to customers from our new, state-of-the-art distribution center in Manchester, PA. The new facility integrates cutting-edge automated case-picking technology to improve operational efficiency.
Do the Right Thing Highlight
We choose what’s right over what’s comfortable, prioritizing the safety, security, and well-being of our associates, partners, and communities in every decision we make. By communicating with candor and transparency, we all play a part in building a culture of trust.
Win Together
We work as one UNFI team, striving for operational excellence, holding each other accountable to our commitments, and delivering on our promises. By embracing different perspectives and collaborating inclusively, we create innovative solutions and shared value with our partners.
This spring, 4,700 individuals within the Spirit Lake Nation tribal community in North Dakota were left without clean drinking water due to a contaminated water supply. UNFI’s Inventory Control Team at our DC in Racine, WI partnered with Feeding America to deliver a truckload of water to this community, providing them with clean drinking water in a time of need.
Highlight
Through the collaborative efforts of our legal, government affairs, safety, and operations teams, we have made considerable progress towards our goal of building a world class food safety program. This year, we reached 100% Safe Quality Food (SQF) certification across all our eligible distribution centers —a network-wide achievement for UNFI.
Better for All Impact Goals Progress on Our
Resilient Supply Chains
ACHIEVED
Promote soil health through regenerative and organic practices on one million acres by 2030.
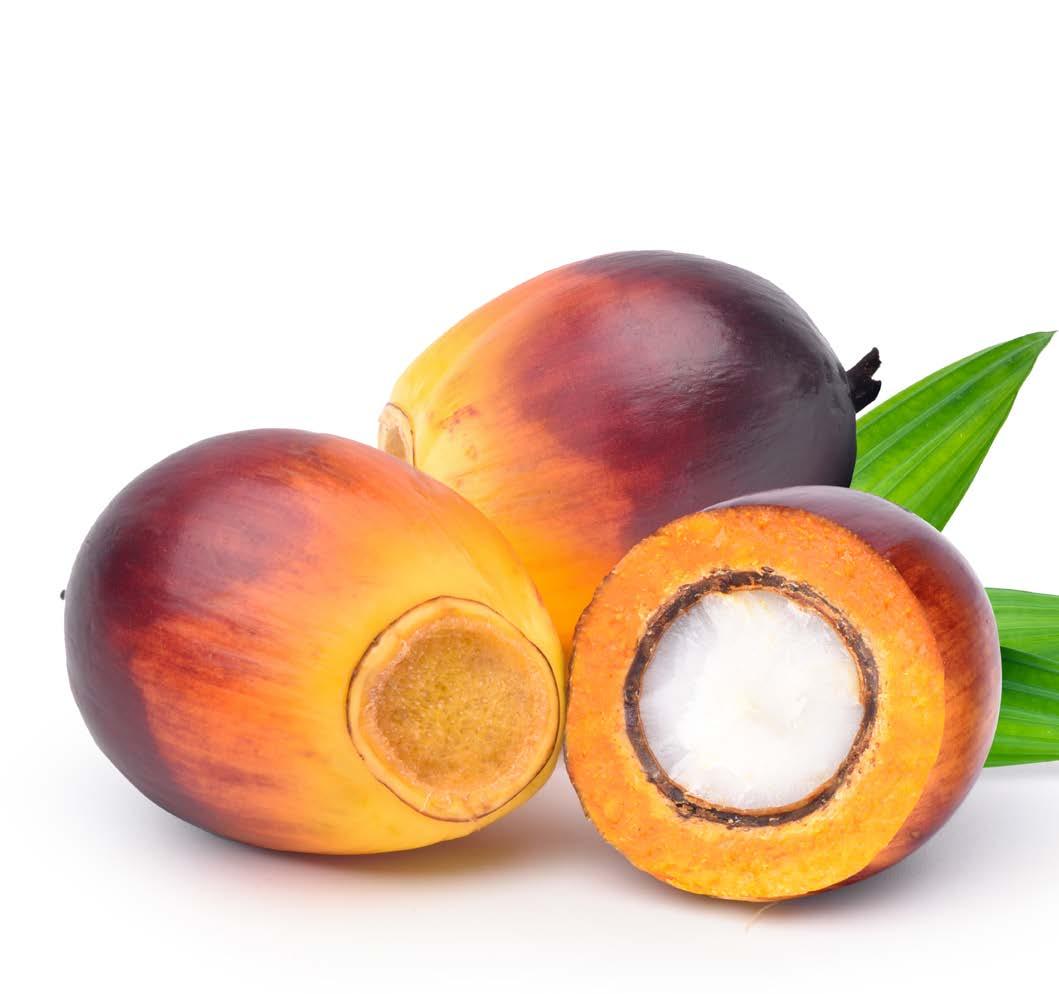
Achieve 100% RSPO-certified palm oil for all UNFI-owned brands products containing palm oil by the end of 2027.
Reduce absolute Scope 3 GHG emissions from purchased goods and services by 25% by 2030.
Thriving Associates
BEHIND
Log 200,000 associate volunteer hours by 2030.
Efficient & Sustainable Operations
Reduce Scope 1 and 3 heavy freight well-to-wheel GHG emissions from transportation by 38% per tonne-kilometer by the end of Fiscal Year 2030. BEHIND
Achieve zero waste to landfills from distribution centers by 2030. AHEAD OF SCHEDULE ON TRACK
Reduce absolute Scope 1 and 2 GHG emissions from all other emission sources by 50% by the end of Fiscal Year 2030.
ACHIEVED
DISCONTINUED
AHEAD OF SCHEDULE
Achieve SQF certification at all eligible distribution centers by Fiscal Year 2025.
Strive for “Green” Ecolab Retail audit rating at all of our retail stores.
Donate 250 million pounds of food (equivalent to approximately 208 million meals) by 2030.
Highlights From Fiscal Year 2025
Grew supplier membership in UNFI’s Climate Action Partnership
Engaged policymakers on topics critical to our industry, such as food safety, fleet electrification, and federal nutrition assistance programs
Reduced absolute Scope 1 and 2 operational greenhouse gas emissions by 47% since our Fiscal Year 2020 baseline
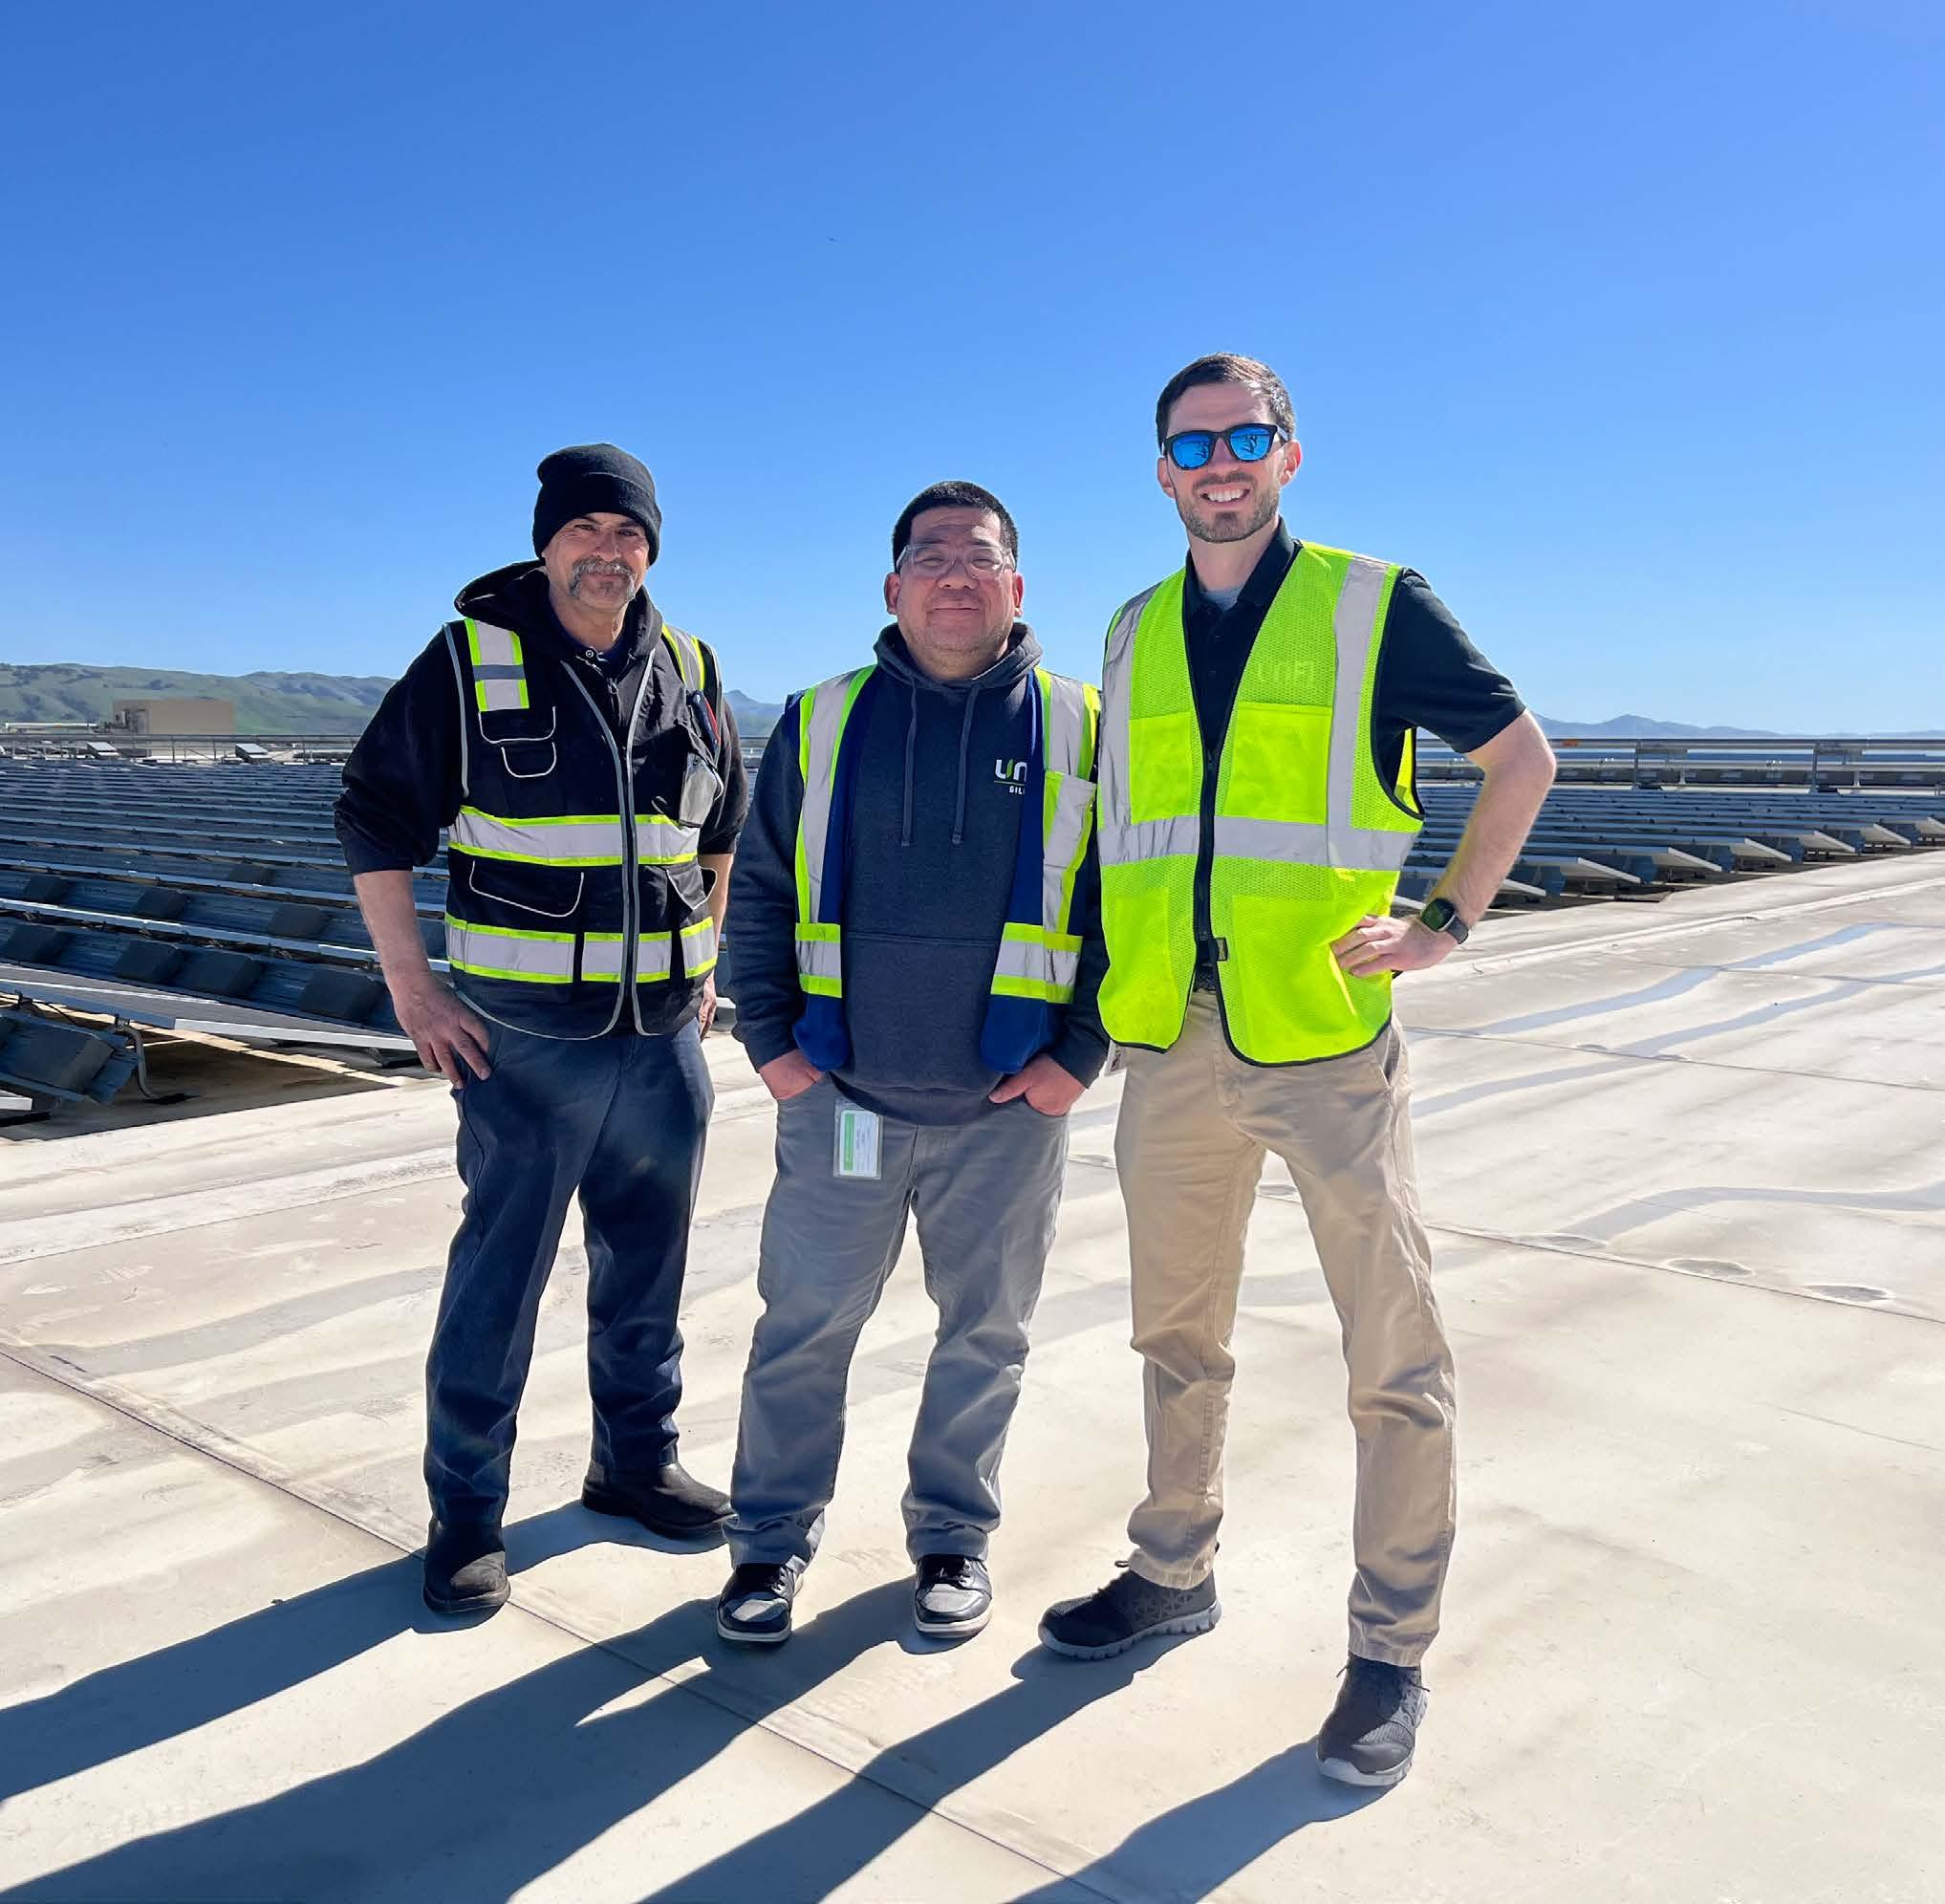
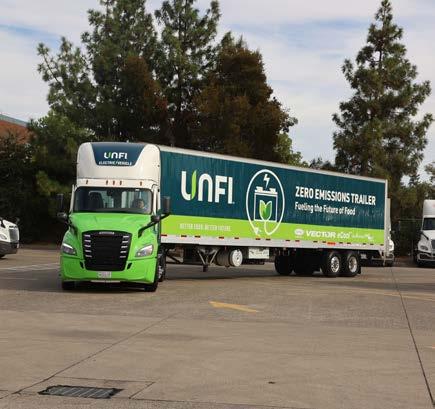
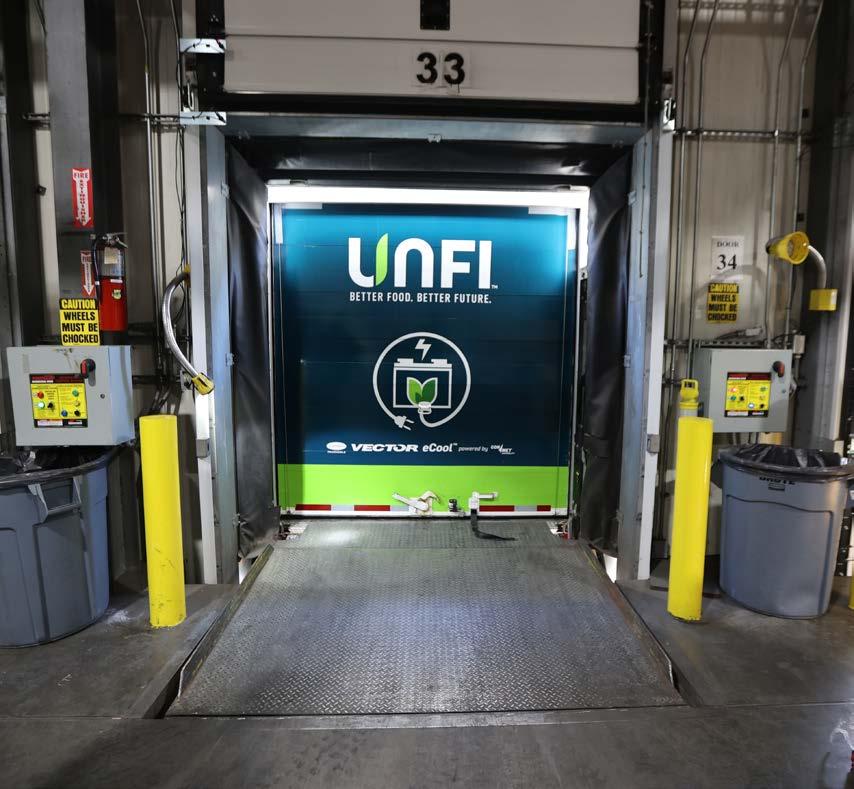
Launched a multiyear project to support a largely electrified transportation fleet, including a rooftop solar array with battery storage, at our Gilroy DC
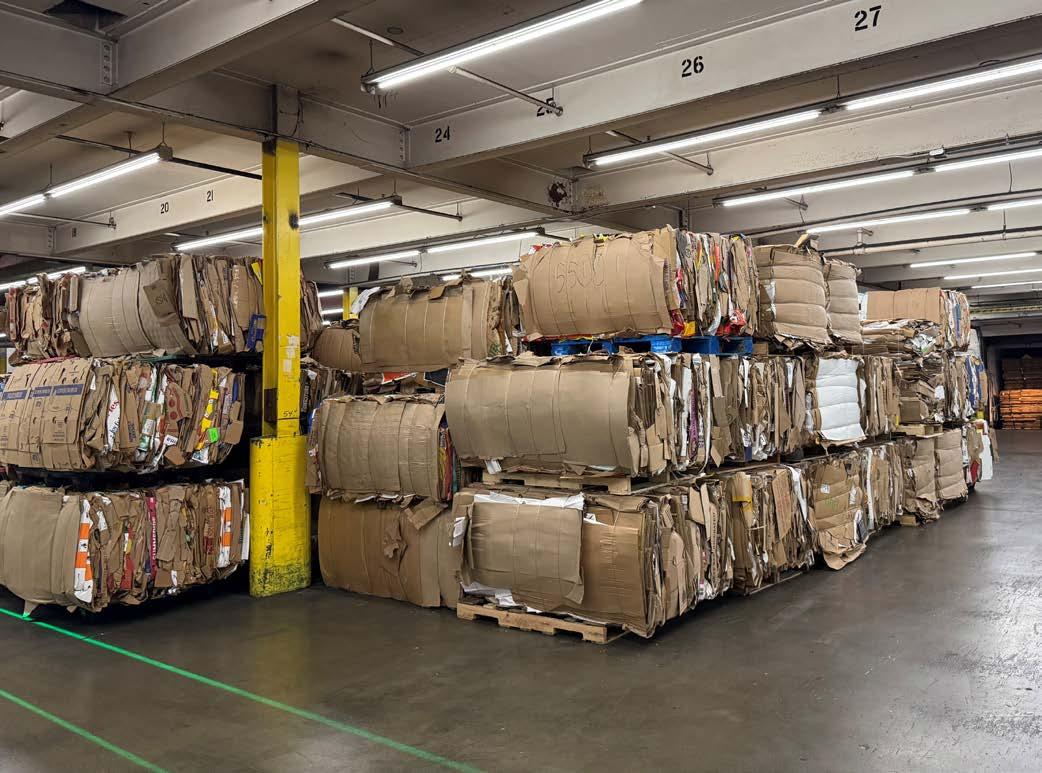
Diverted 85% of waste from DCs away from landfills
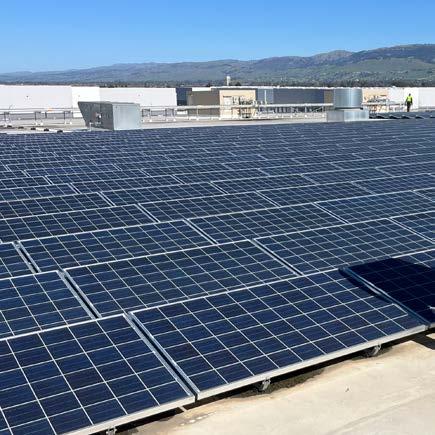
Completed construction on our largest solar array to date at our Riverside DC
Hosted an inaugural Climate Summit, enabling progress toward shared climate goals and adding differentiated value for our partners
Grew membership in our Belonging & Innovation Groups to over 3,000 associates
Awarded over $1.8 million in funding to support community nonprofit organizations that are increasing access to quality food through the UNFI Foundation, our 501(c)(3) nonprofit
Photo courtesy of: Mileston Cooperative
Awards & Recognition
FMI—The Food Industry Association Community Uplift Award:
UNFI was recognized for our efforts to strengthen food recovery and food donations nationwide through our impact strategy and UNFI Foundation grants
Progressive Grocer Impact Award:
The UNFI Foundation was honored for its innovative giving strategy that combines grantmaking programs with investments in regenerative and organic agriculture
Our Approach to Governance
At UNFI, responsible business practices guide how we operate and measure success, while our company values serve as the foundation for how we create shared value for all our stakeholders. In our decision making, we aim to consider the broader impact to our partners, the communities we serve, and the planet we share.
Corporate Culture & Governance
Our governance structure helps translate our shared purpose into action. The Board of Directors maintains oversight of sustainability and impact matters through its Nominating & Governance Committee, which reviews relevant impact matters regularly.
Our Sustainability Executive Committee, comprised of 11 senior leaders, implement our Better for All impact strategy, while cross-functional associate teams like the Policy Governance Committee, Better for All leads, and the Food Traceability Working Group, provide insights from across our operations.
This year, we also convened key stakeholders from across the company to regularly monitor and prepare for compliance with evolving climate legislation, such as the California climate disclosure rules.
By creating a culture of accountability and curiosity, we aim to embed sustainability across the company—from how we approach risk management to strategic planning—helping us deliver on our purpose, Better Food. Better Future.
Board of Directors
Nominating & Governance Committee
Sustainability Executive Committee
Associate-Led Working Groups
The Ethics and Compliance Toolkit
This year, we rolled out a new toolkit to help people leaders translate our values into daily actions and model ethical behavior, strengthening our governance foundation.
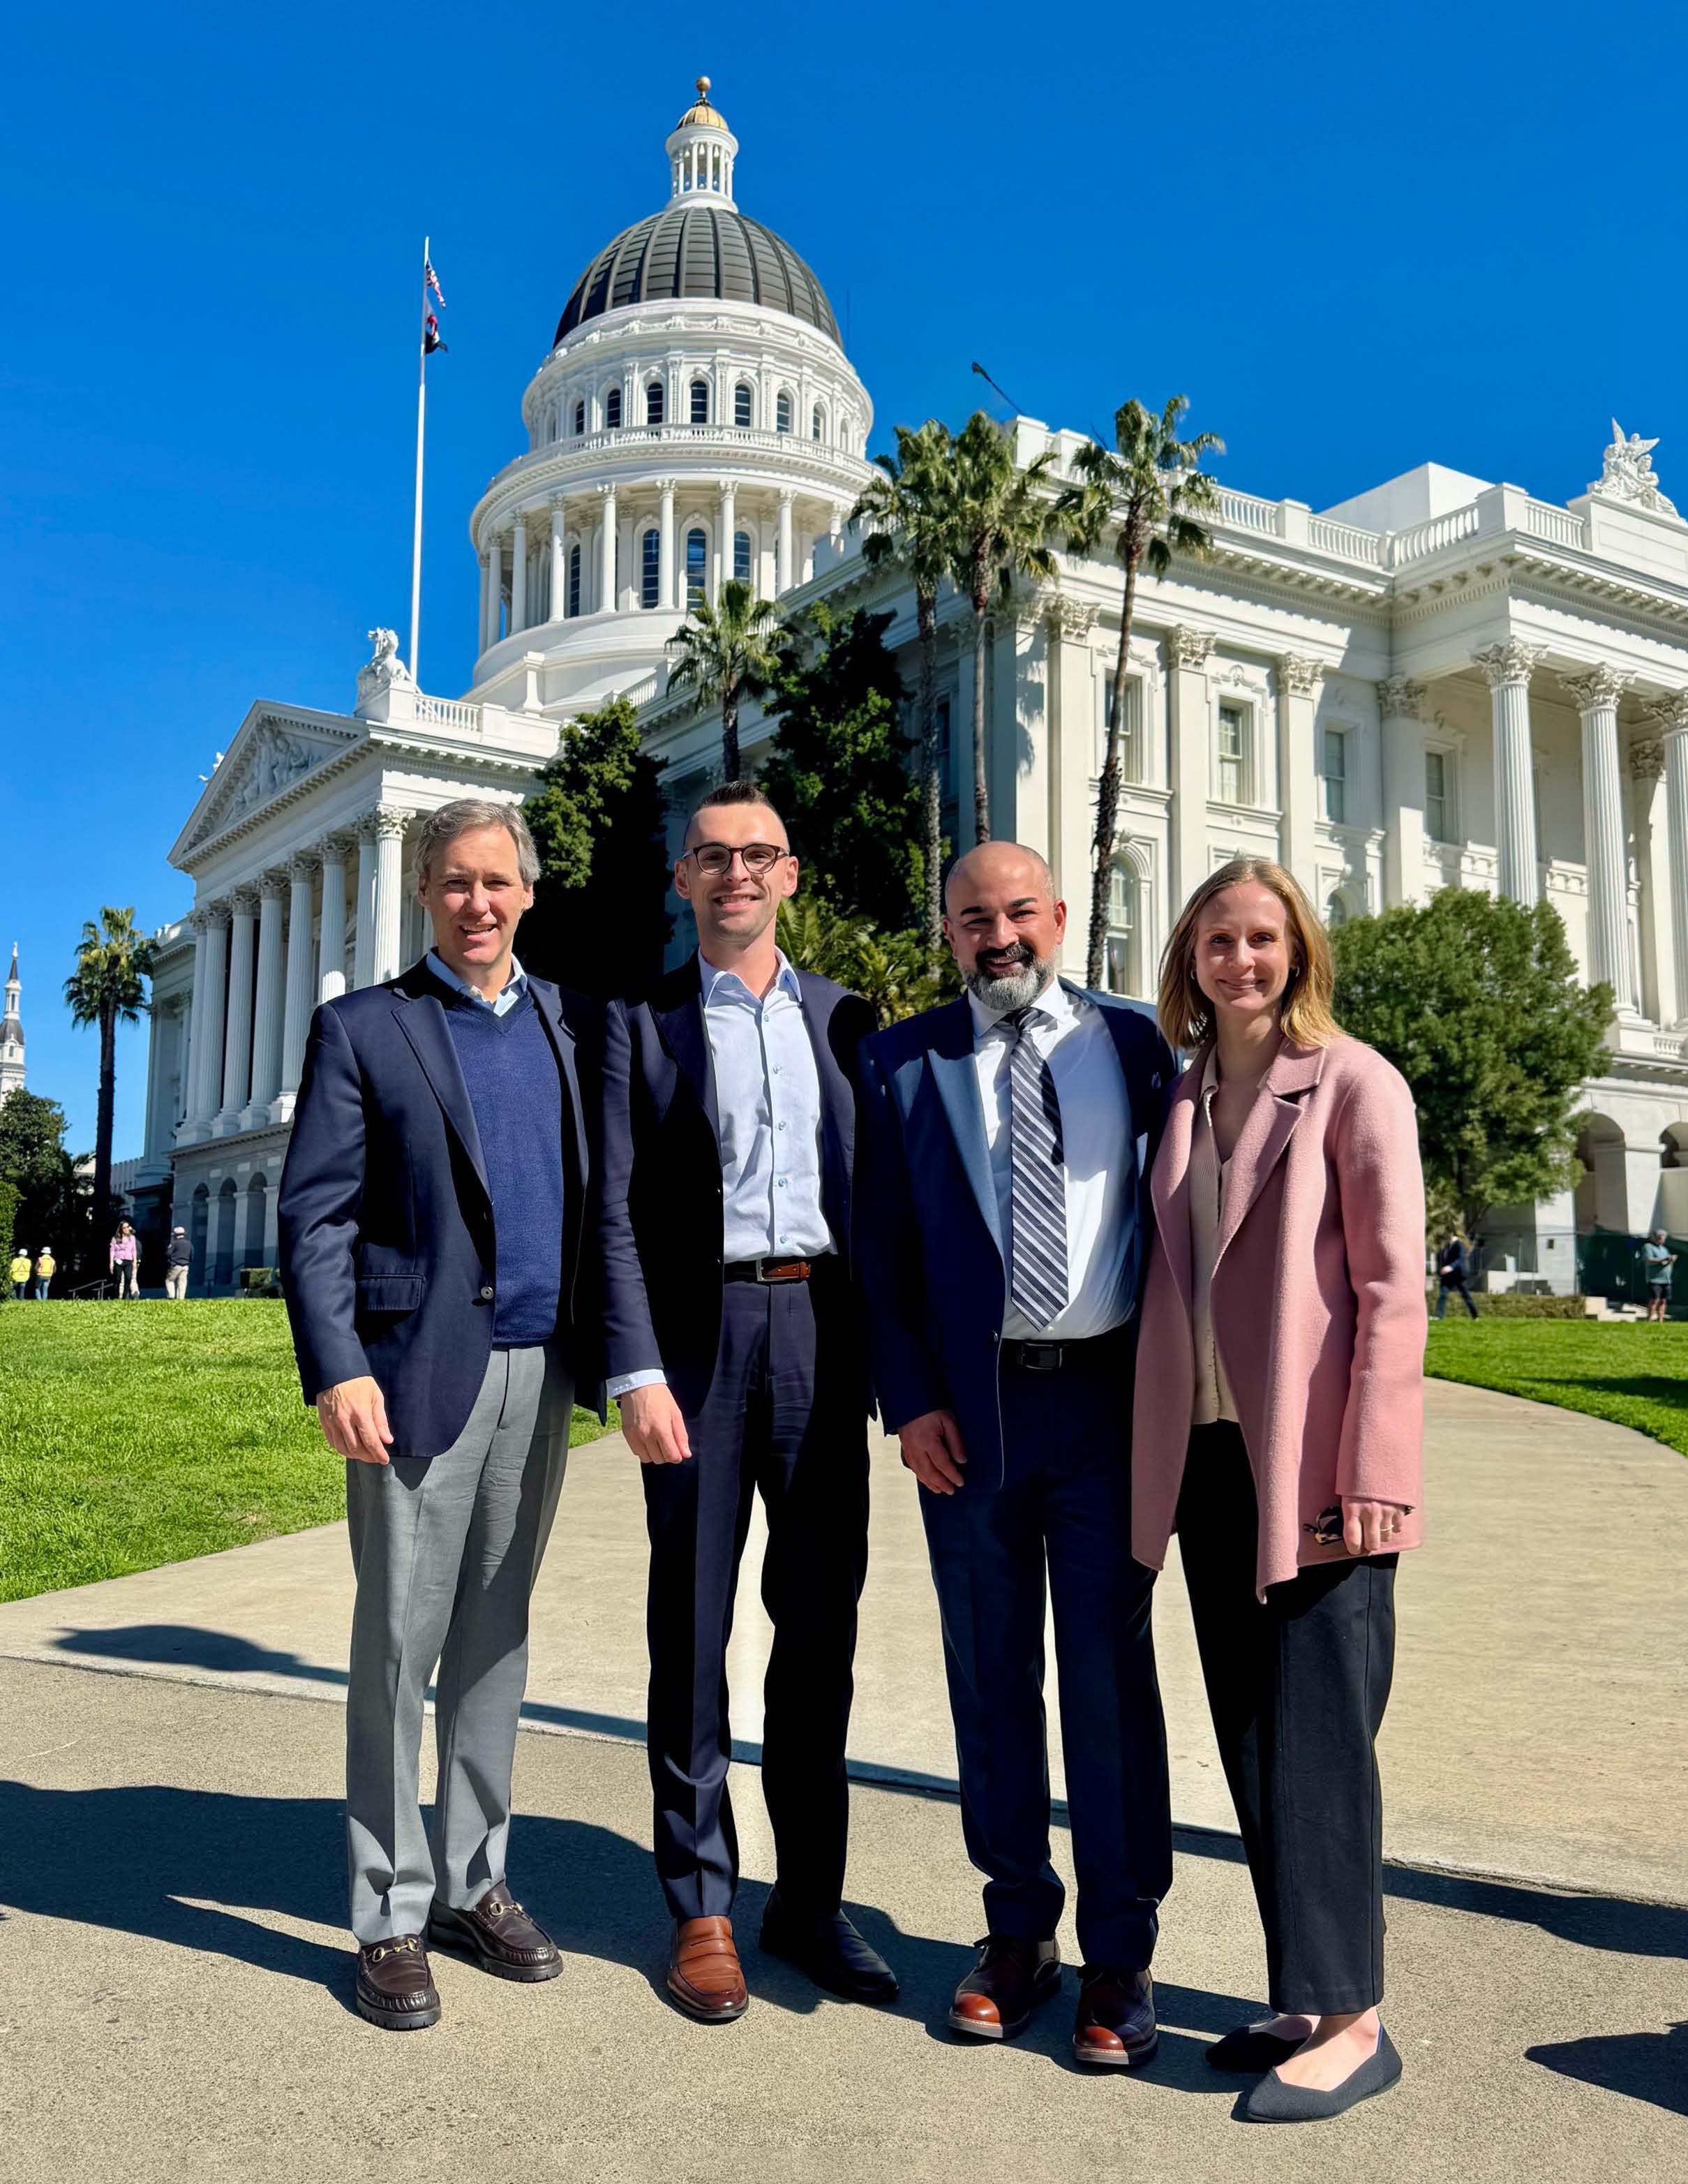
UNFI Team Members meets with state policymakers in Sacramento, CA to discuss the importance of public-private partnerships in decarbonizing our heavy-duty fleet.
Collaborative Leadership and Industry Engagement
We partner with policymakers and industry organizations to advance practical solutions that strengthen the entire food system.
Food Traceability Leadership:
We convened suppliers and customers to navigate the Food and Drug Administration’s (FDA) Food Traceability Rule, creating forums for shared learning to help both retailers and suppliers comply with federal policy efficiently, while building a more transparent food supply chain where food safety is at the forefront.
Direct Legislative Engagement:
We hosted members of Congress for tours of our DCs and our retail Cub stores in Minnesota, discussing the importance of food access, neighborhood grocery stores and pharmacies, food safety, and supply chain operations. These conversations help policymakers understand how regulations impact our ability to expand access to healthy foods, affordable medications, and everyday essential goods.
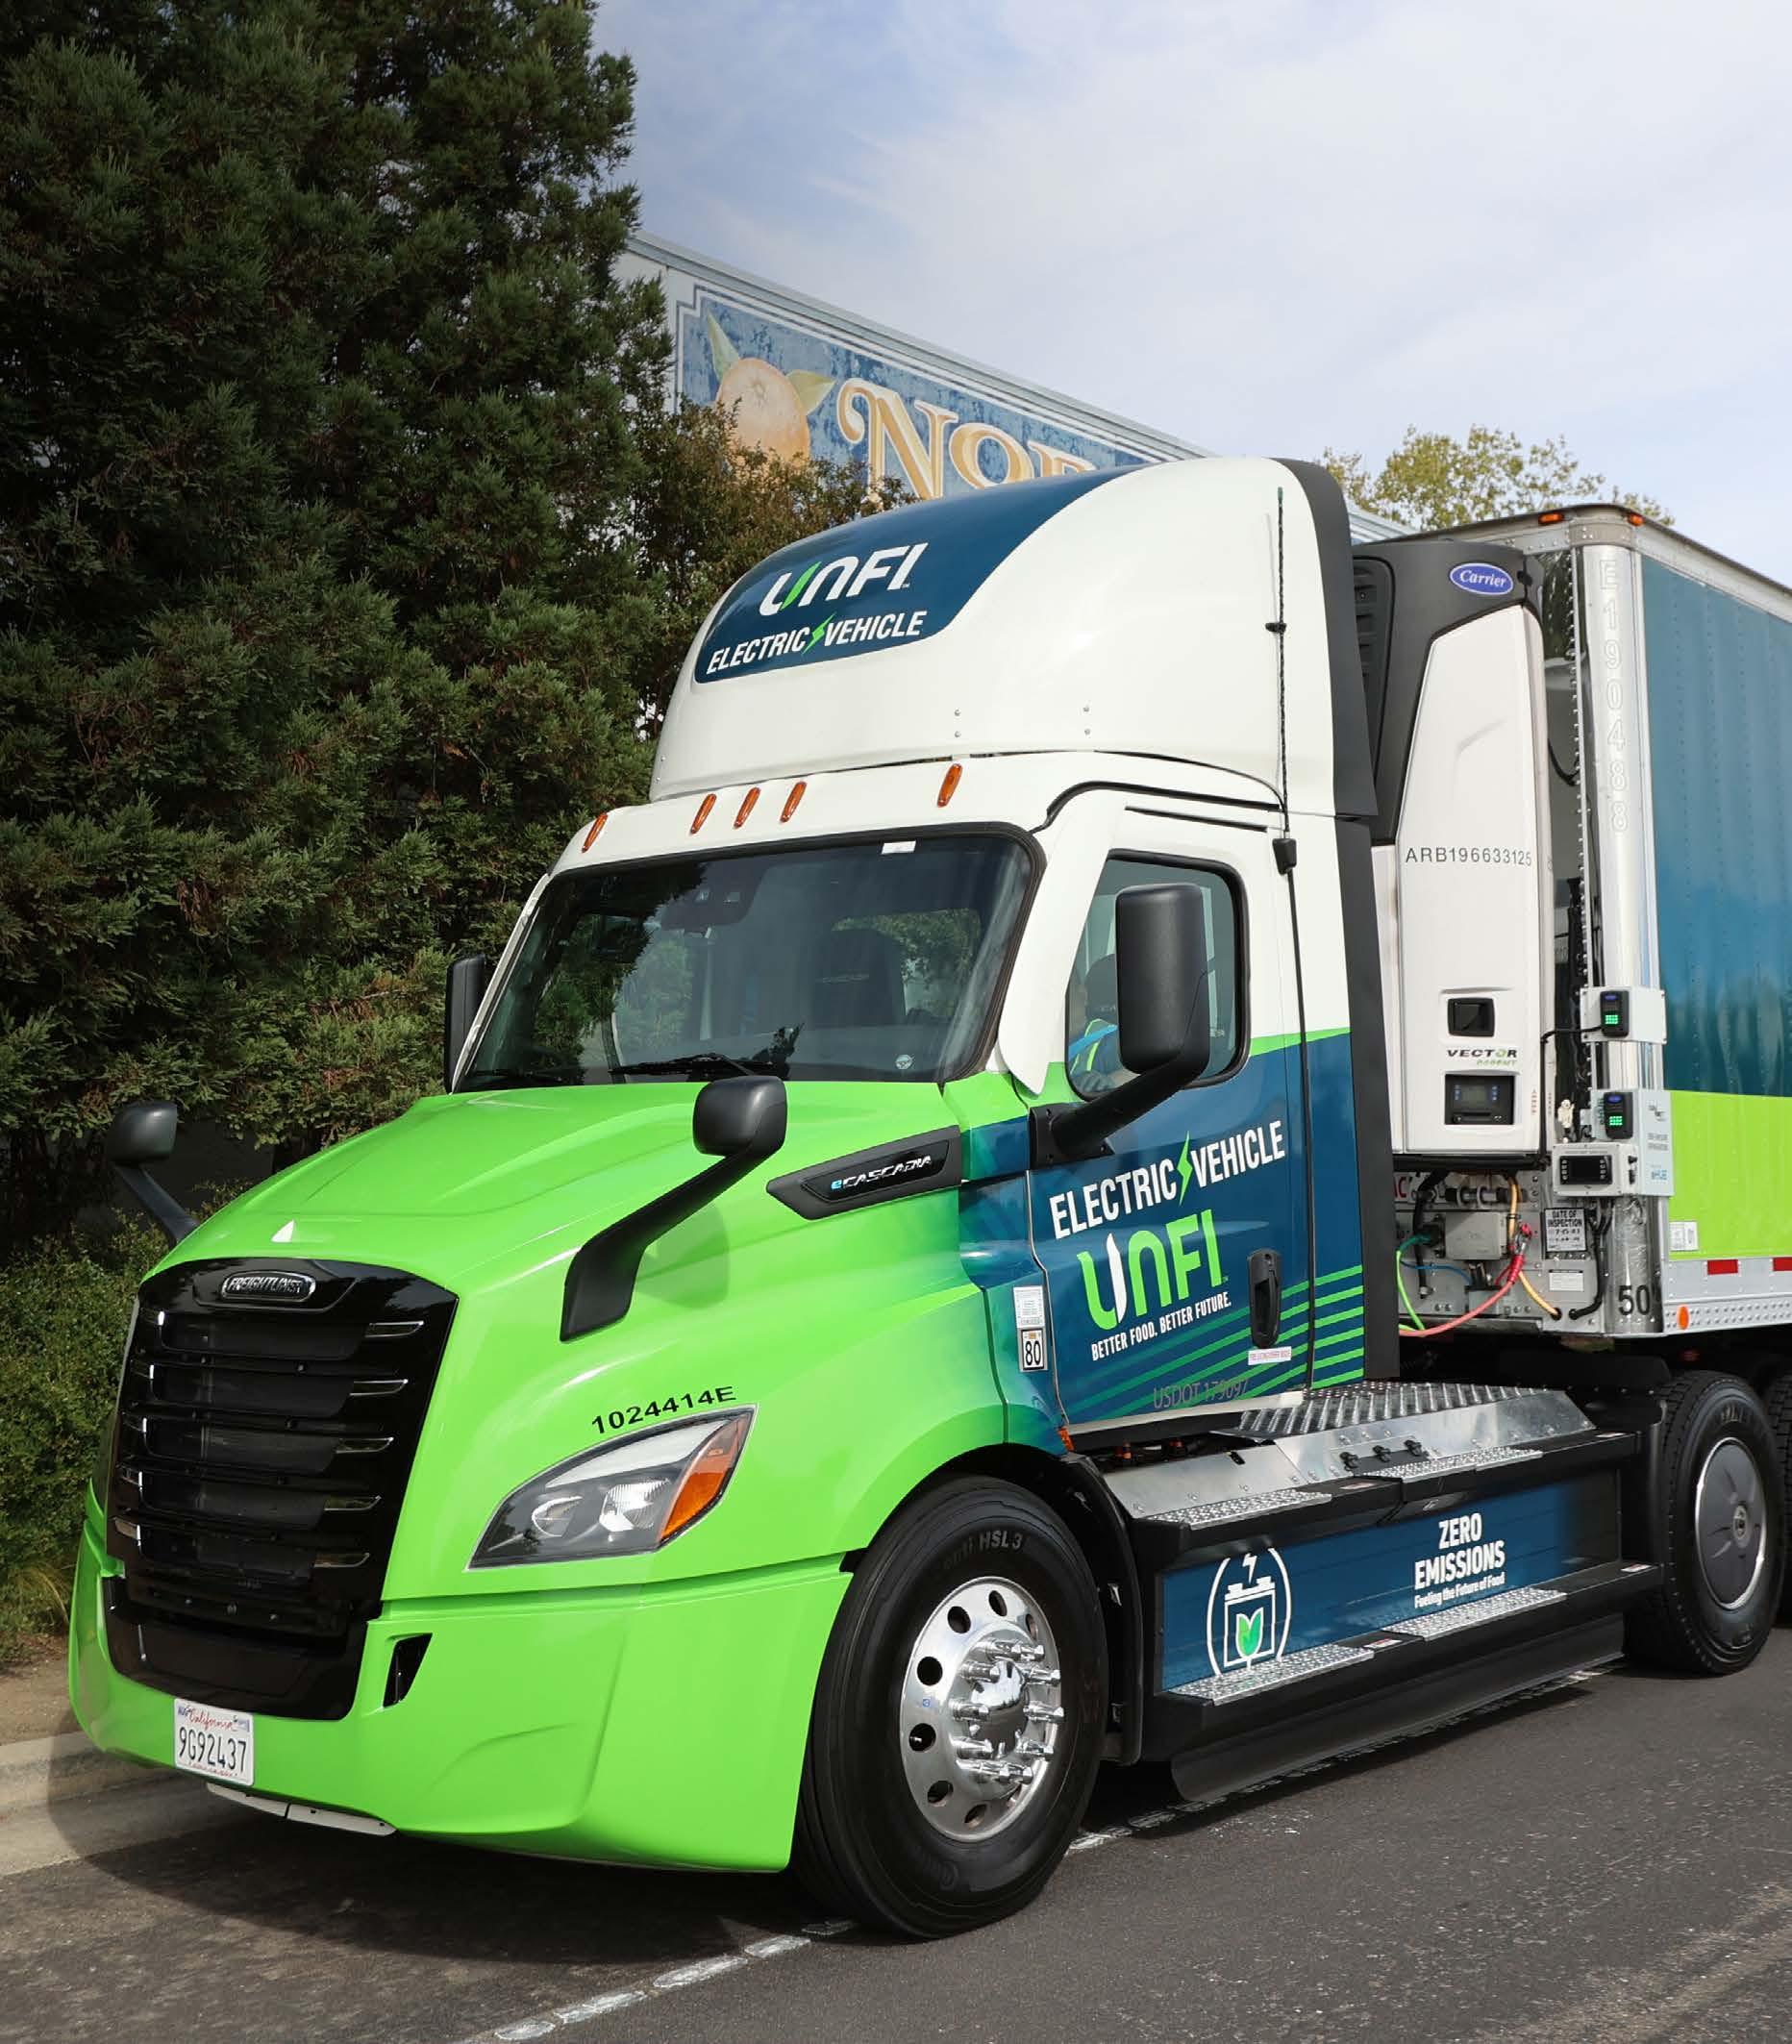
Accelerating Fleet Electrification:
We met with policymakers to promote publicprivate partnerships that incentivize the adoption of zero-emission heavy-duty fleets, focusing on solutions that create cost efficiencies and reduce emissions, while maintaining performance, service standards, and on-time delivery for our customers and suppliers. This included statelevel discussions where we shared our California fleet decarbonization experience to help shape programs that make owning, leasing, and charging heavy-duty electric vehicles more feasible.
Supporting Nutrition Assistance Programs:
We partnered with the National Grocers Association and FMI—The Food Industry Association to help protect federal nutrition assistance programs, including the Supplemental Nutrition Assistance Program (SNAP) and Women, Infants and Children (WIC) Program, and promote the responsible stewardship of these programs, helping to ensure that federal dollars are used wisely and effectively. UNFI is working to keep these resources accessible for all communities and supporting the retailers delivering these benefits.
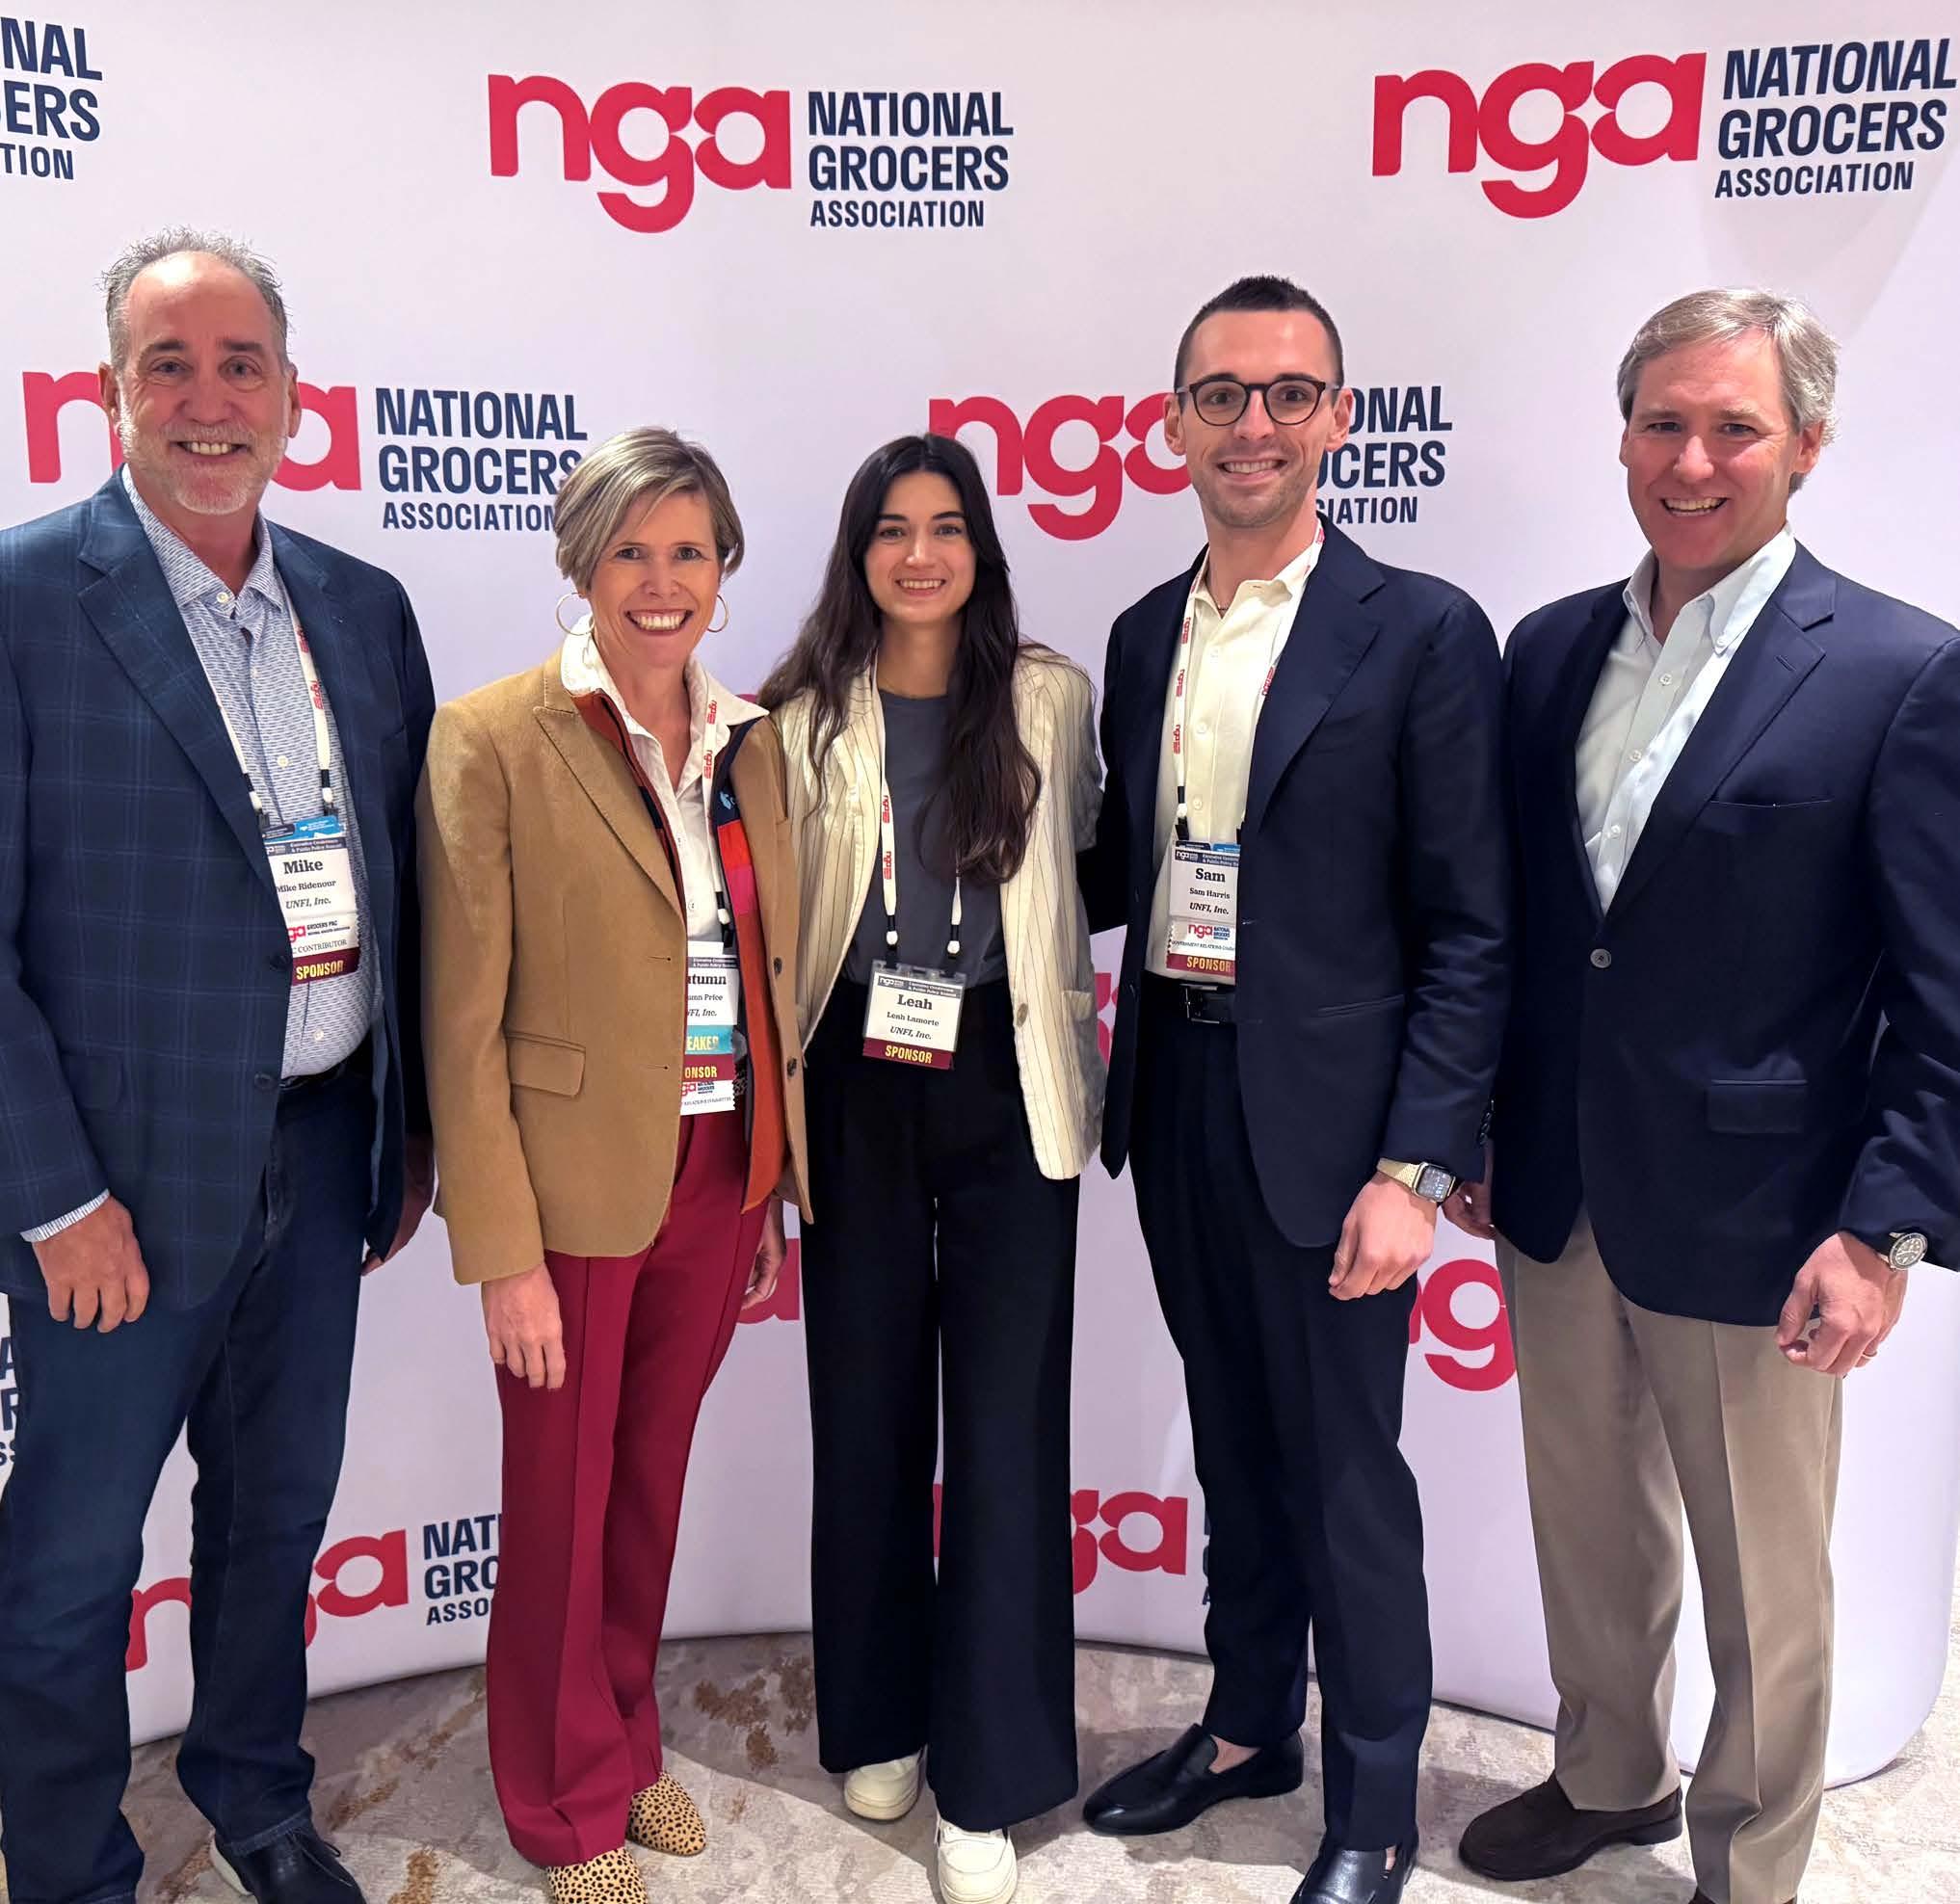
UNFI Government & Industry Relations team at the NGA Annual Executive Conference & Public Policy Summit in Washington, DC.
Convening Industry Leaders:
Our Industry Policy Council comprises leaders across the U.S. who work directly with state trade organizations, which include customer and industry executives. This council focuses on public policy priorities impacting businesses and communities. As an example, at the 2025 Produce Safety Consortium, we convened regulators across state governments to discuss how produce moves through the supply chain and offered industry preparation for FDA compliance.
Materiality Assessment Informs Our Impact Pillars
This year, we conducted a comprehensive materiality assessment to identify and prioritize the impact topics that are most significant to our stakeholders and our business operations. Our assessment applied the principle of double materiality to consider the impact of sustainability issues from both a business perspective and an environmental and community lens. We engaged a wide range of stakeholders —including customers, suppliers, associates, and consumers— through surveys and in-depth interviews.
We confirmed that our impact strategy is on the right track while highlighting additional opportunities to enhance our impact pillars. The results of this assessment are being used to inform our strategic planning, help us adapt to stakeholder needs, and embrace opportunities to grow our positive impact on the planet and communities we serve.
This year’s report is organized by the four streamlined impact pillars and twelve topics that were identified through this process.
Photo courtesy of Farmers Rising
Resilient Supply Chain
Building resilient supply chains that protect natural resources and support food producers as they address and adapt to a changing climate, helping to enhance product reliability from farm to shelf. We are actively investing in programs that build a broad supplier network, drive product quality and innovation, and safeguard the environment. We are advancing this through responsible sourcing practices, strong supplier partnerships, and investments in organic and regenerative agriculture.
Topics :
• Responsible Procurement
• Climate Change Mitigation & Adaptation
• Nature & Ecosystem Health
Efficient & Sustainable Operations
Optimizing resources while delivering greater value to our stakeholders and the planet. By investing in renewable energy and modernizing our fleet and routing technology, we are lowering our operating expenses and greenhouse gas (GHG) emissions. We are also pursuing a zero waste-to-landfills strategy to help us further reduce our environmental footprint.
Topics:
• Climate Change Mitigation & Adaptation
• Energy Use
• Waste Generation & Diversion
Thriving Associates
Creating a workplace where every associate feels safe, valued, and empowered to reach their full potential. We are building this culture through comprehensive safety programs, well-being initiatives, Belonging & Innovation Groups, competitive benefits, and leadership development opportunities. We believe that when associates thrive, they deliver better service, drive innovation, and become champions for positive change in their communities.
Topics:
• Health & Safety
• Engagement & Well-being
• Equal Opportunities
Nourished Communities
Supporting the health and well-being of communities across the U.S. and Canada by supporting consistent access to safe, nutritious food while strengthening the local economies. By upholding product quality standards, offering a robust portfolio of owned brands, and developing meaningful community partnerships via the UNFI Foundation, we aim to support strong, vibrant communities where everyone can thrive.
Topics:
• Community Health & Food Safety
• Food Access
• Community Livelihood
UNFI’s Climate Action Partnership has provided meaningful opportunities to connect with, celebrate, and draw inspiration from other purpose-driven companies committed to climate action.
– Manuel Gorrin, Director of Mission and JEDI at Nature’s Path Organic Foods
Focus Area:
Resilient Supply Chain
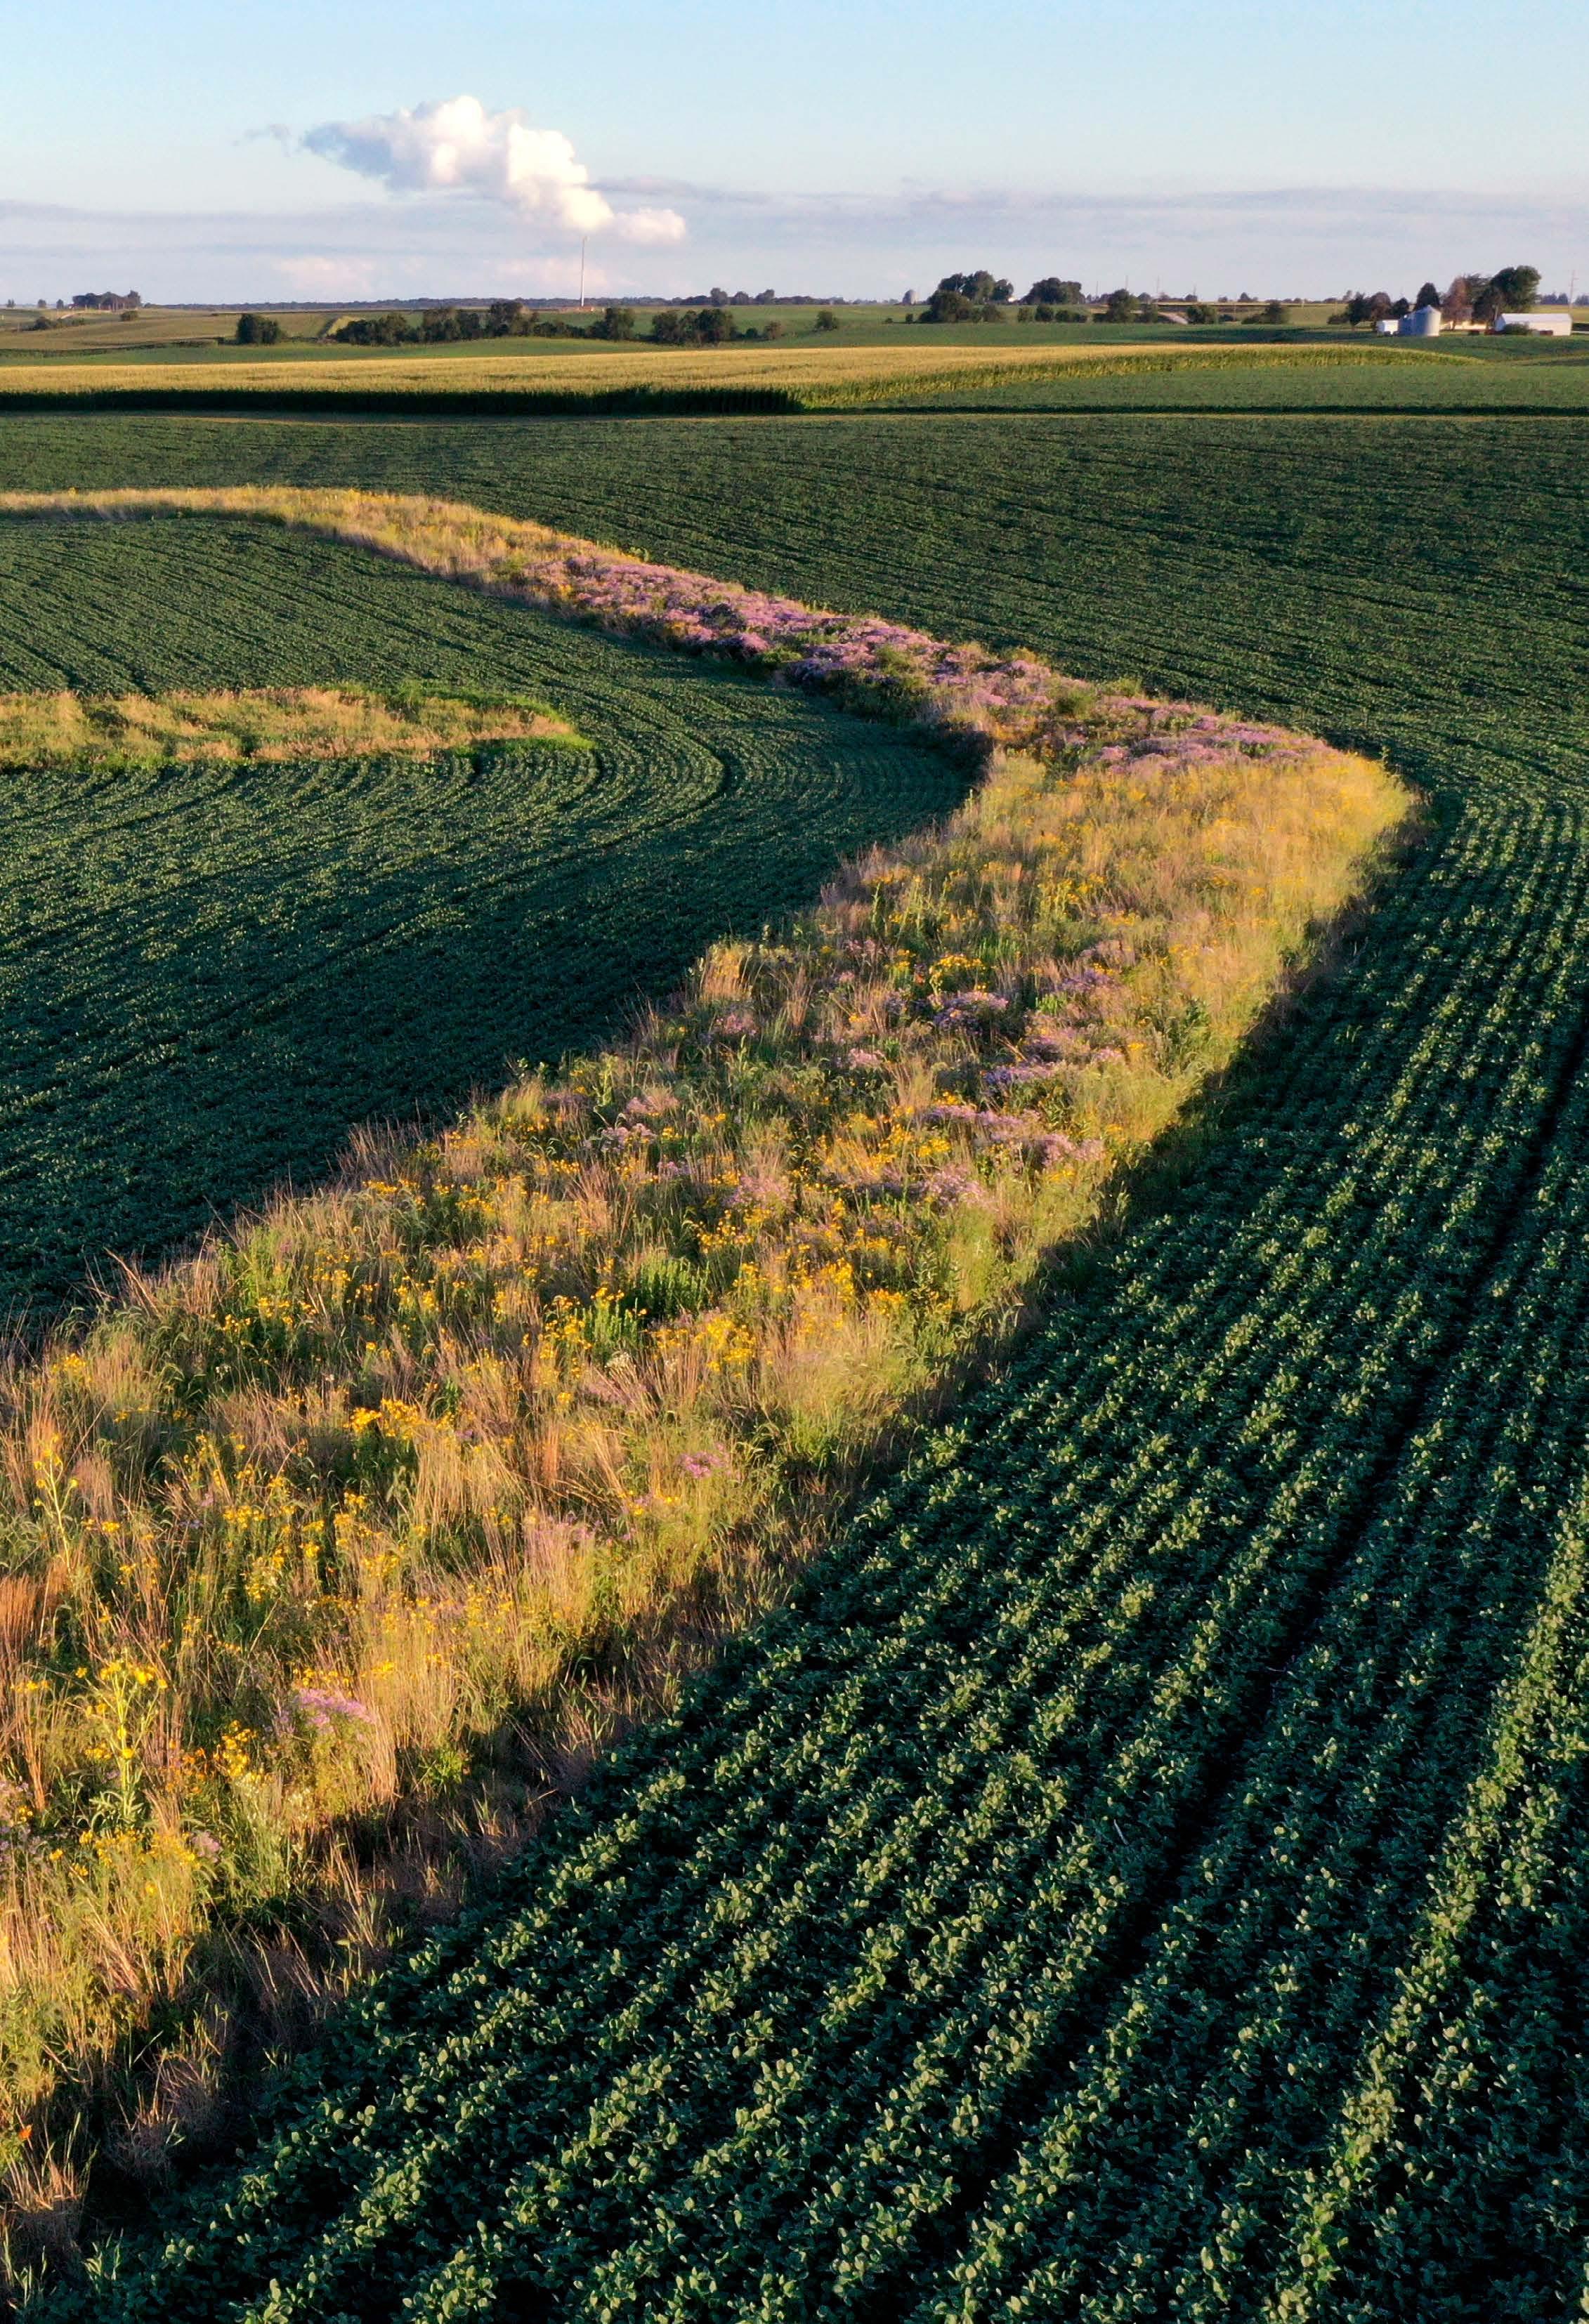
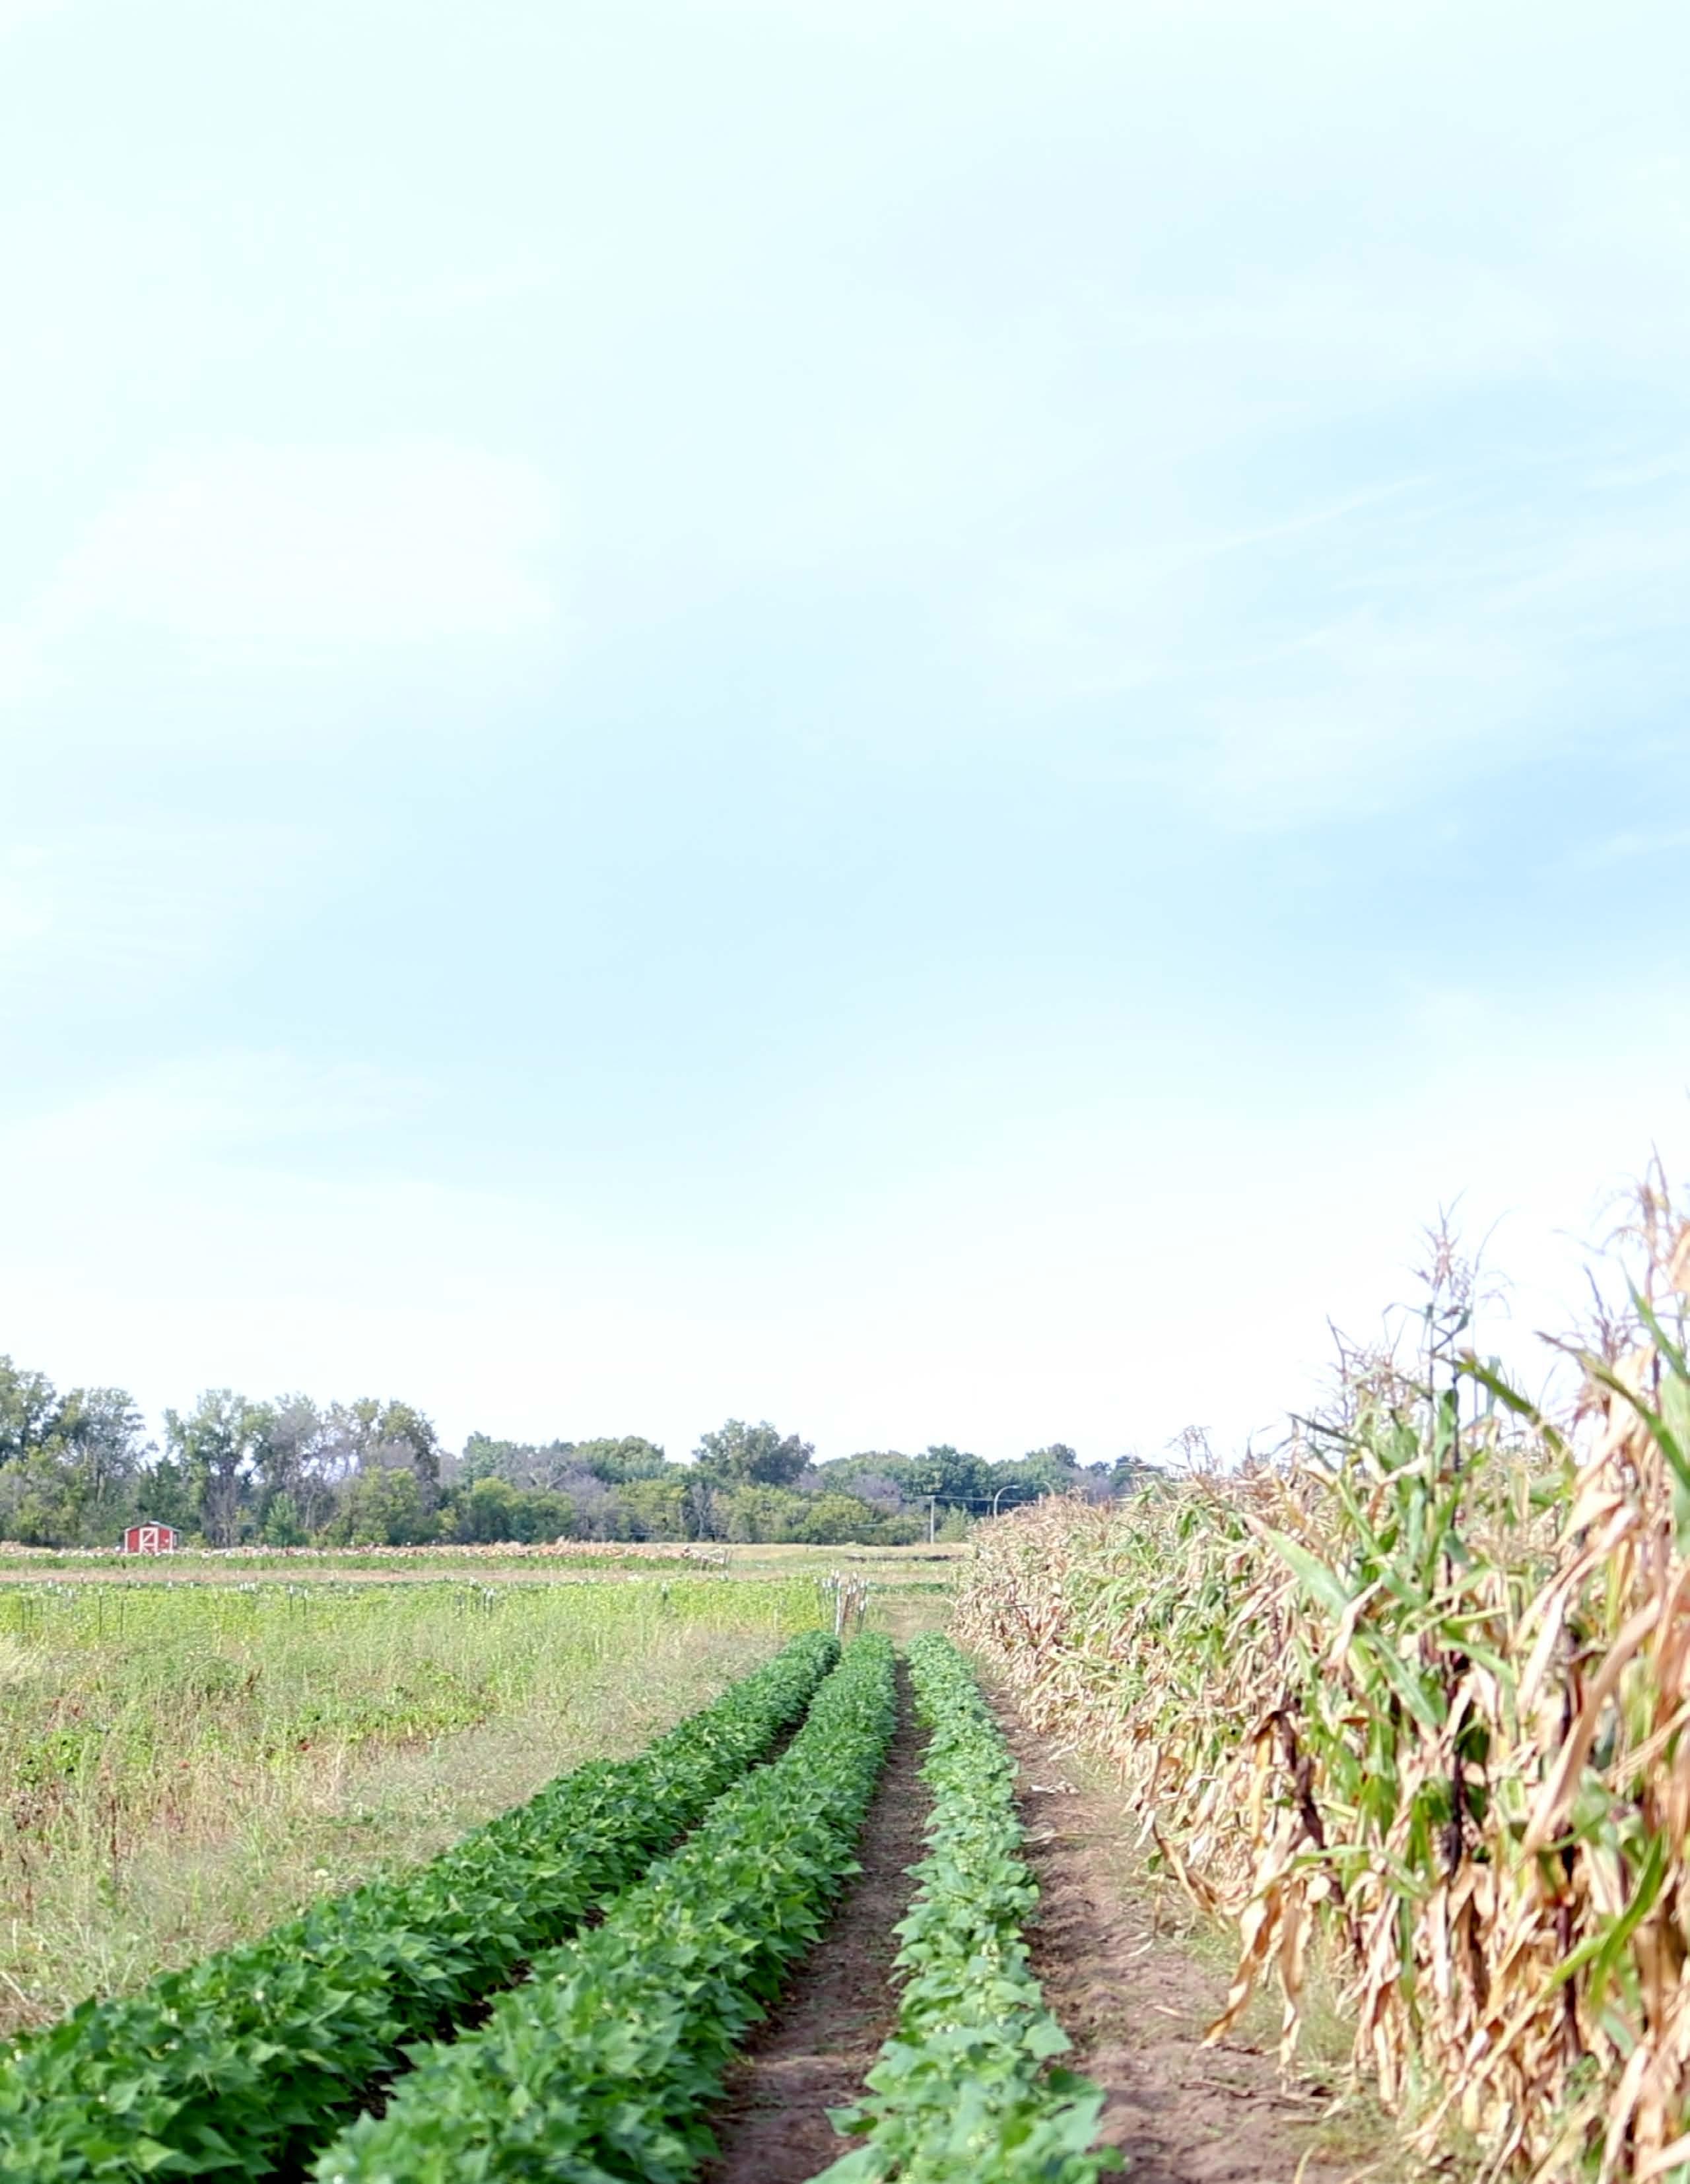
Supply chains that are resilient and holistic can better respond to the challenges our food system faces, such as increasingly volatile climate events, regulatory shifts, and evolving consumer expectations. We are adapting to these challenges by advancing soil health and zero-deforestation initiatives, working with a broad array of suppliers and retailers and focusing our efforts to reduce our Scope 3 greenhouse gas (GHG) emissions.
This year, we surpassed our goal of promoting soil health through regenerative and organic practices on one million acres by 400,000 acres. We also increased supplier participation in the UNFI Climate Action Partnership (CAP) by 30%. This program provides resources and support to help suppliers measure, manage, and minimize their climate impact.
We brought together industry leaders to share insights and accelerate progress on climate action at our first in-person Climate Summit at Natural Products Expo West, an annual industry event showcasing the latest trends and products in the natural, organic, and healthy products industry.
We supported our commitment to no-deforestation through responsible palm oil sourcing and by helping our third-party beef and palm suppliers achieve deforestation-free supply chains through enhanced engagement and tracking.
Topics to be covered:
• Responsible Procurement
• Climate Change Mitigation & Adaptation in our Supply Chain
• Nature & Ecosystem Health
Left photo courtesy of Omar de Kok-Mercado, Mad Agriculture / Image courtesy of Iowa State University
2
Responsible Procurement
We aim to promote ethical sourcing, enhance transparency in our supply chain, and expand our product pipelines and portfolios to meet evolving consumer preferences.
We believe these efforts will help us provide a suite of product offerings to help our customers differentiate in the marketplace, strengthen supplier relationships, and be resilient in the face of disruption—all while creating economic opportunities for underrepresented business owners.
Breaking down our approach:
• Enhanced Compliance: Providing clear expectations through our Supplier & Vendor Code of Conduct during the supplier onboarding process.
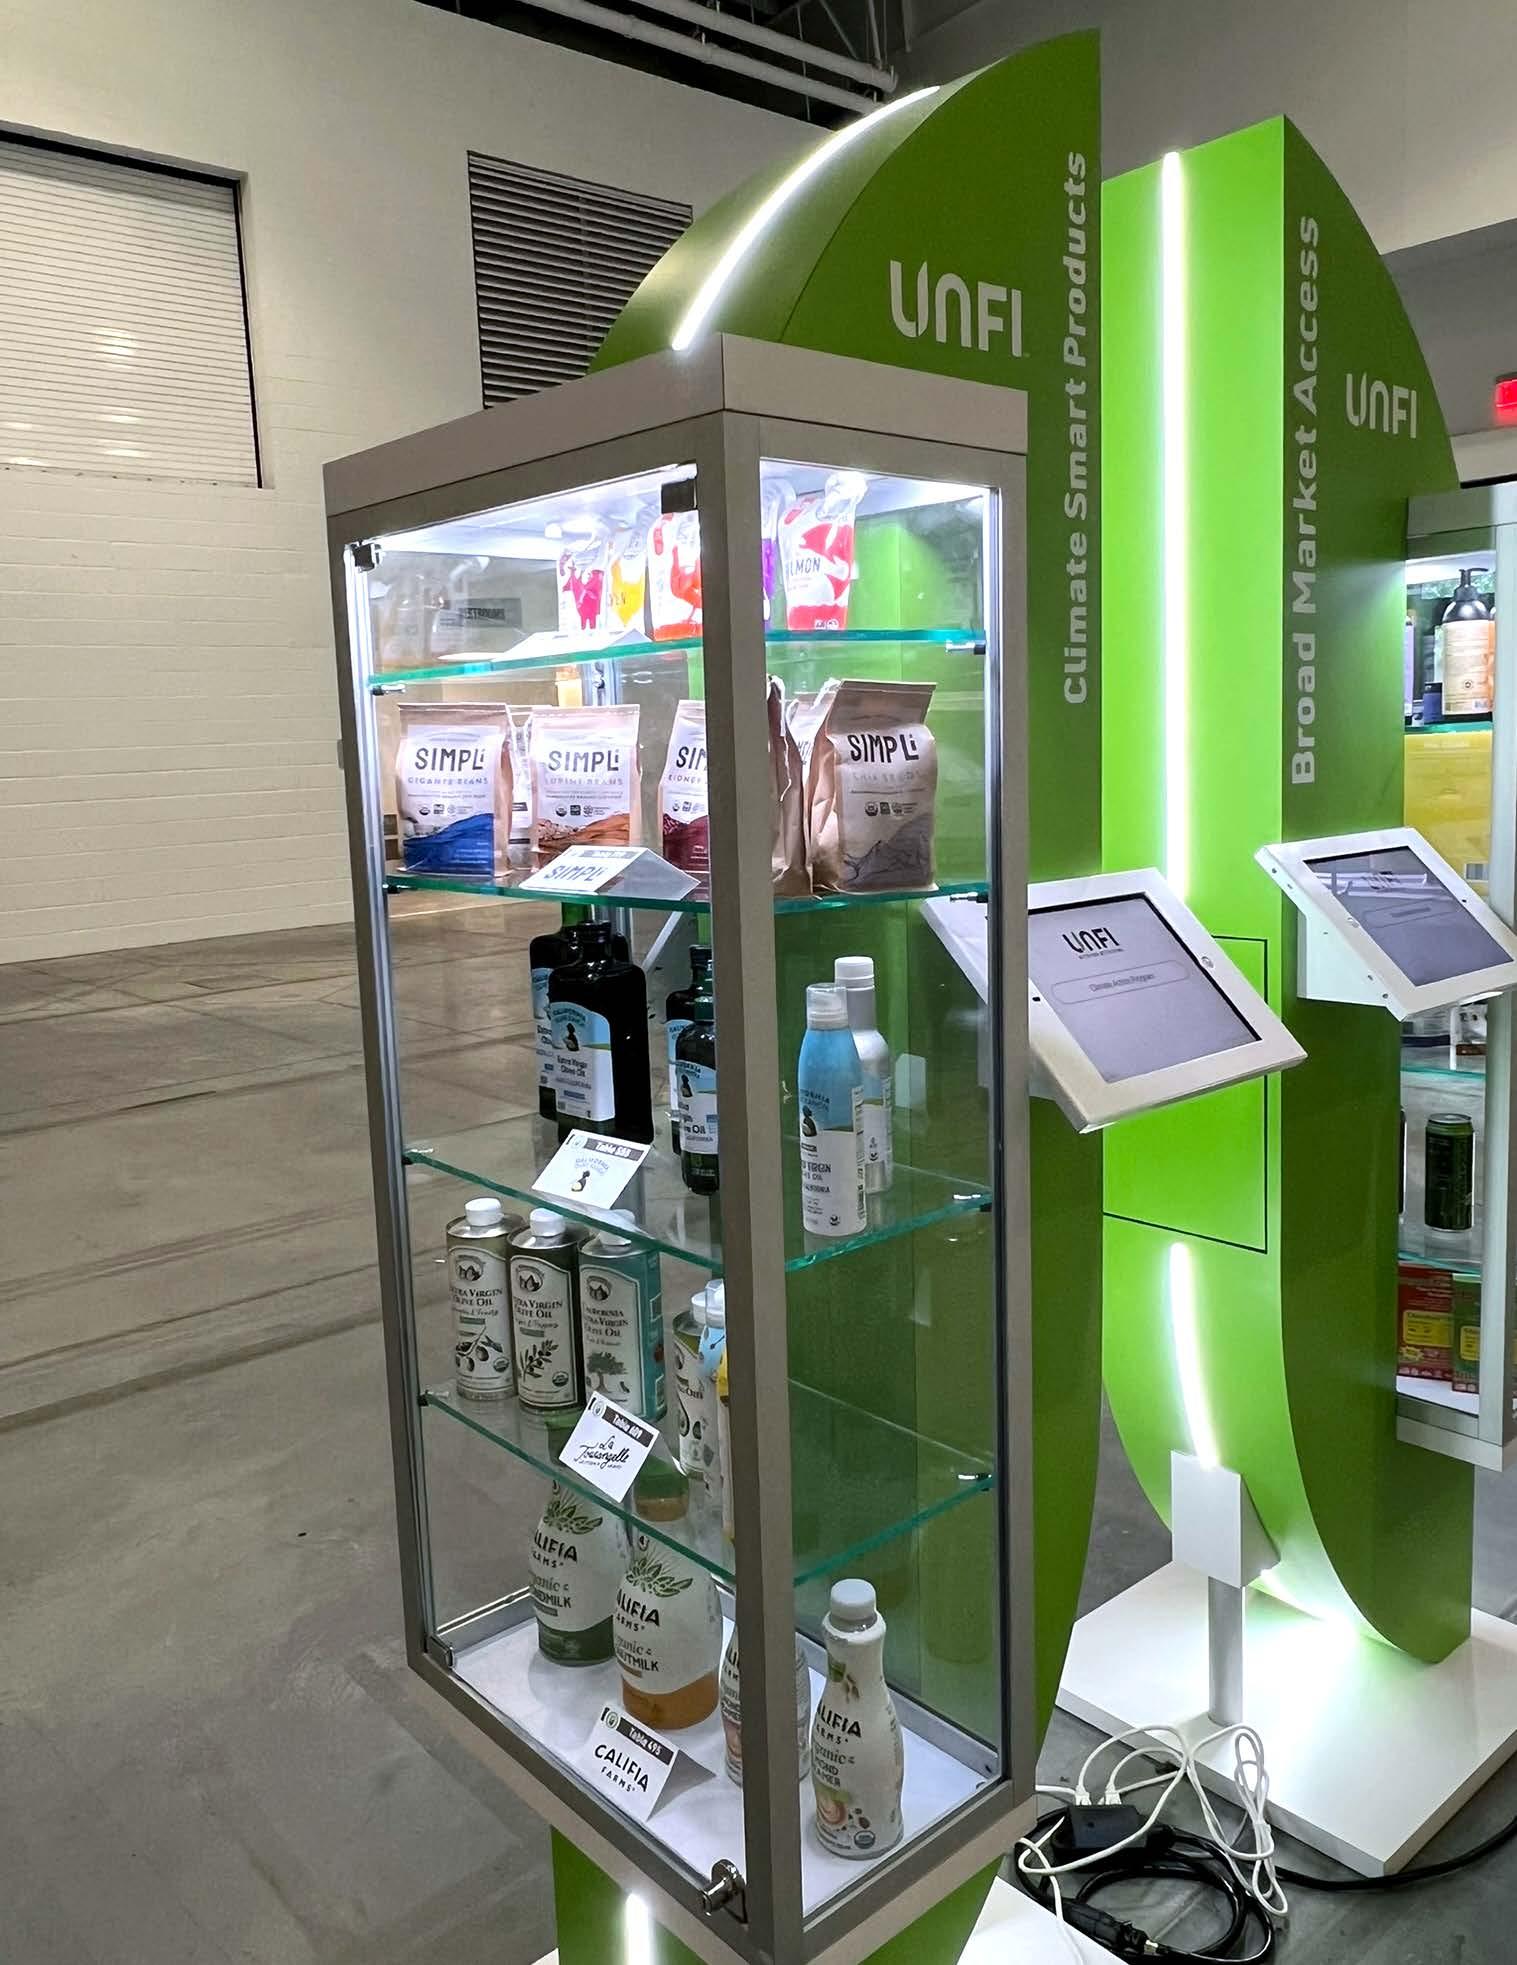
• Broad Market Access Program: 2 Bringing innovative products to our customers, including products created by underrepresented groups like veterans or people with disabilities.
• Supplier Development: Providing resources to help our suppliers be competitive in the marketplace. Our Supplier Services team collaborates with suppliers to develop tailored plans to scale growth and sales by providing insightful data and strategies, while our UpNext program offers mentorship, certification assistance, and in-person trainings to support emerging brands.
• Merchandising Support: Helping customers feature responsibly produced products year-round through merchandising programs, promotional calendars, and shelf planning.
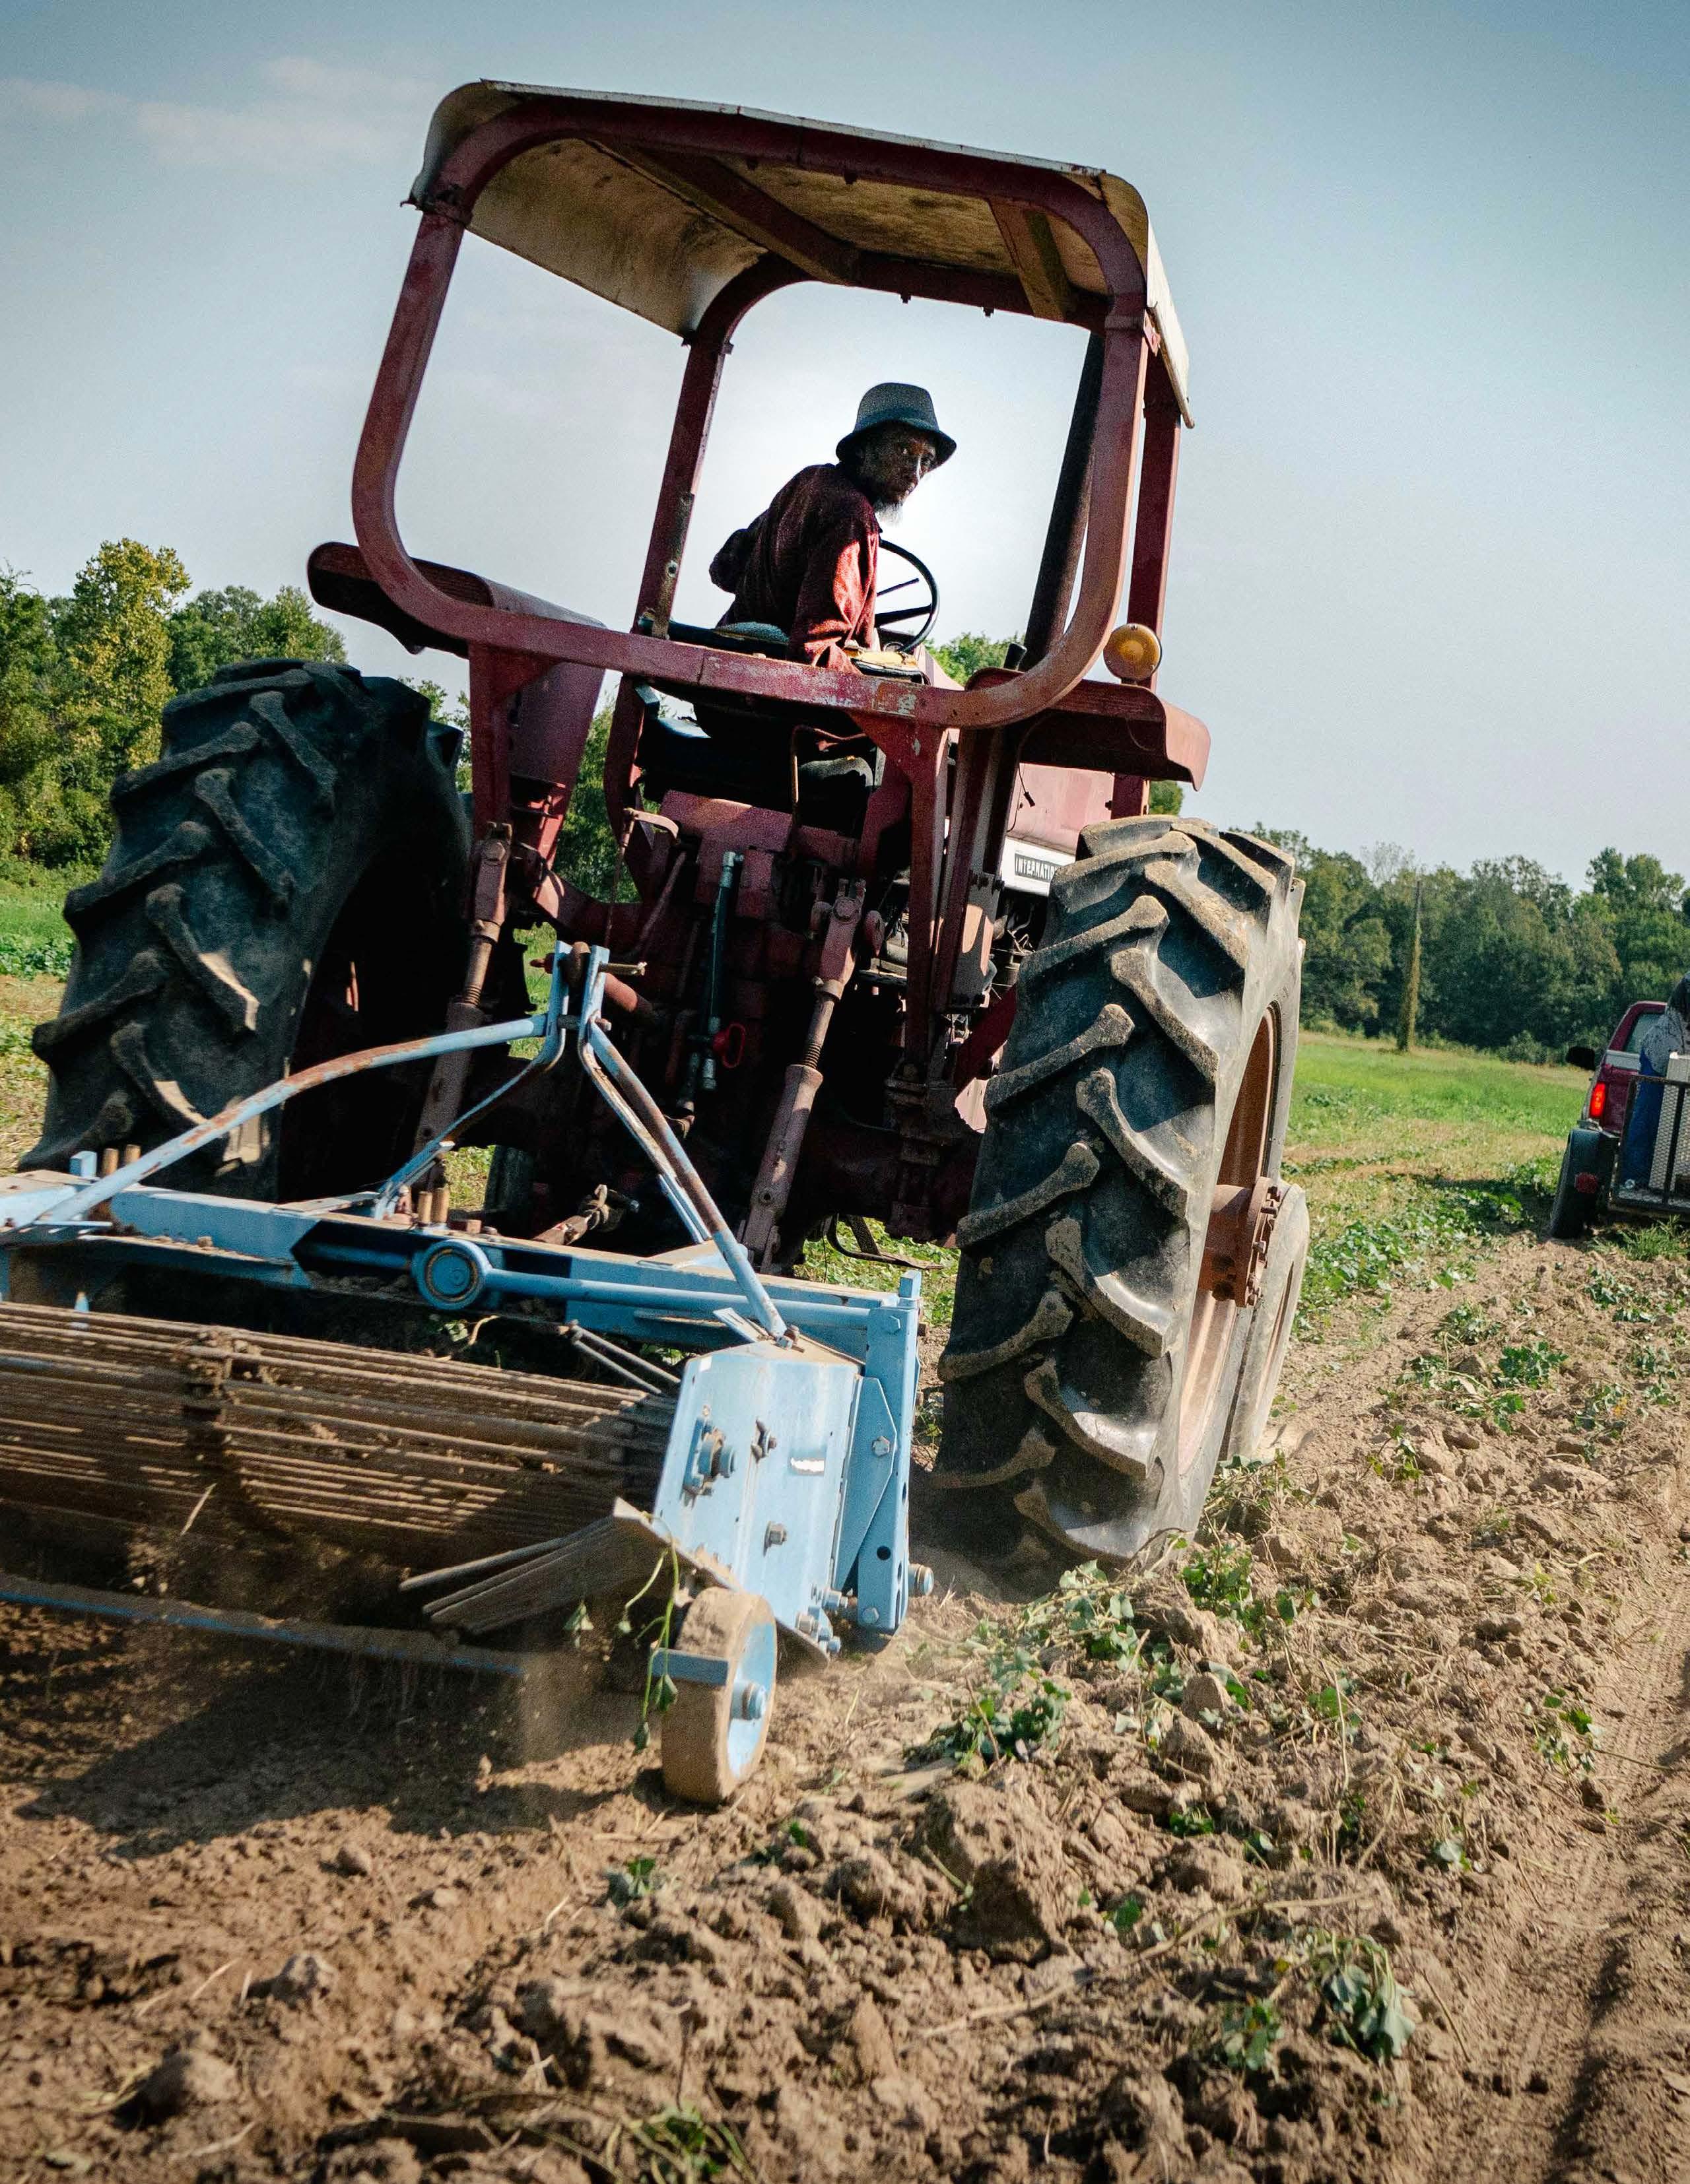
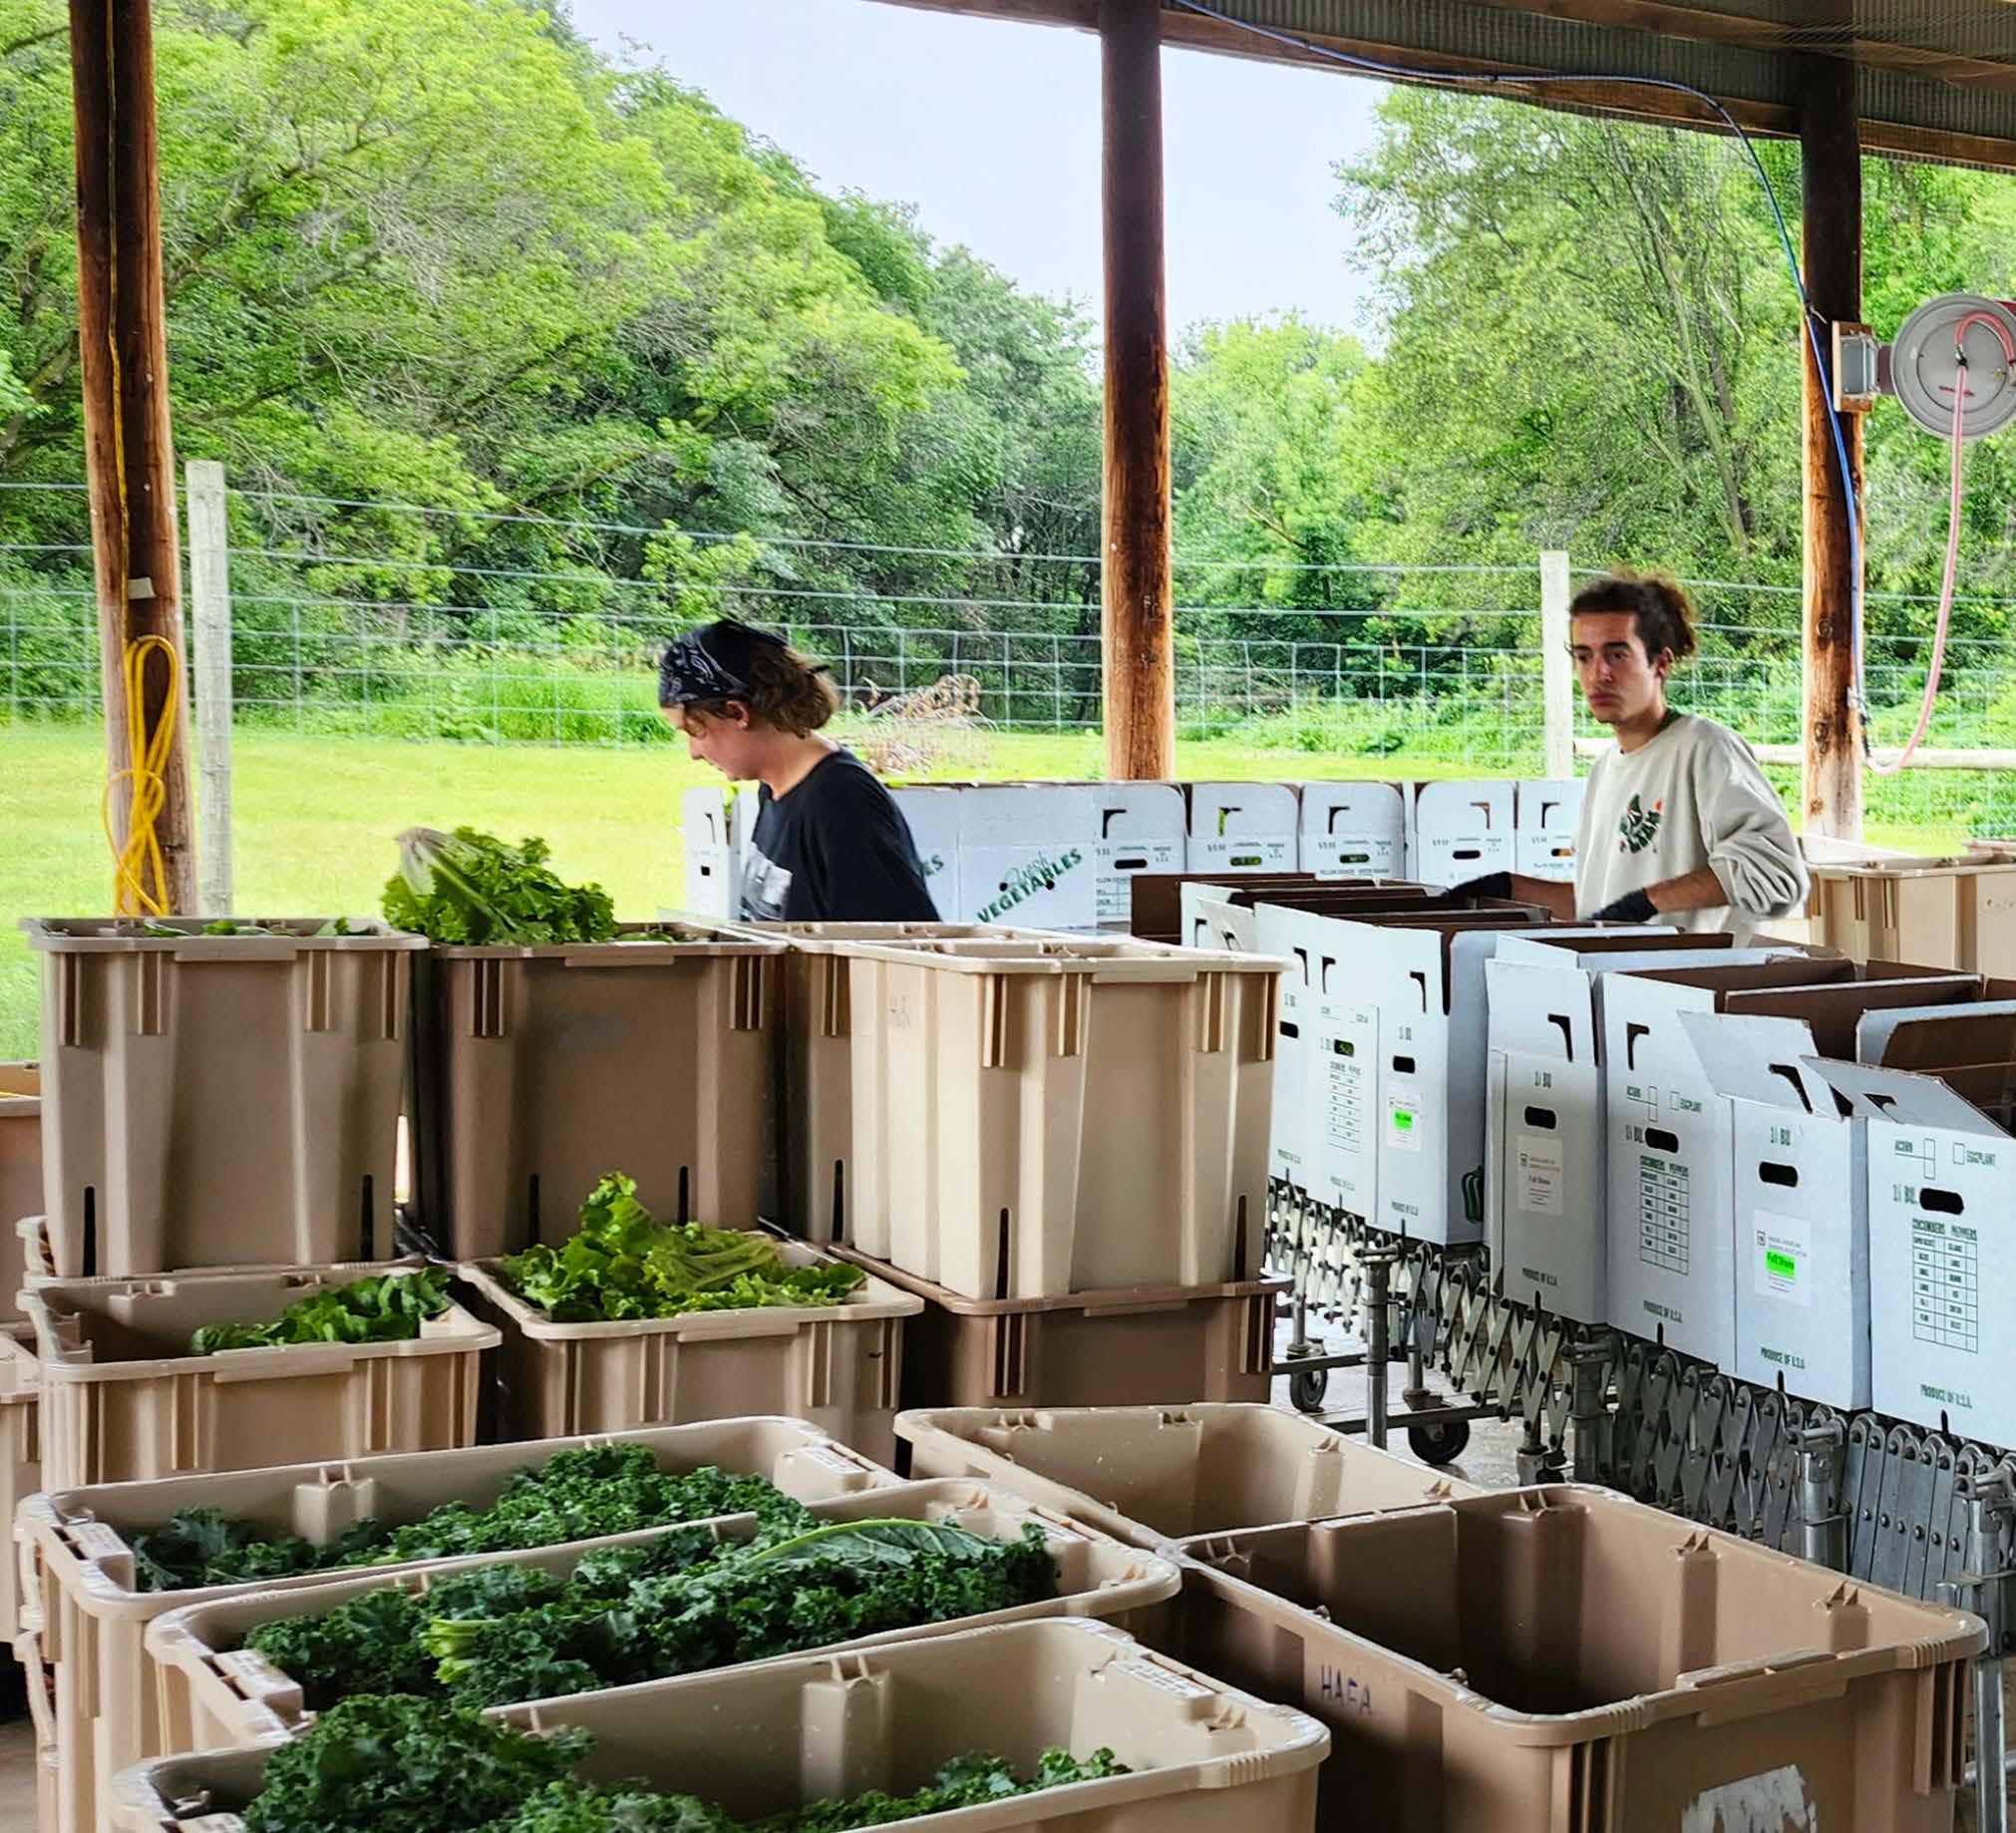
Founded in 1942, UNFI supplier Mileston Farmers' Cooperative Association in Holmes County, MS, one of the oldest black-owned agricultural cooperatives in the country, is partnering with UNFI to grow sales and scale distribution.
Photo courtesy of Mileston Cooperative
This year, UNFI’s UpNext program connected emerging brands with UNFI technical experts for a bootcamp to strengthen their knowledge of logistics, procurement, and sales.
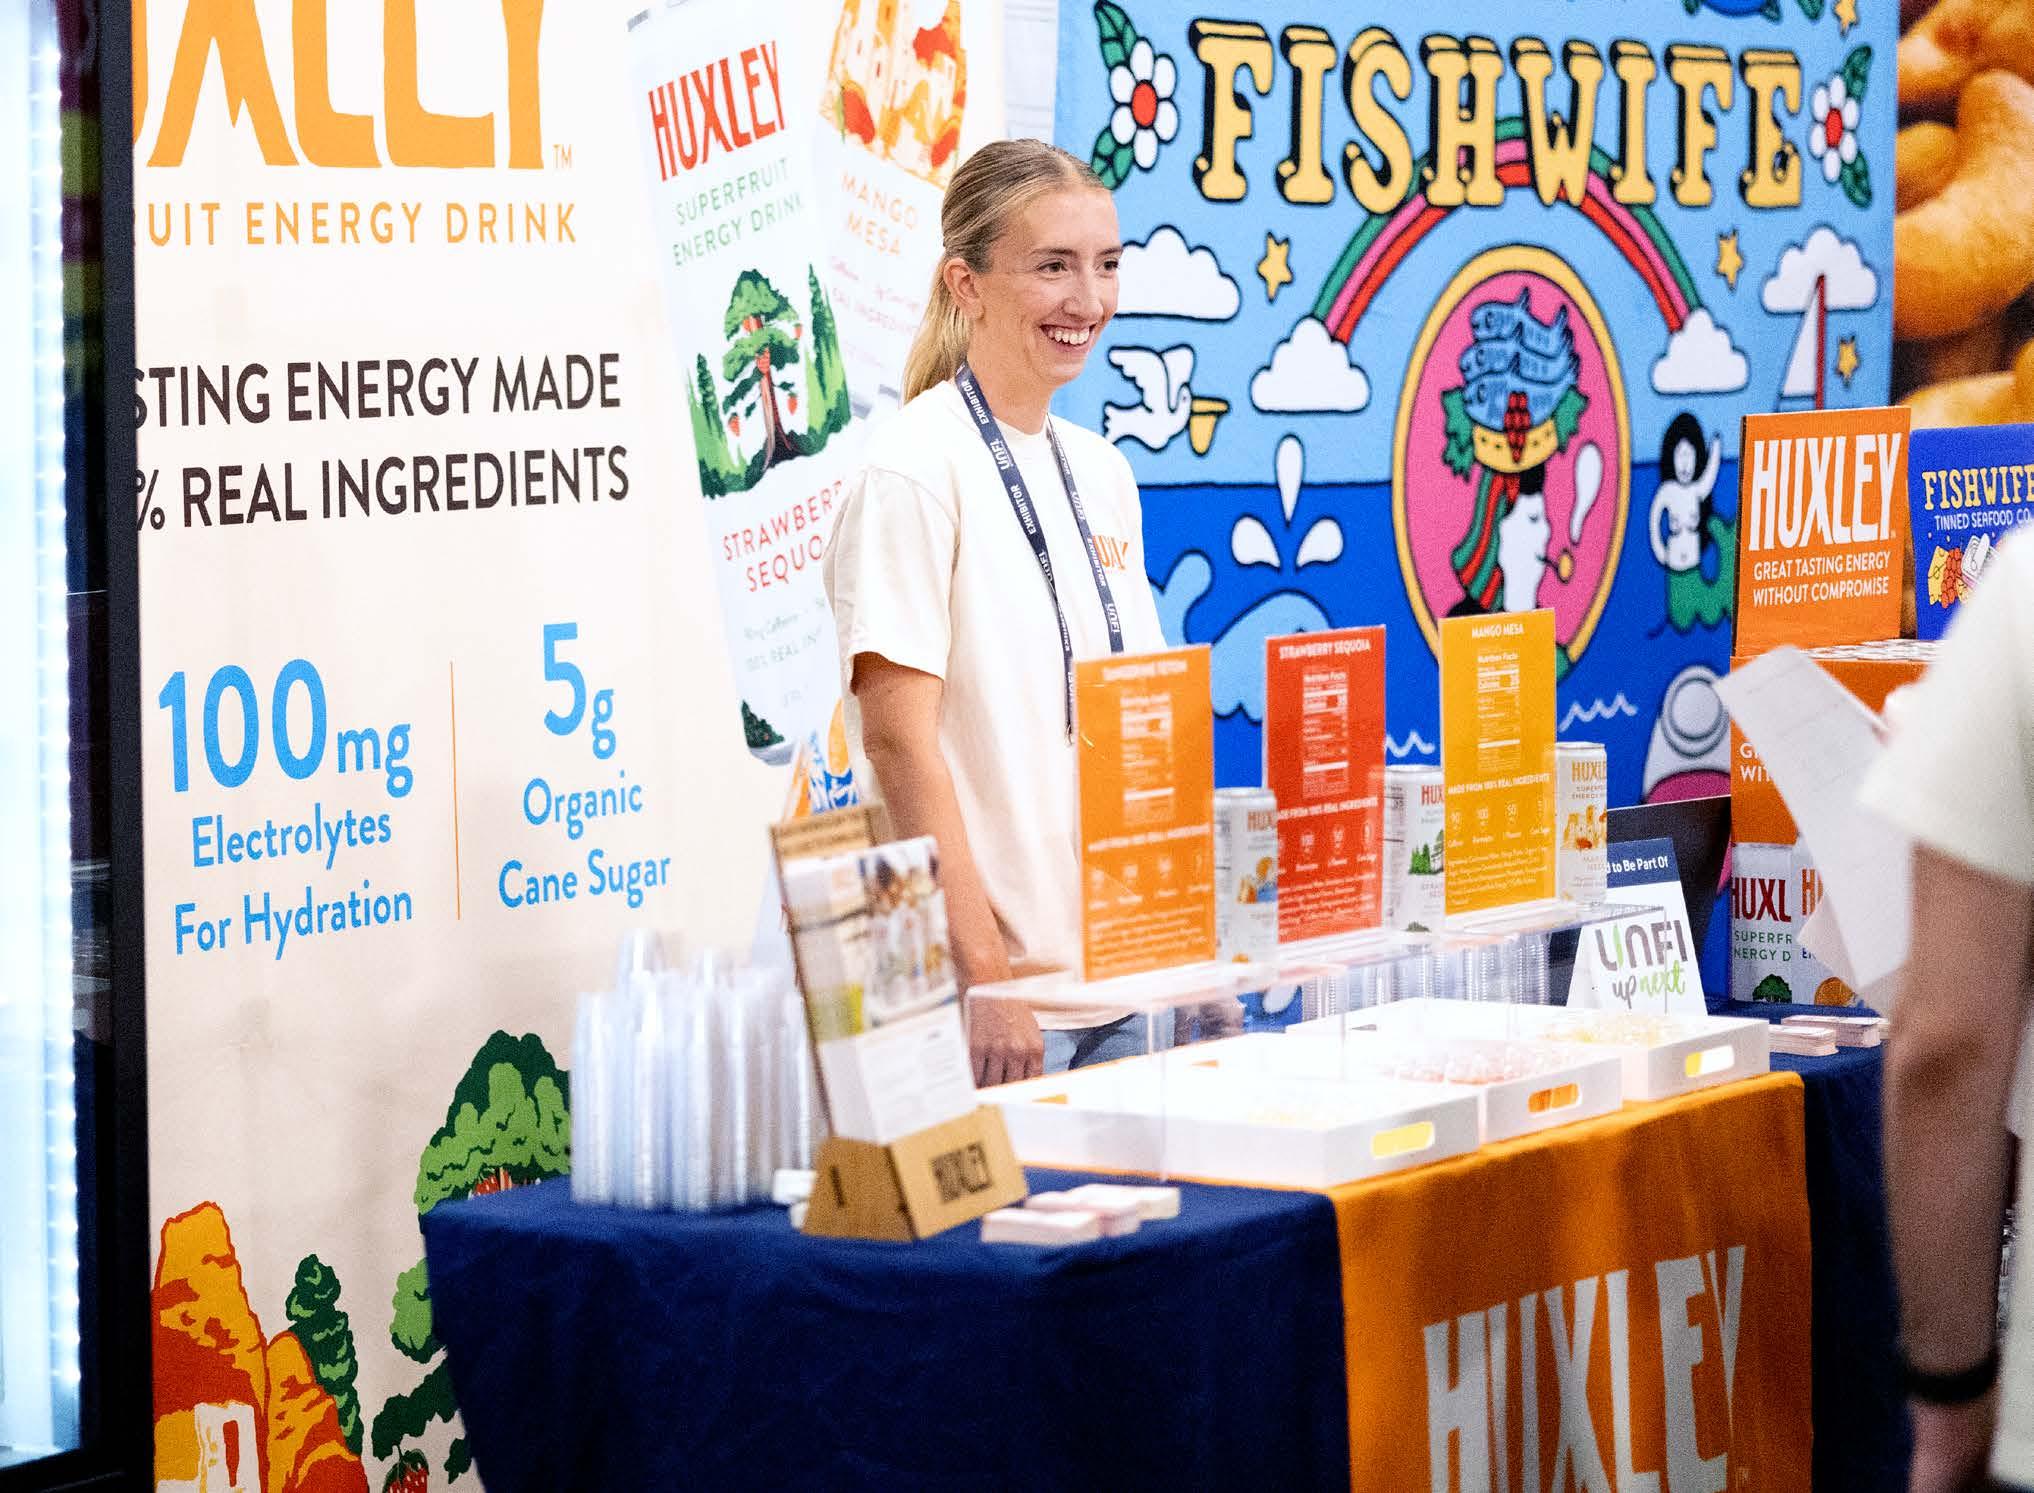
Our Broad Market Access program worked to widen the array of offerings available to customers and to provide marketing and promotional support to underrepresented brands at selling shows, in customer catalogues, and online.
Our spend through the Broad Market Access program increased 13% from the prior year, reflecting our continued commitment to strengthening our supply chain, sourcing strategically, and investing in communities.
UNFI’s UpNext program has helped us broaden our visibility and reach more consumers in their favorite stores. We’re grateful for the partnership and look forward to continuing to grow together.
– Simon Solis-Cohen, Huxley founder
3
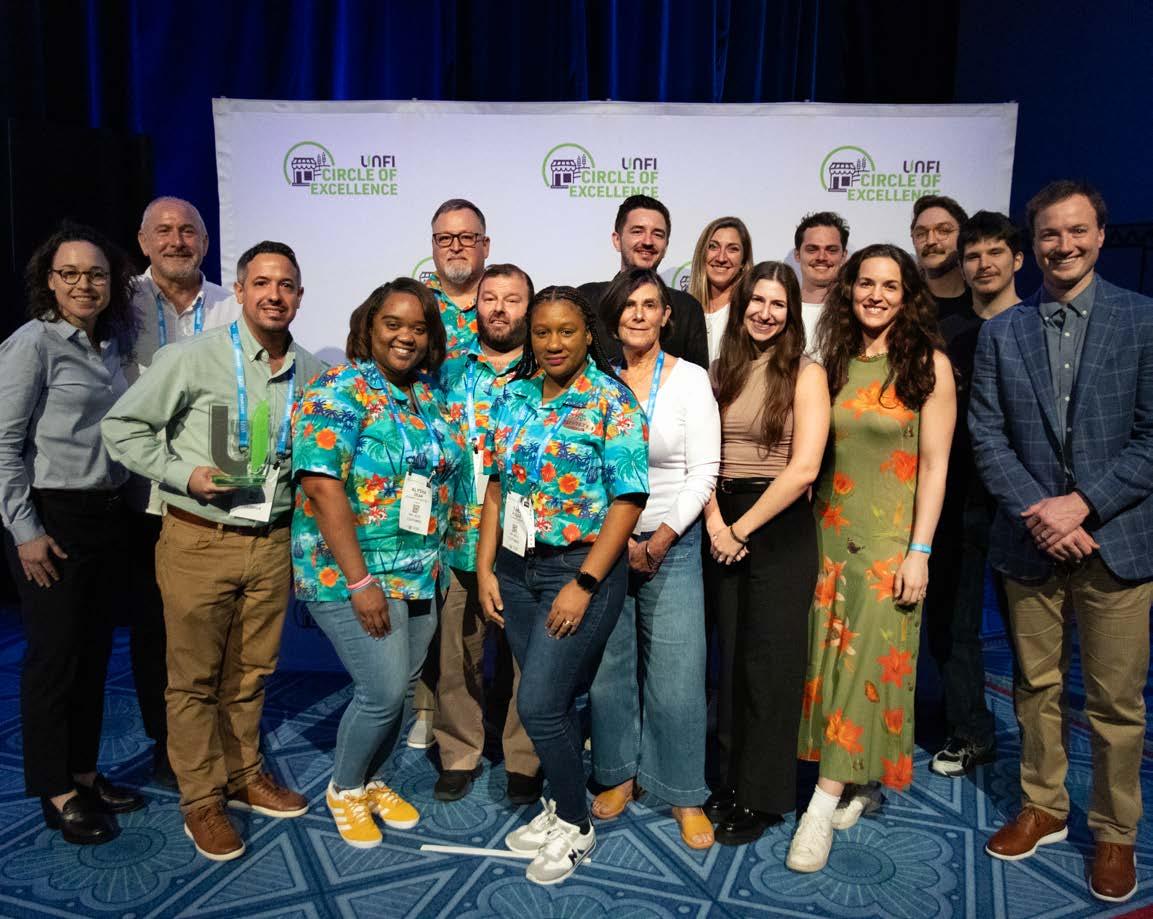
Celebrating Suppliers
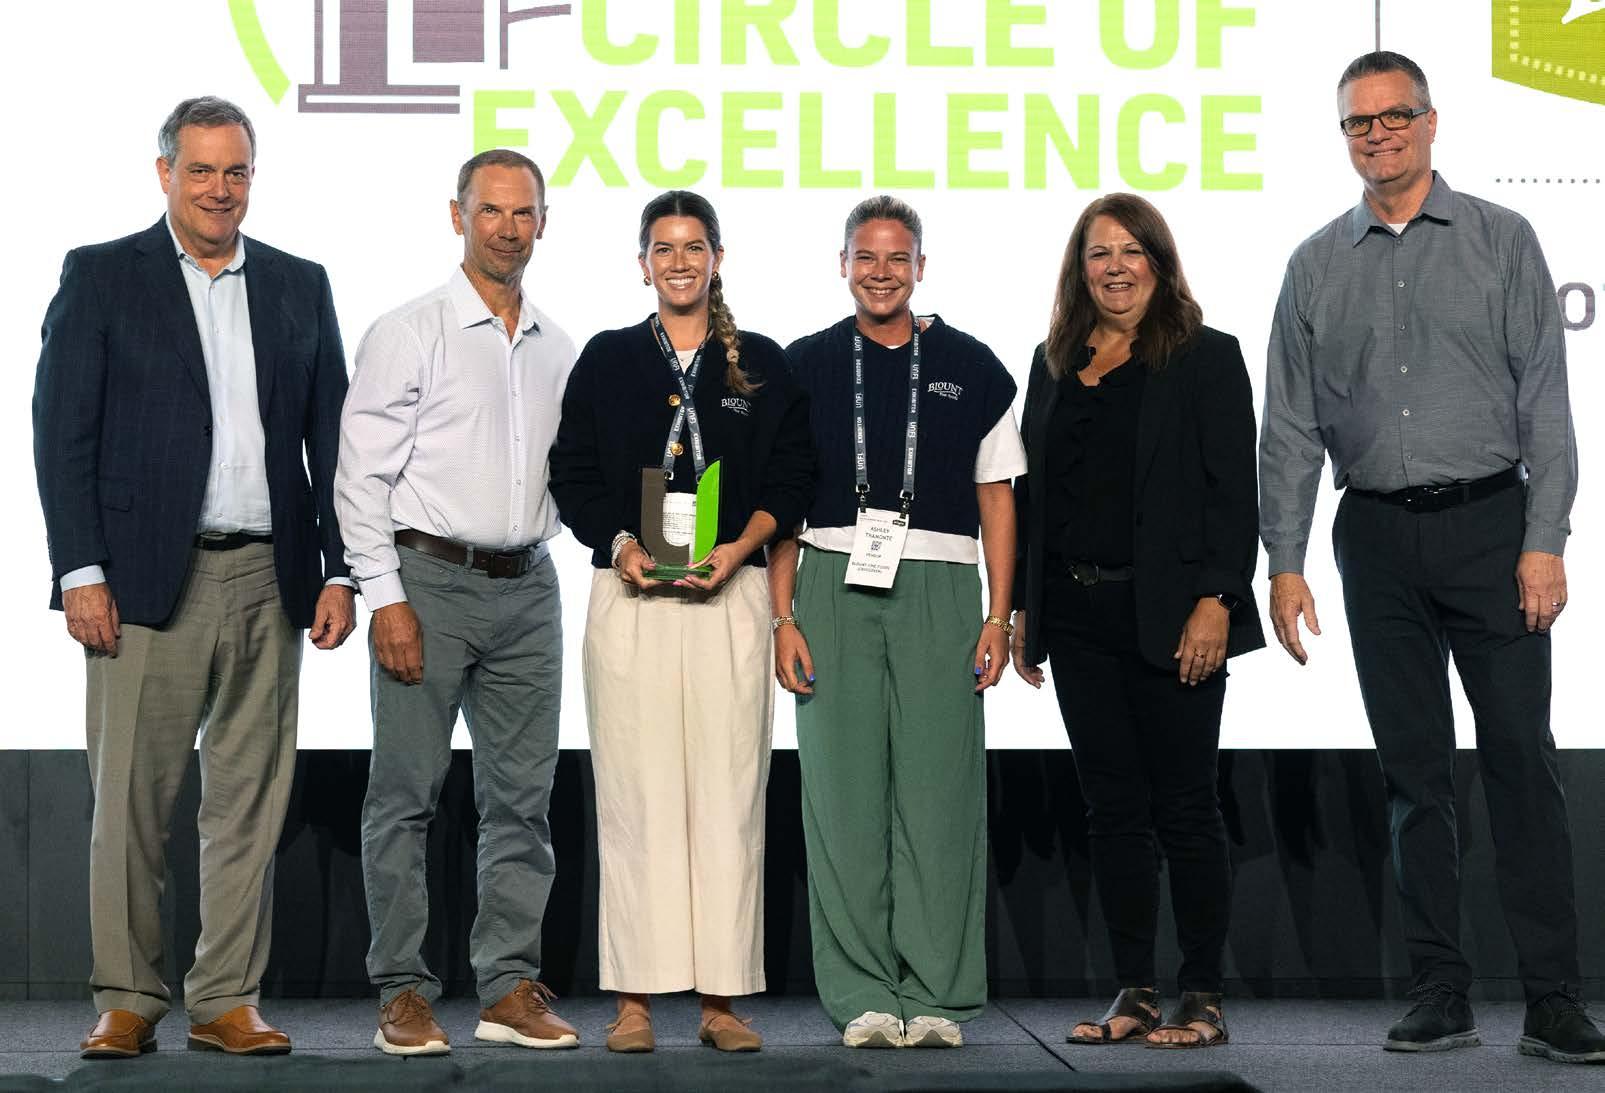
We’re honored to collaborate with suppliers to advance a shared vision for a better future. At our selling shows this year, we celebrated suppliers making meaningful contributions in their communities through our Circle of Excellence Awards.
~ $818M spent with 795 certified suppliers 3
~ 3% of total procurement spend with Broad Market Access program suppliers
80 new active Broad Market Access program suppliers
5 UpNext Pitch Slam events where UpNext suppliers promote their products to customers and suppliers
UNFI CEO Sandy Douglas with Circle of Excellence winner, Blount Fine Foods.
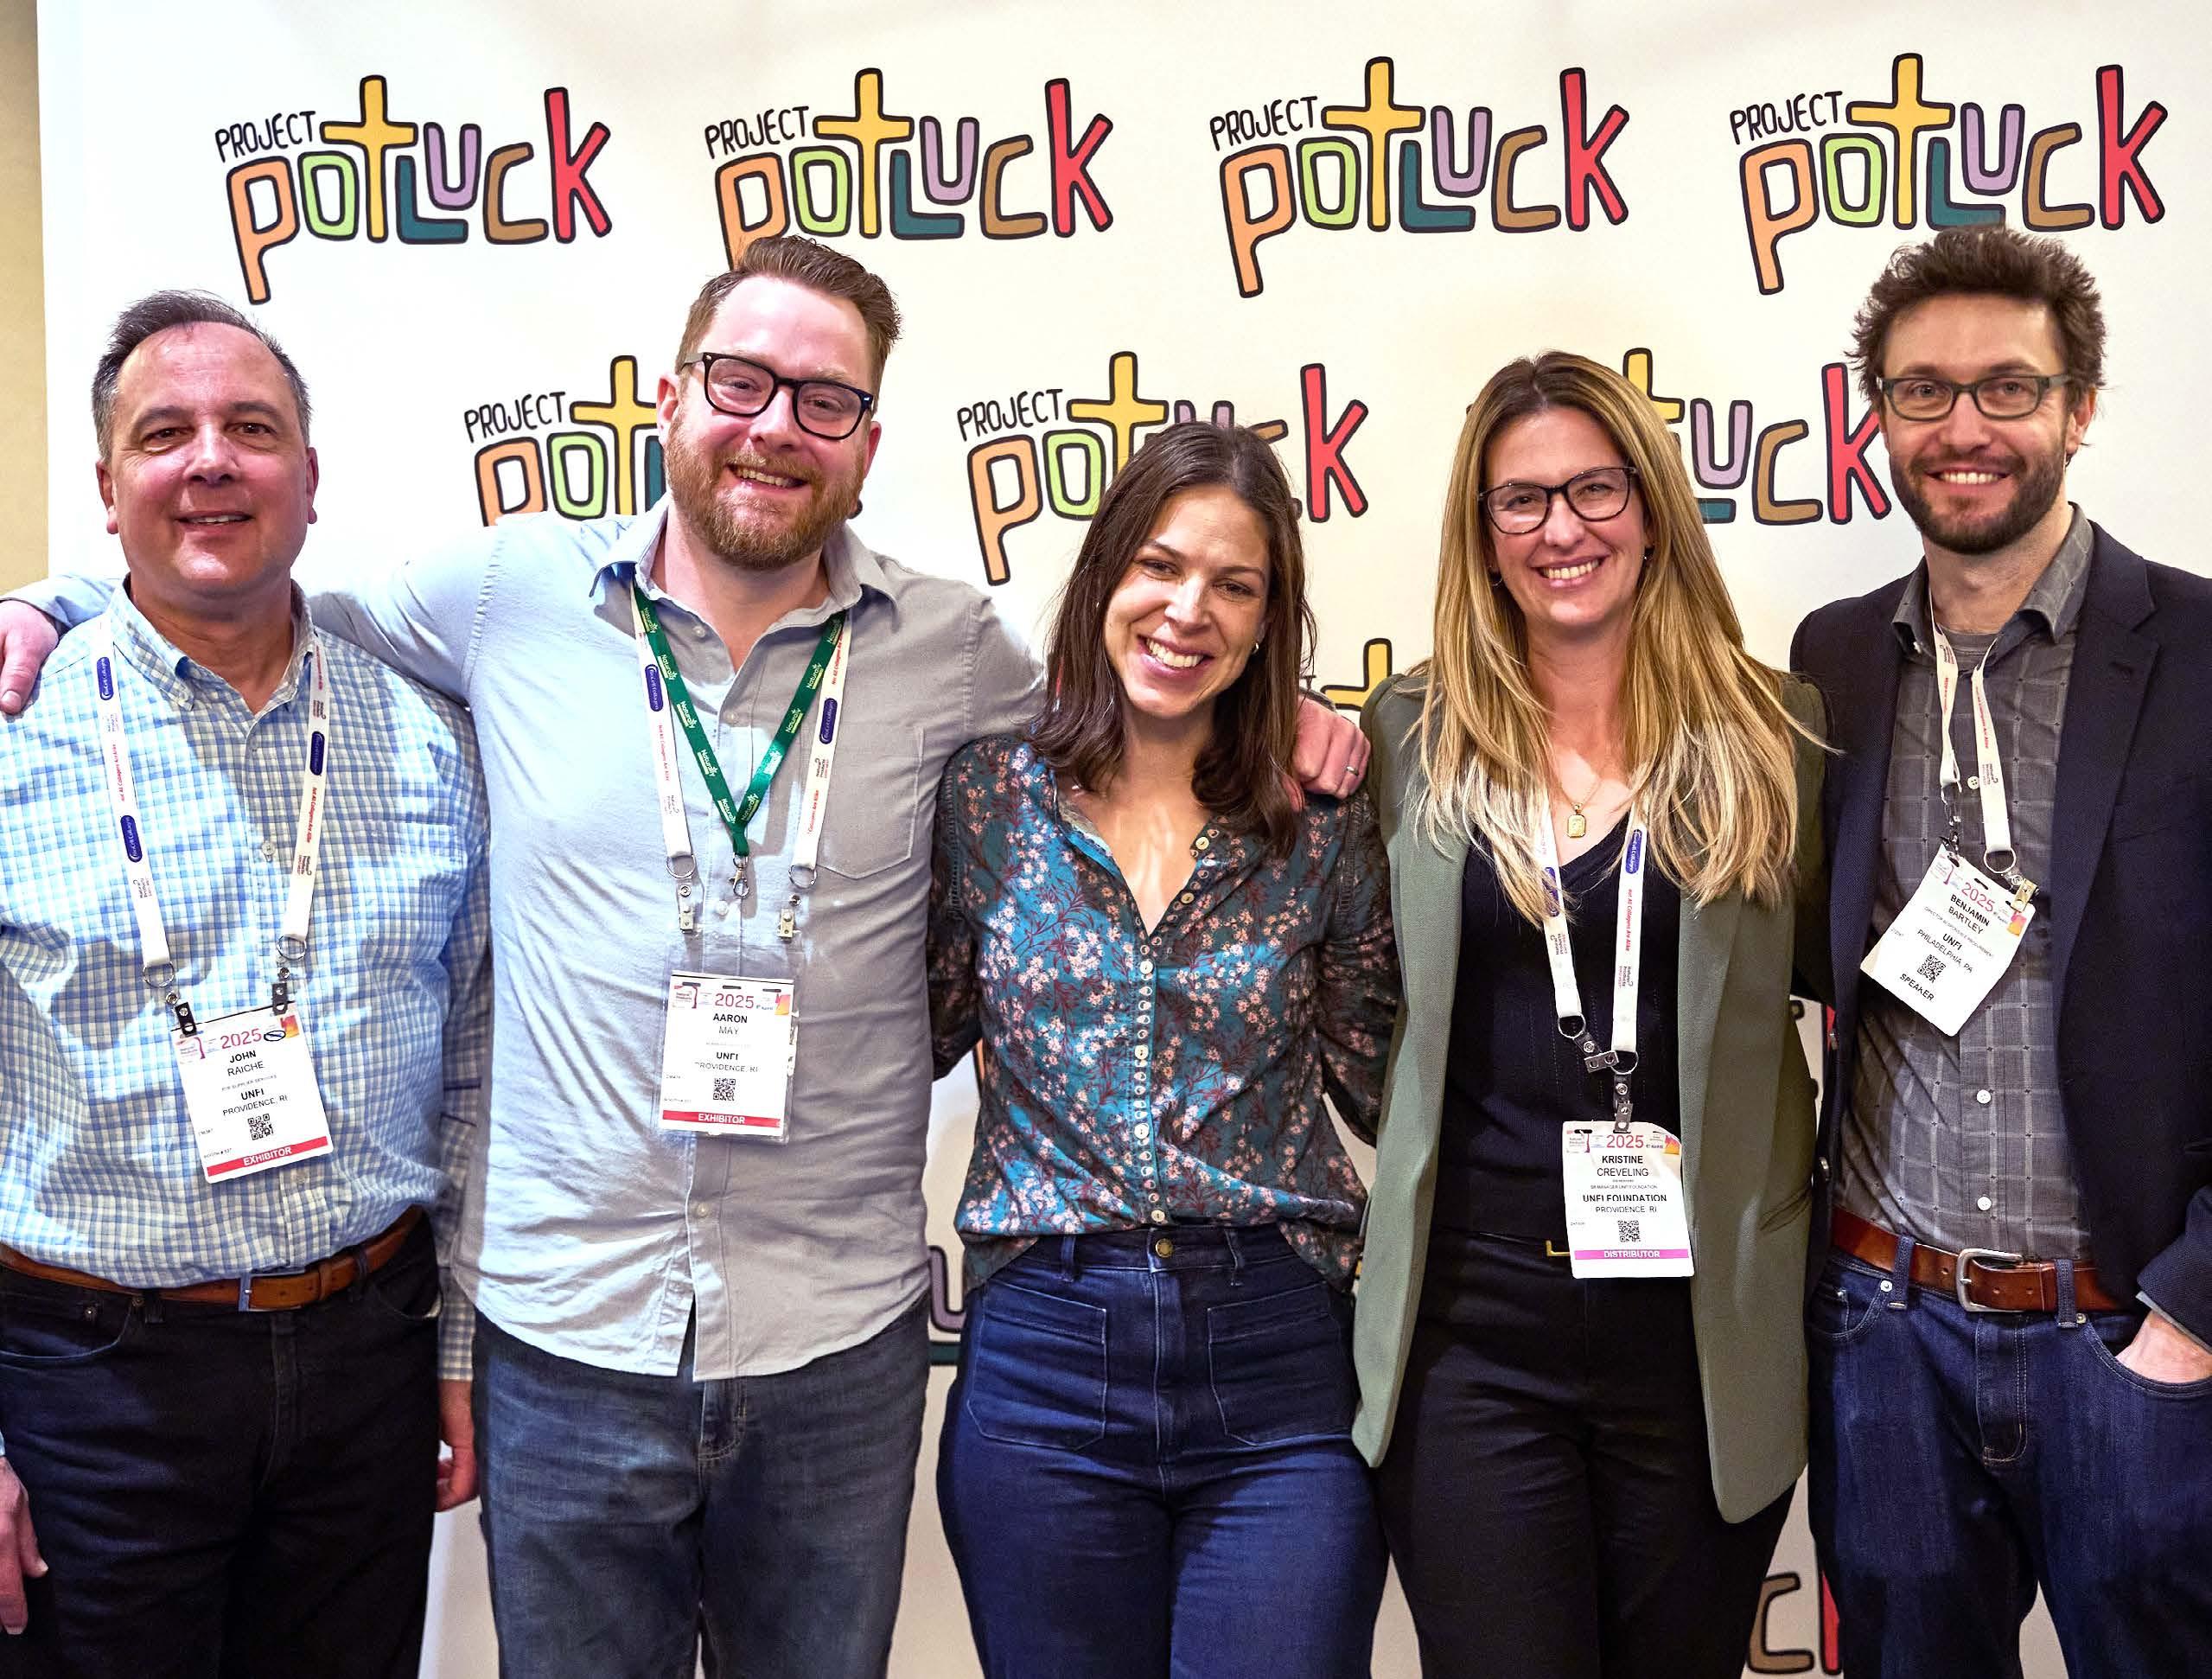
Project Potluck: Opening Doors for Food Entrepreneurs
Our partnership with Project Potluck demonstrates strategic grantmaking in action. As a UNFI Foundation grantee for two years, Project Potluck is working to build a more holistic food ecosystem by supporting over 1,600 underrepresented consumer packaged goods founders and professionals.
The partnership grew from our Supplier Services team's shared commitment to empowering these brands. Our UpNext team co-hosted educational webinars with Project Potluck, helping
participants gain critical business skills on retail partnerships, scaling and certifications.
This investment strengthens our role as an active partner in creating a more vibrant industry where retailers discover innovative products, communities gain jobs from local entrepreneurs, and our supply chain grows via an expanded supplier base.
Mentorship and Education: Supporting Emerging Brands
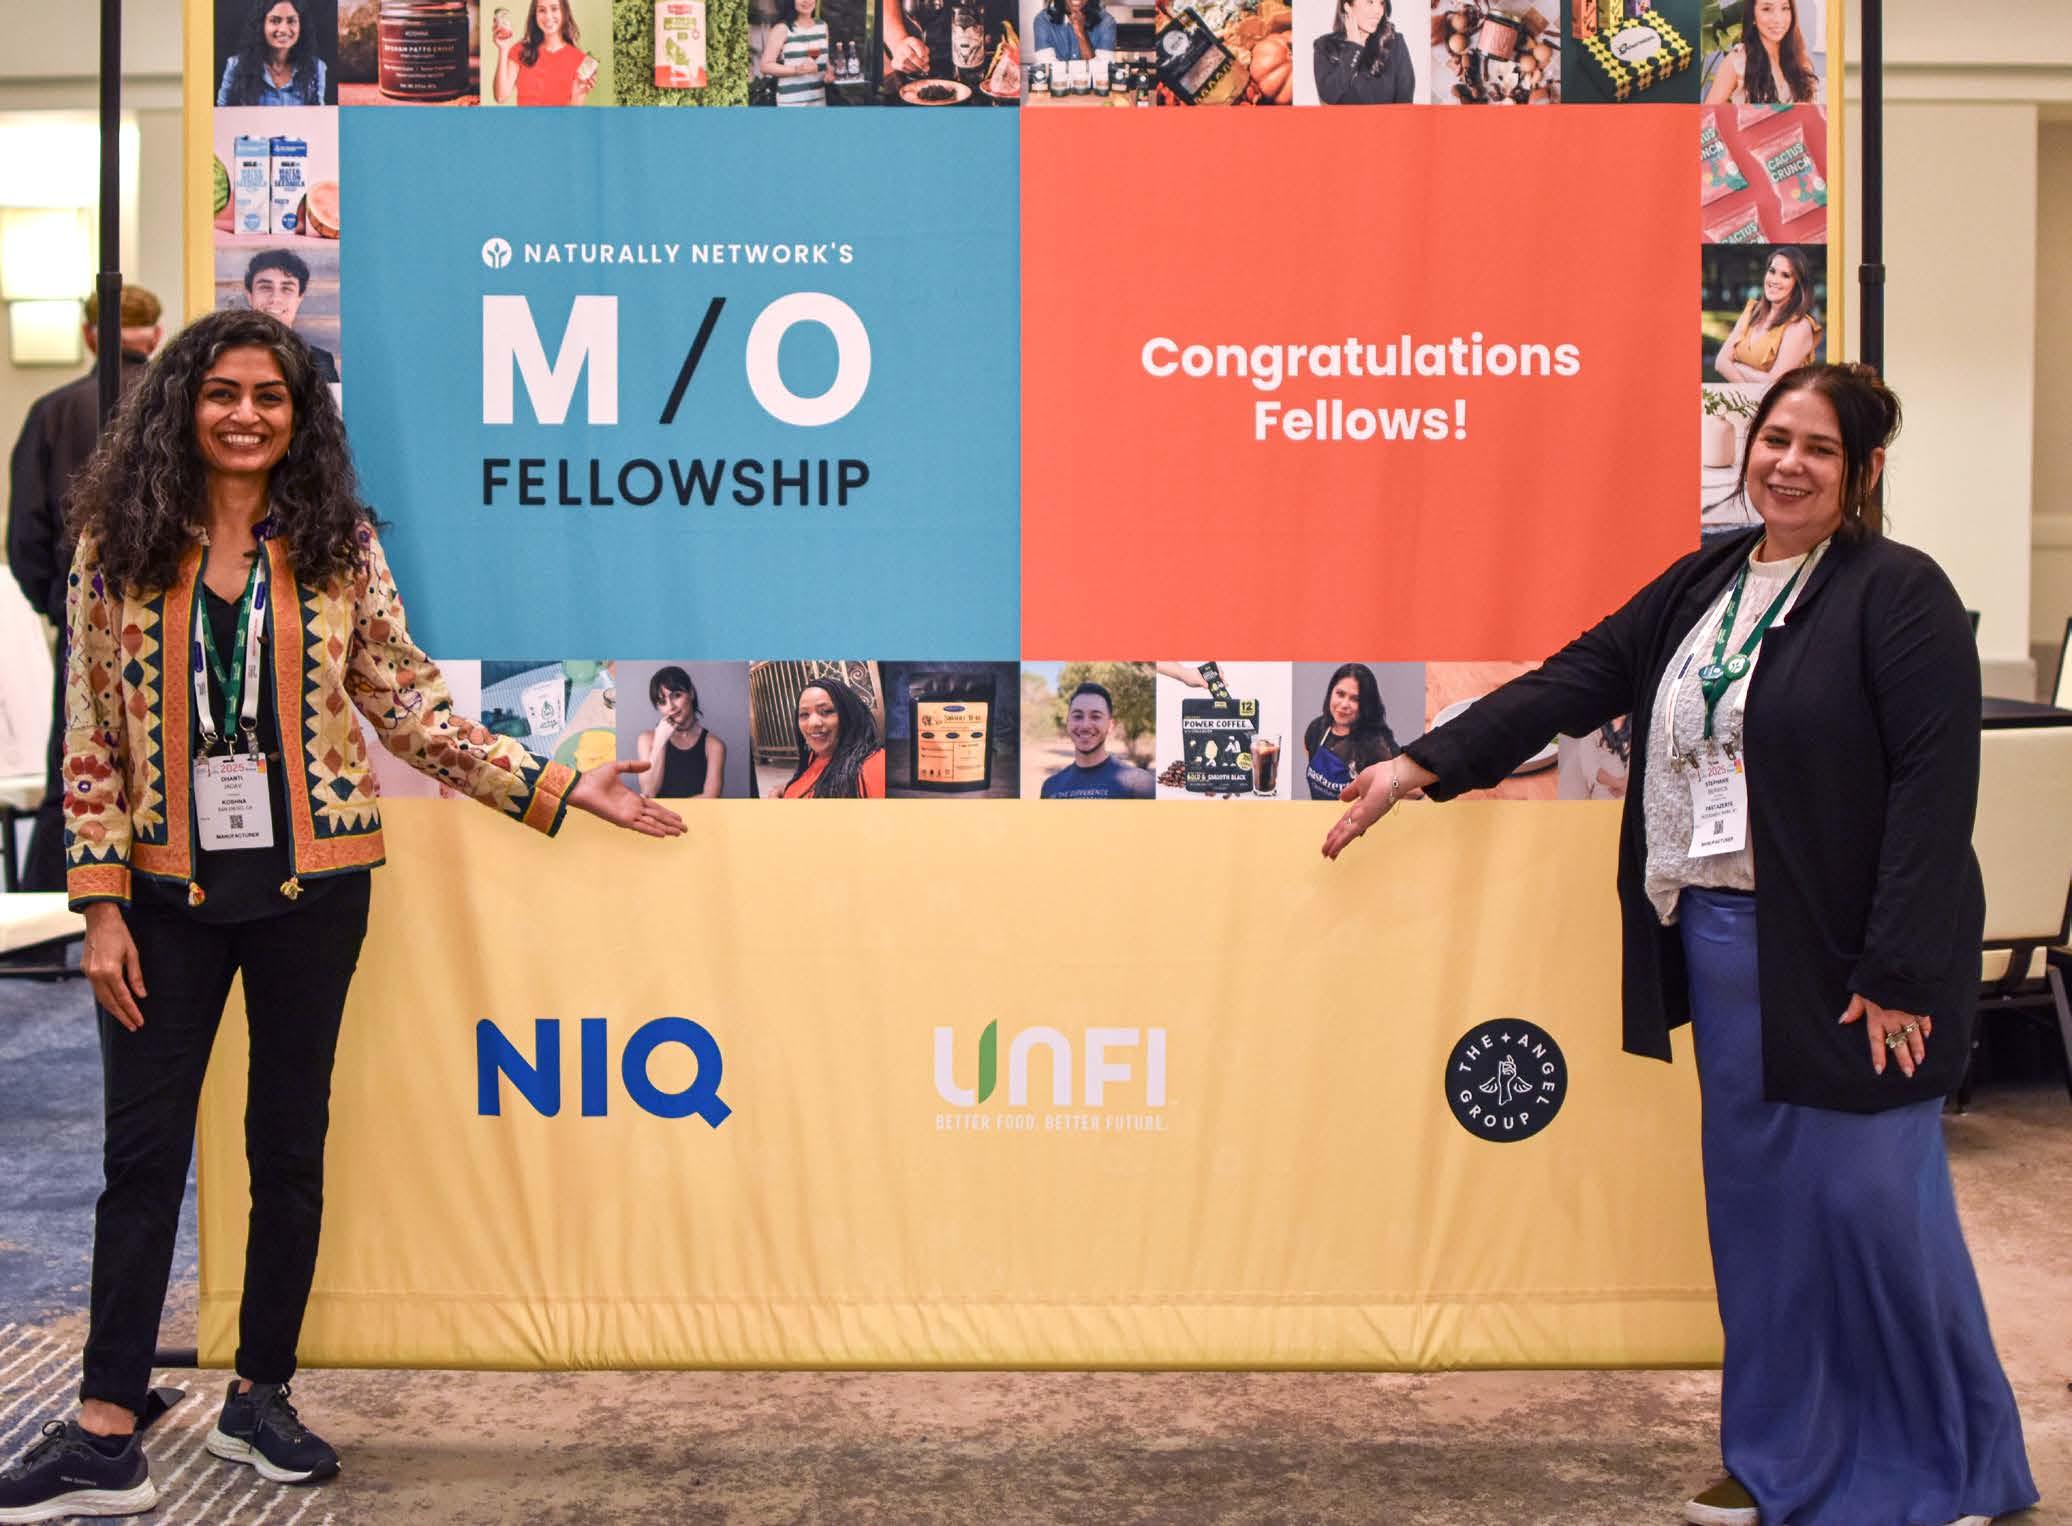
This year, our UpNext program partnered with Naturally Network, an organization that provides resources for consumer packaged goods companies and entrepreneurs, to support their MinorityOwned Fellowship, a 16-week program that provided essential business training to 16 small brands.
UNFI associates met monthly with the founders of these brands to share knowledge and build foundational skills for navigating and excelling in the natural and organic space. The partnership culminated in a series of impactful events at Natural Products Expo West, a major industry event, to celebrate progress and amplify their visibility within the broader food industry.
Climate Change Mitigation & Adaptation in Our Supply Chain
We are preparing our supply chain to adapt to the impacts of climate change while mitigating our impacts on the environment. We work with partners to reduce our Scope 3 GHG emissions while continuing to distribute quality product across the country.
We believe these efforts can reduce operating expenses and strengthen supplier relationships, driving long-term value creation and future-proofing our business.
Breaking down our approach:
• Data and Transparency: Providing suppliers with actionable reduction opportunities based on emission analysis.
• Supplier Collaboration: Connecting suppliers through our Climate Action Partnership (CAP) to share best practices and innovative approaches and to promote lower-carbon products.
• Assessing Risk: Bringing together crossfunctional expertise to systematically identify and manage climate-related risks.
4 Part of this increase is due to improved methodology; we plan to update our target base year to account for this.
5 Consistent with prior years, our GHG reporting is one year behind the Impact Report’s temporal boundaries; we are reporting on FY2024 GHG inventory in this report.
6 Scope 3 GHG emissions include all Scope 3 categories (excluding 8 and 10, which are not applicable to UNFI) for all business units (Broadline Conventional, Broadline Natural, UNFI Canada, Tony's Fine Foods, Alberts/Fresh, UNFI Retail, UNFI International, Brands+).
7 See GRI Content 2-4 “Restatements of Information” for how this compares to prior year.
Current Progress: 22,767,423 metric tons CO2e (a 24% increase since Fiscal Year 2020 baseline).4,5
Reduce absolute Scope 3
GHG emissions from purchased goods and services by 25% by the end of Fiscal Year 2030.6
Our greatest climate impact comes from the products we buy and sell, which are the majority of our Scope 3 GHG emissions. This year, we saw an increase in Scope 3 GHG emissions, primarily driven by an overall increase in business volume. To help reduce these emissions, we have partnered with a sustainability insights provider to identify “emissions hotspots” in our supply chain.
These insights will help us better understand which products are more emissive and identify opportunities to reduce their impact. We plan to use these insights to conduct targeted engagement with strategic suppliers, including tailored recommendations to inform their emissions reduction efforts.
This will also allow us to spotlight lower carbon products from CAP suppliers based on their emissions reduction initiatives. Through this strategy, we believe we can help turn climate challenges into competitive advantages. This year, we are also restating our Fiscal Year 2023 Scope 3 GHG emissions using this enhanced methodology and plan to update our target base year for better progress tracking. We are excited by the opportunity to create meaningful, data-driven change that these enhanced capabilities provide us.
CLIMATE ACTION
PARTNER
92 UNFI suppliers are part of the CAP, representing 13% of UNFI's purchased goods
57% of Fiscal Year 2024 Scope 3, Category 1 emissions are FLAG emissions (Forest, Land and Agriculture)7 11% of Fiscal Year 2024 Scope 3, Category 1 emissions (purchased goods and services) accounted for by CAP suppliers
25,875,909 metric tons CO2e total Fiscal Year 2024 Scope 3 GHG emissions, which is a 5% increase from the prior year
Climate
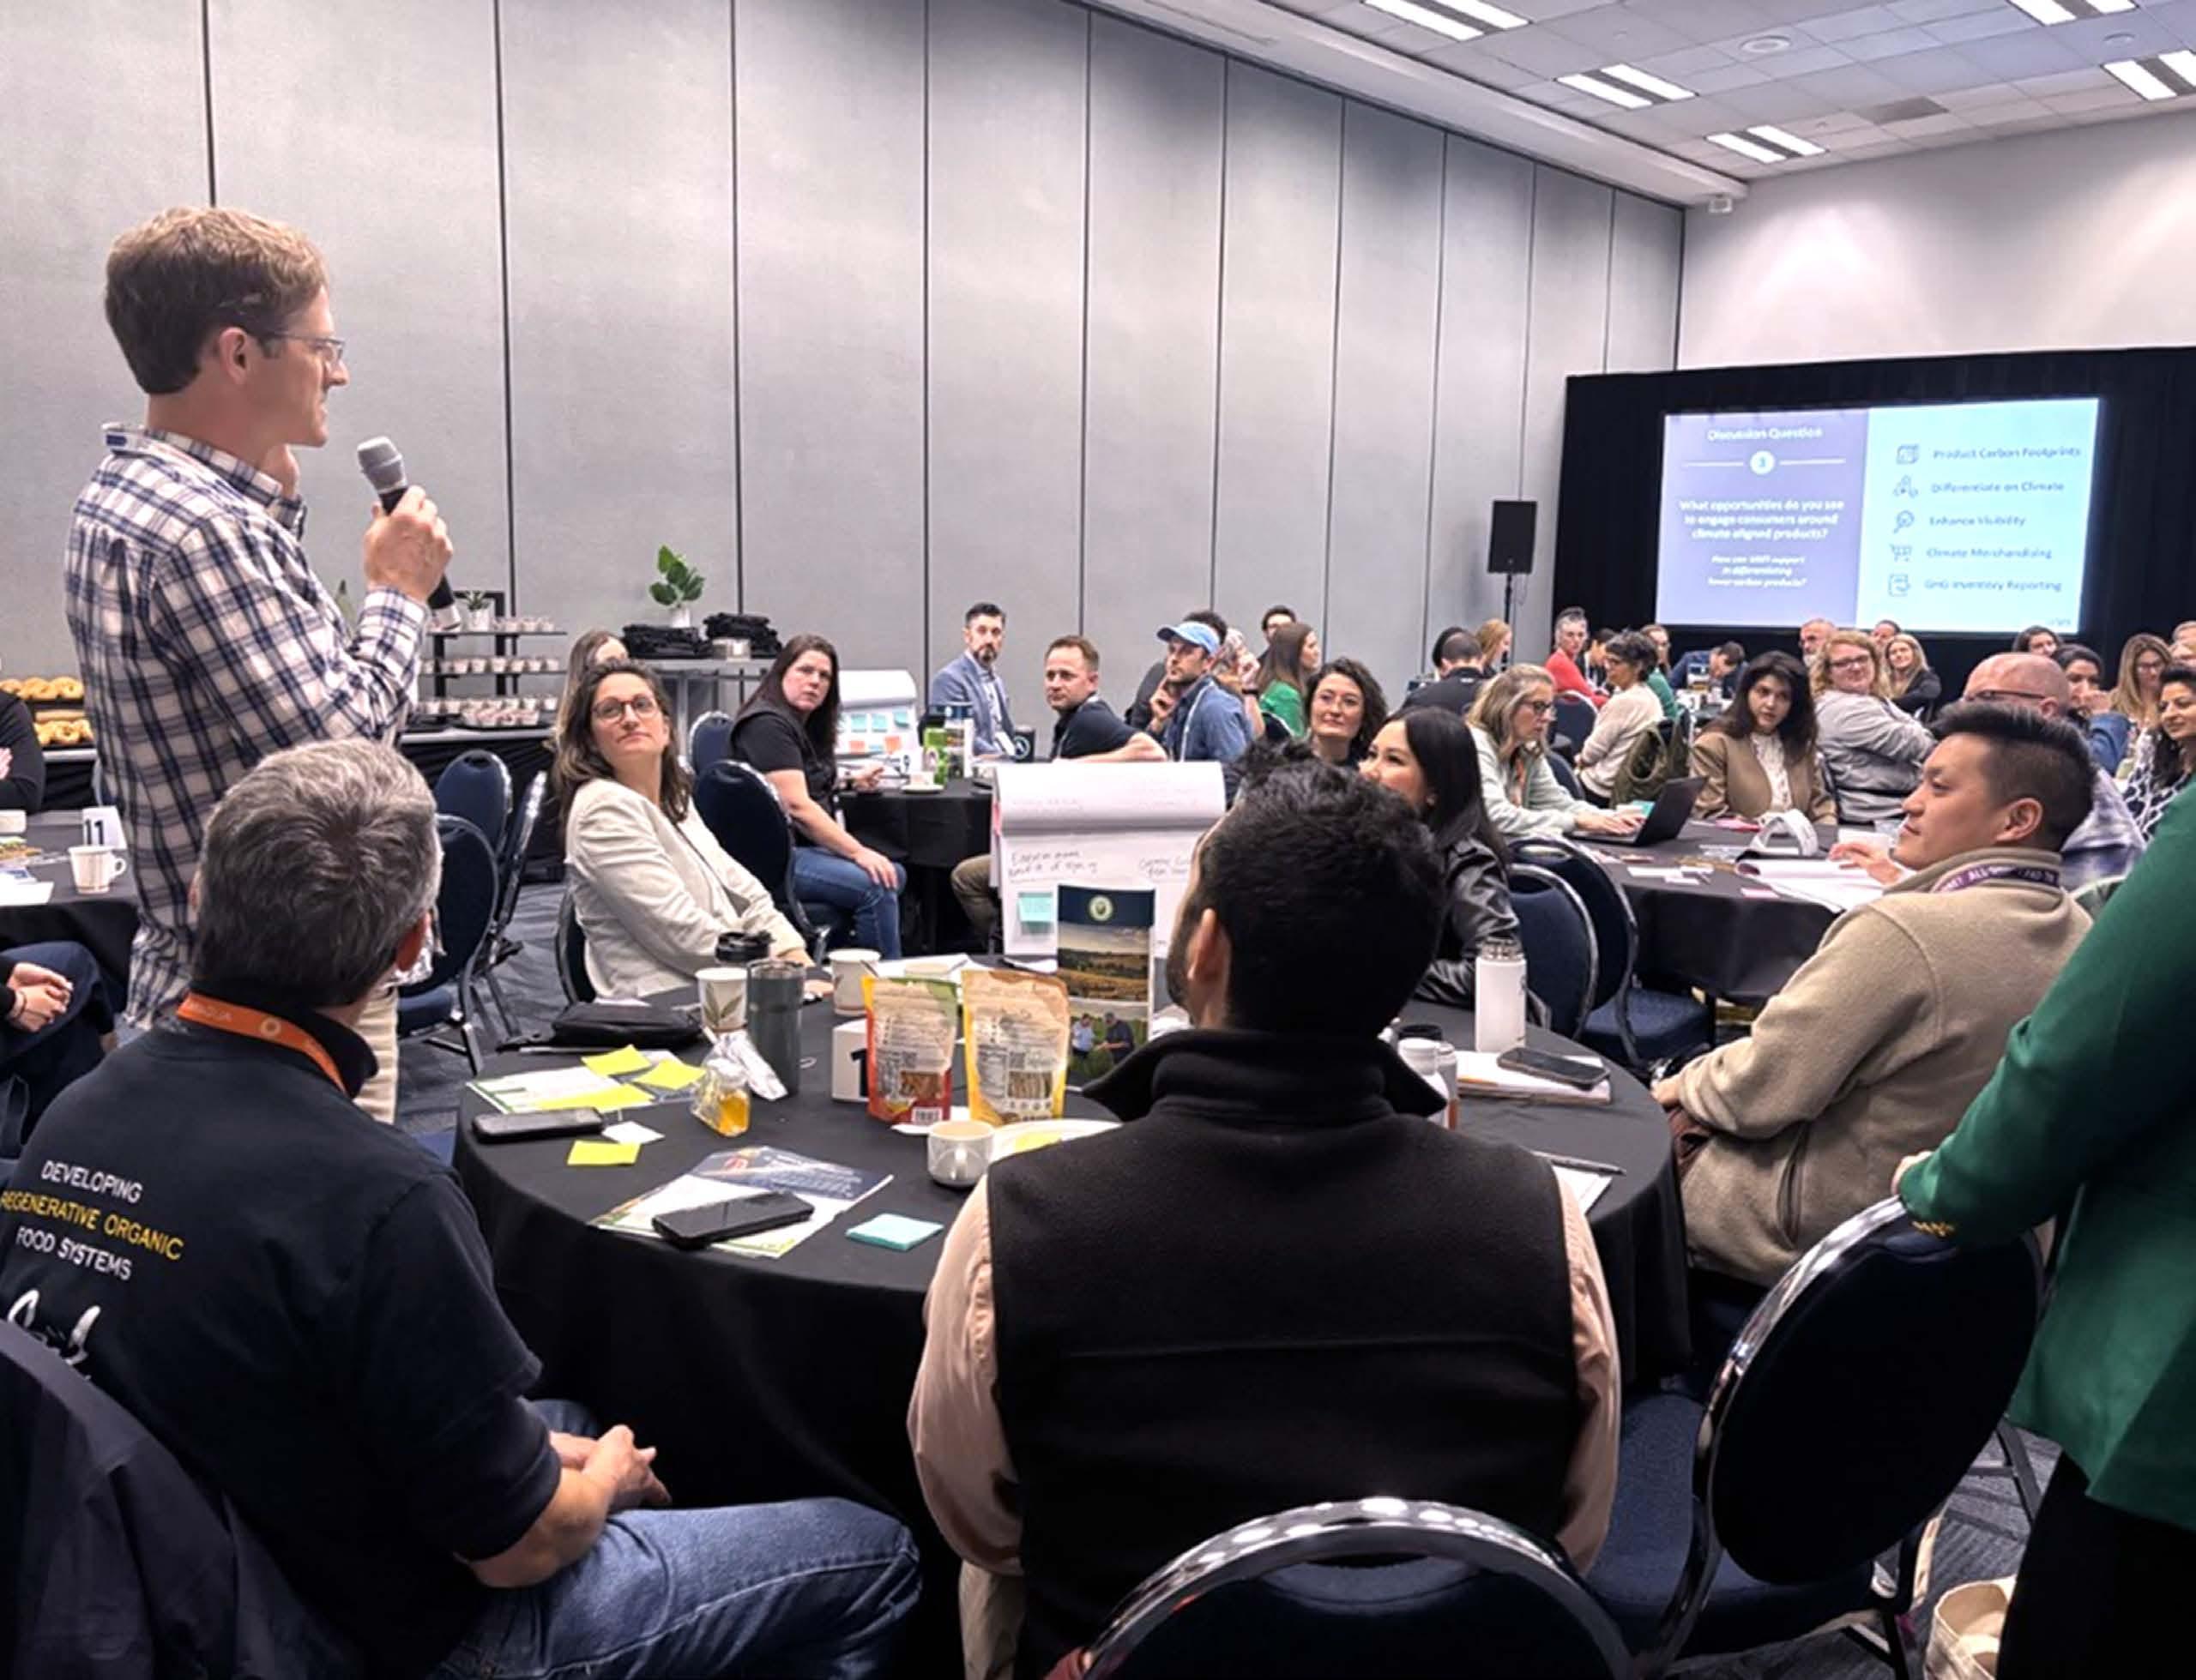
Convening for Collective Action
This year, at our inaugural Climate Summit at Natural Products Expo West, we brought 50 supplier and retailer partners together to transform climate targets into actionable collaboration. Whole Foods Market and Ahold Delhaize USA demonstrated how responsible sourcing can drive sustainability and commercial success.
Participants provided valuable input to enhance our Climate Action Partnership, including insights to improve our recognition programs and streamline data sharing. We believe that climate leadership can translate into market access by highlighting suppliers and products with lower emissions.
By facilitating programs like the Climate Action Partnership, we can bring together valuesaligned suppliers and retailers to exchange ideas, increase the availability of lower carbon products, and grow our collective impact.
Summit:
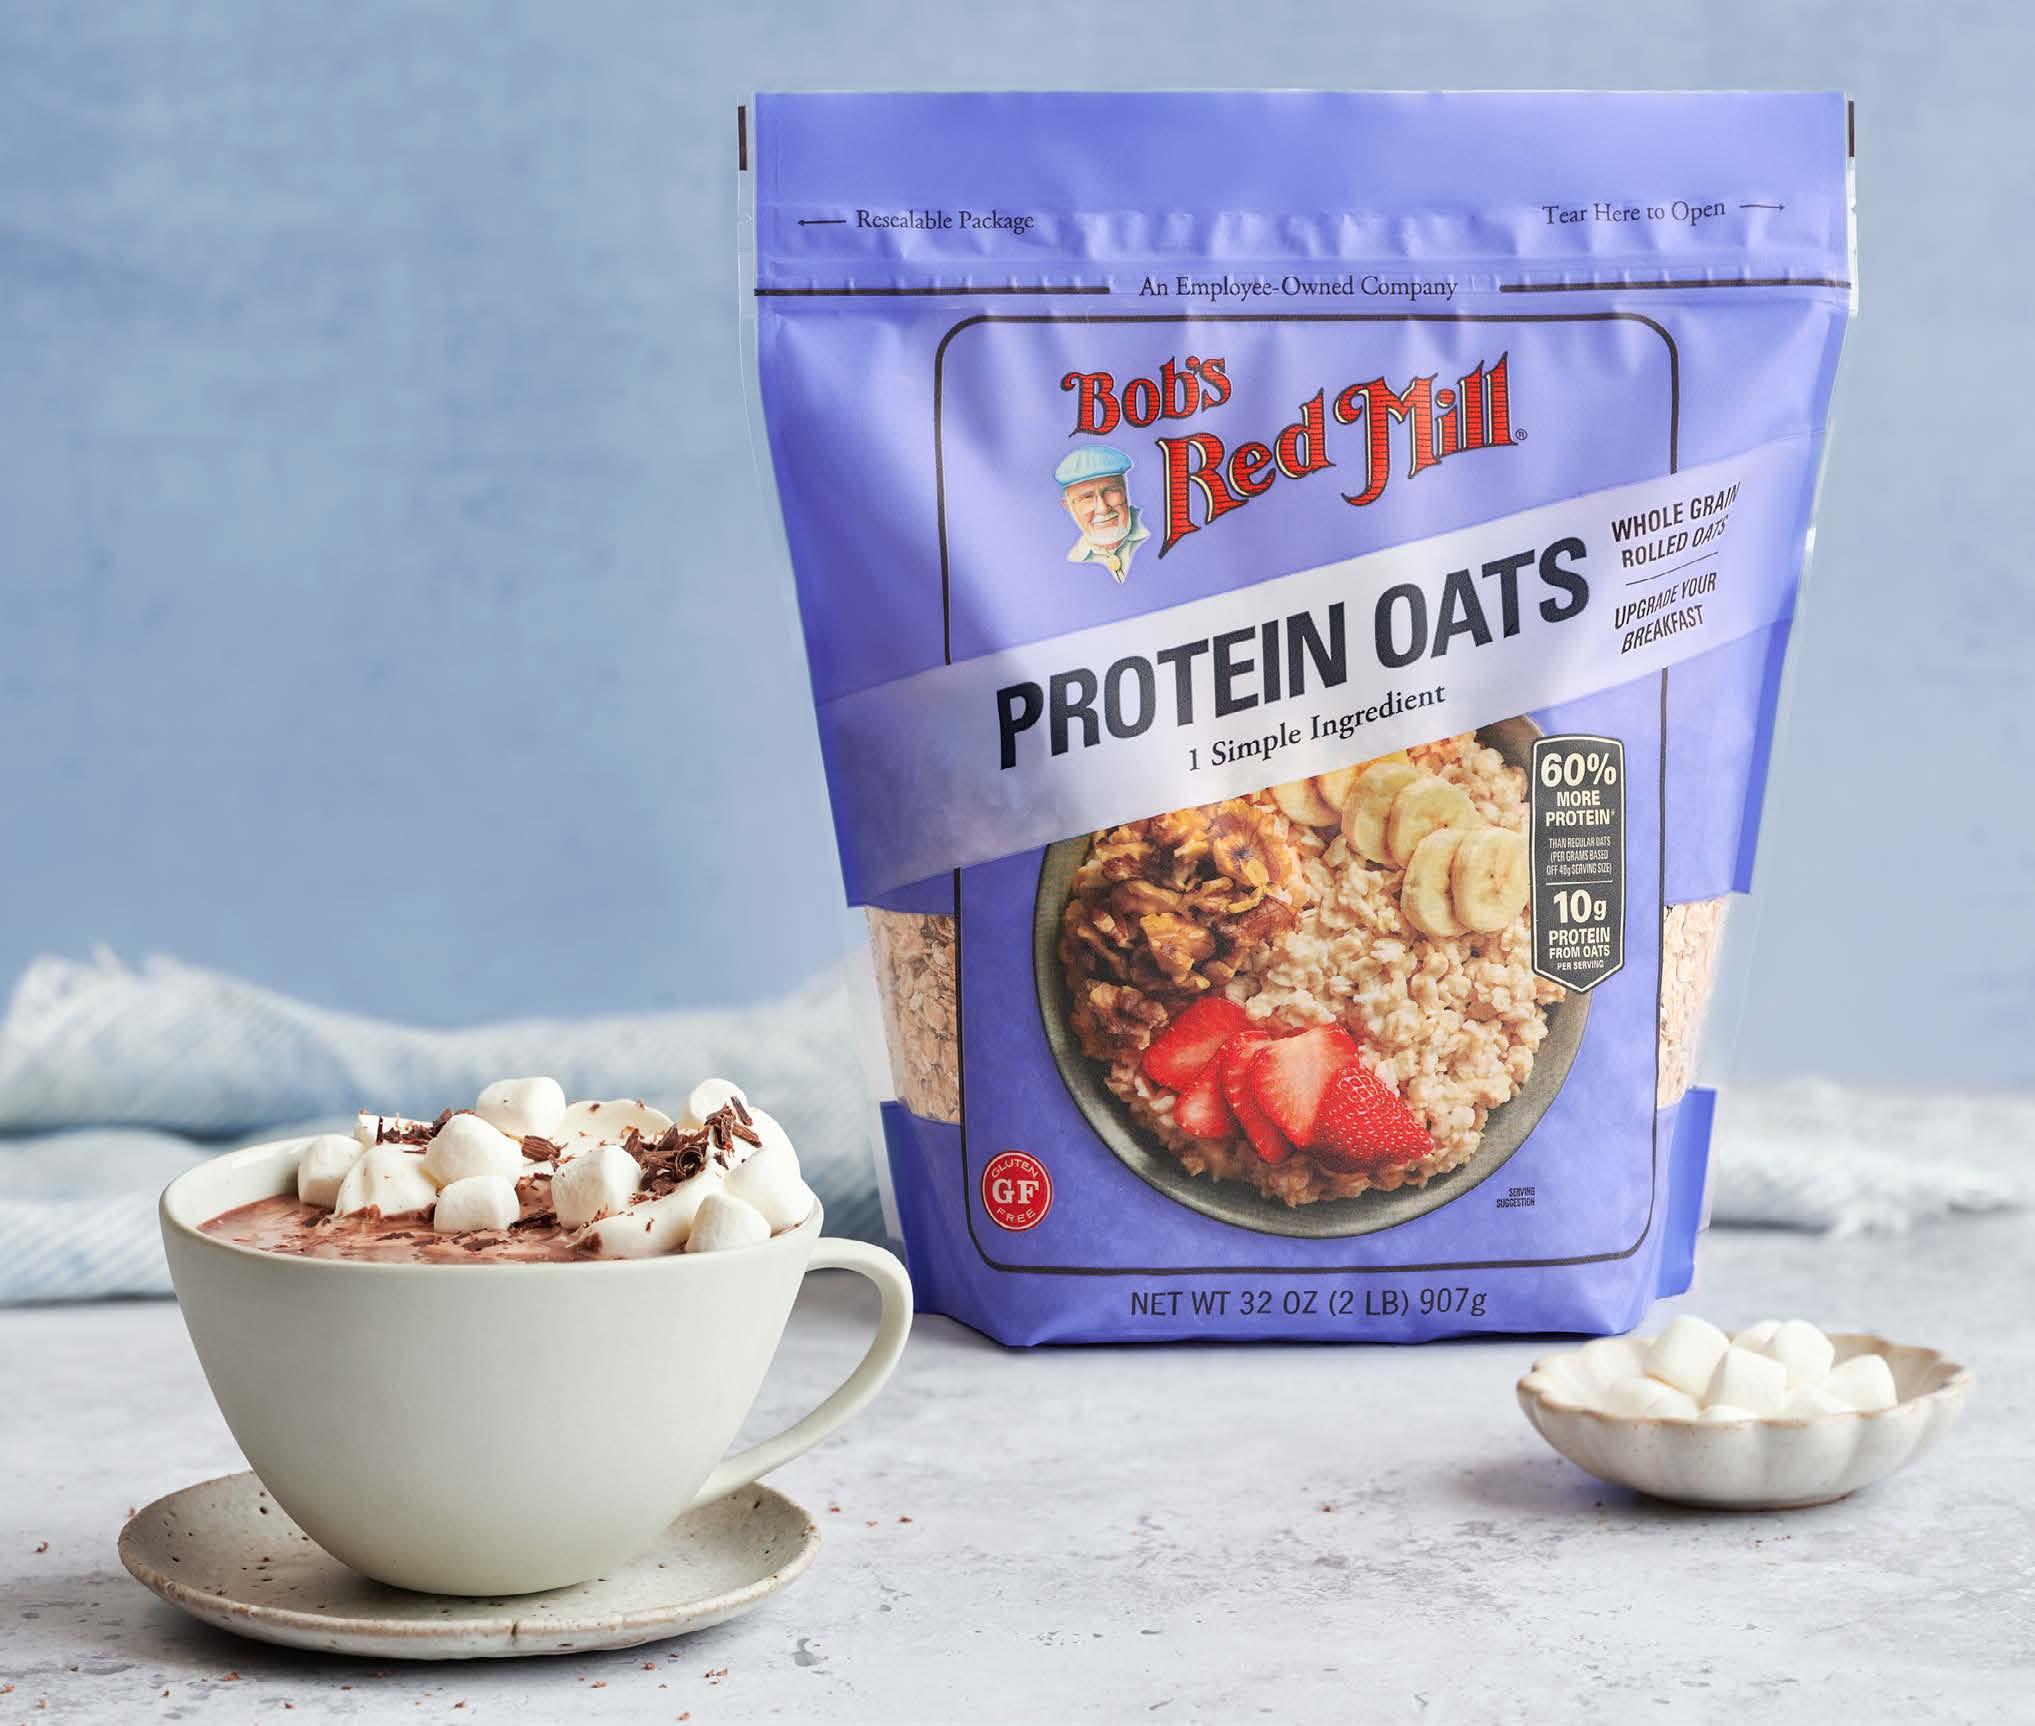
Bob's Red Mill
Product Carbon Footprints: Turning Data into Differentiation
This year, we piloted an offering that included product-level carbon footprint analyses with a group of Climate Action Partnership suppliers, revealing emission hotspots from ingredients to packaging. Suppliers demonstrating category leadership will receive free marketing support and product features from UNFI. The pilot aims to drive commercial differentiation, rewarding GHG emissions reduction with increased visibility and sales.
Note: We plan to submit a FLAG target to the Science-Based Targets initiative (SBTi), along with proposed updates to our existing targets.
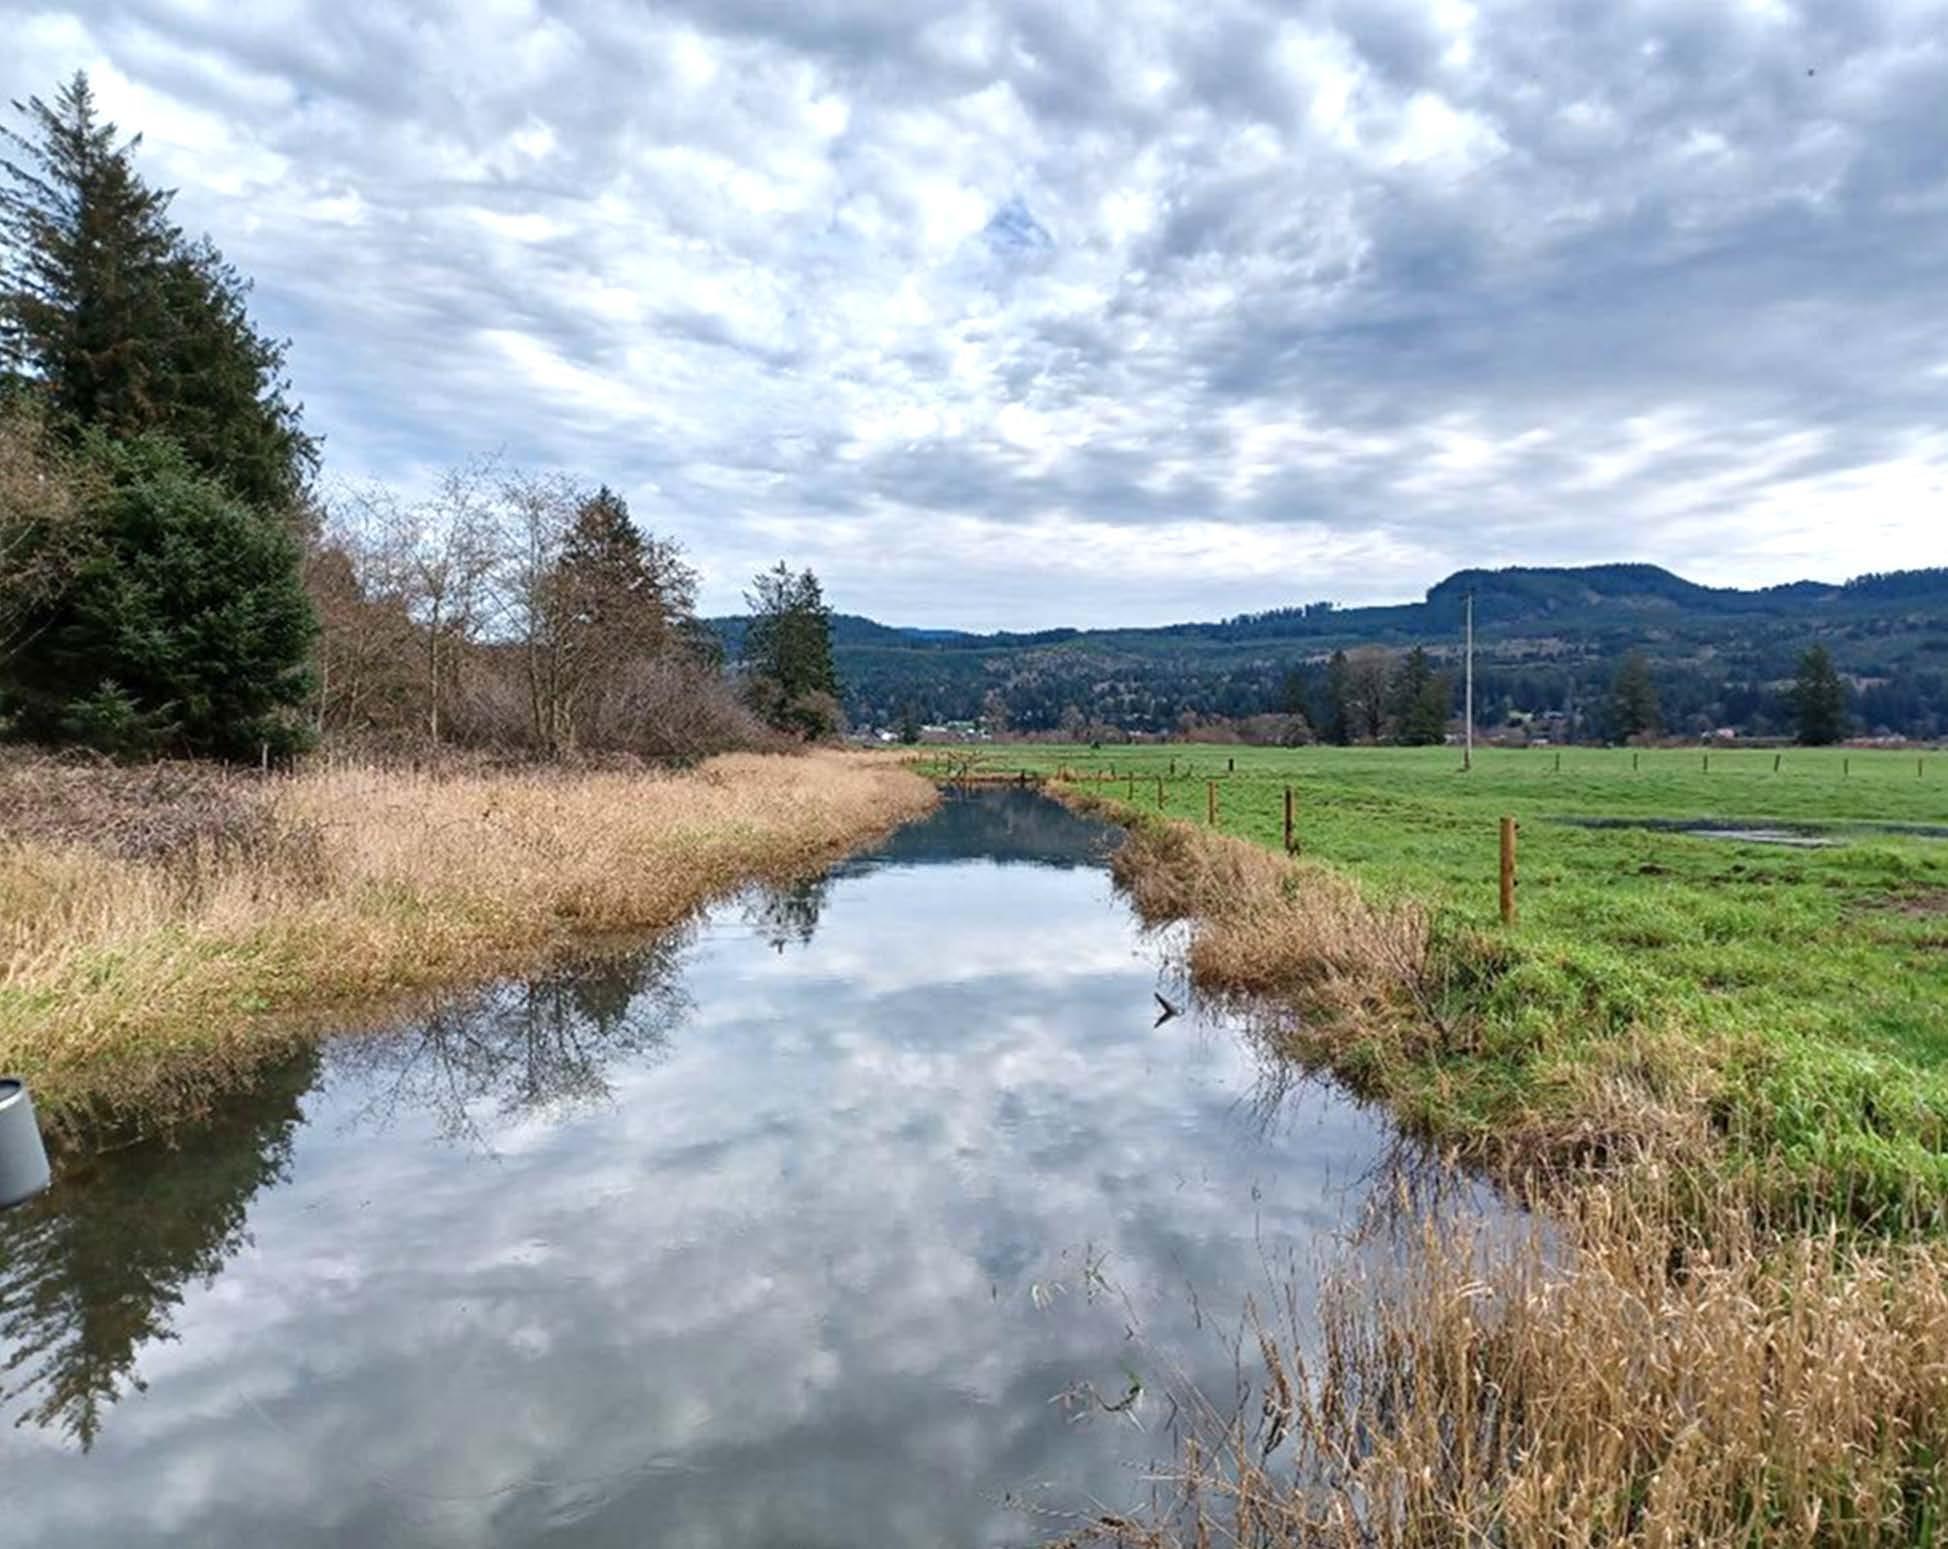
Nature & Ecosystem Health
We are working to protect the agricultural lands and marine environments our business depends on. By striving for no-deforestation in our supply chain and promoting responsible water use and production practices, we aim to reduce operational risks from resource degradation and scarcity. This also helps us create differentiated product offerings for our customers.
Breaking down our approach:
• Ensure Regulatory Compliance: Upholding environmental regulations that protect ecosystems and water resources from operational impacts.
• Strengthen Sourcing Stability: Building supply chain viability through sustainable sourcing requirements and product diversification.
• Support No-Deforestation: Reducing deforestation from palm oil and beef through certification requirements and supplier standards.
• Support Regenerative Transitions: Providing funding and technical assistance to help farmers adopt practices that enhance ecosystem health.
This year, we increased procurement from sustainable suppliers to drive responsible production practices and expanded support for farmers transitioning to regenerative practices through UNFI Foundation grantmaking and impact investments.
In addition to supporting our partners, we aim to uphold our commitment to nature and ecosystem health through our owned brands’ product portfolio, ensuring eligible products maintain the appropriate aquaculture and forestry certifications, including Marine Stewardship Council (MSC), Best Aquaculture Practices (BAP), Forest Stewardship Council (FSC), Sustainable Forestry Initiative (SFI), and Roundtable on Sustainable Palm Oil (RSPO).
BEHIND: EXTENDING GOAL DEADLINE
Current Progress: 96% of eligible UNFI-owned brands contain RSPO-certified palm oil.
Achieve 100% RSPO-certified palm oil for all UNFI-owned brands products containing palm oil by the end of 2027.8
RSPO certification offers assurance on the sustainability of palm oil production. We have converted approximately 96% of our owned brand products containing palm oil to RSPO-certified palm oil—275 out of 287 items, up from 92% last year. While we are proud of the progress we have made, we are committed to reaching 100%. We have a strong action plan in place with our supply chain partners to convert the remaining items by the end of 2027. As a result, we have extended the goal deadline by two years—from 2025 to 2027—and will continue to report on our progress.
~20% of UNFI owned brands SKUs are certified USDA Organic11 KEY METRICS
~76% of eggs sold from cage-free, free range, or pasture-raised environments9
~23% of pork sold from gestation crate-free systems10
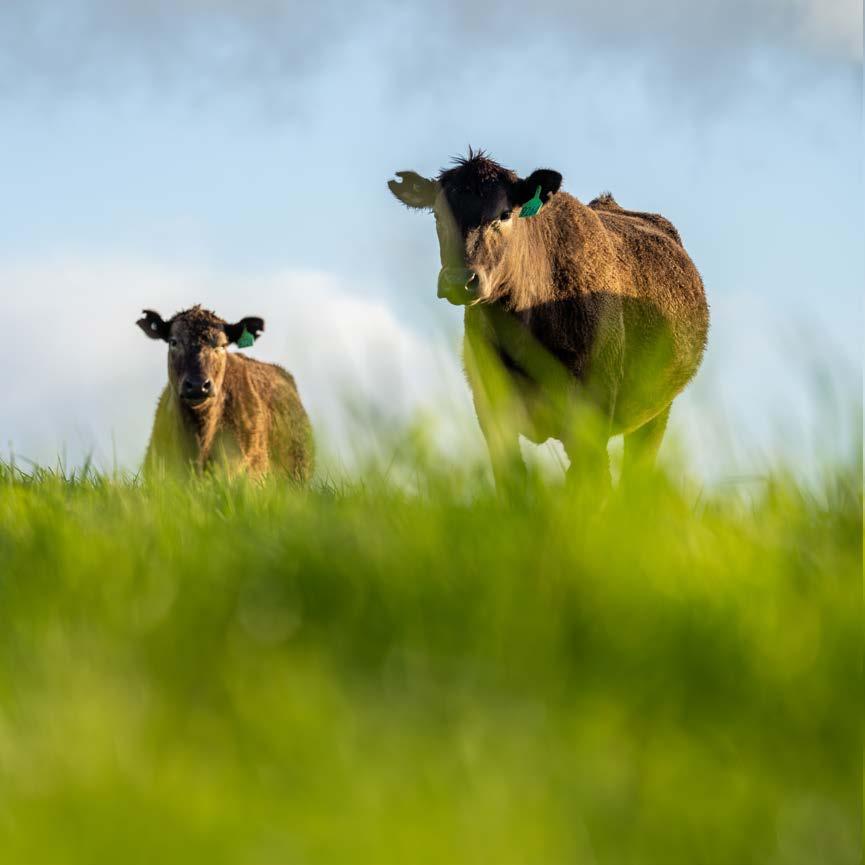
Progress on Our No-Deforestation Policy
This year, we strengthened our engagement with beef and palm suppliers to better understand their compliance with UNFI’s deforestation policy.
This included:
• Collecting supplier attestations of policy alignment
• Tracking voluntary public disclosures of supplier compliance rates
These efforts enabled us to establish baseline compliance rates:
• 64% by sales volume for fresh or frozen beef, muscle cuts and ground beef
• 58% by sales for products containing palm oil and select derivatives
While these figures reflect meaningful commitment on behalf of our suppliers, we know that achieving full compliance across diverse and complex supply chains will take continued effort.
We plan to update our policy to reflect these developments and the need for continuous improvement. We believe that through ongoing engagement and valuesaligned procurement, we can drive further improvement. Notably, all suppliers of UNFIowned brand beef products are compliant with our deforestation policy.
To continue advancing towards full compliance across our broader assortment, UNFI plans to:
• Deepen supplier engagement to support adoption of deforestation-free practices
• Align with customers to amplify our shared expectations and market demand for deforestation-free products
• Coordinate with UNFI sales teams to better spotlight compliant suppliers
ACHIEVED
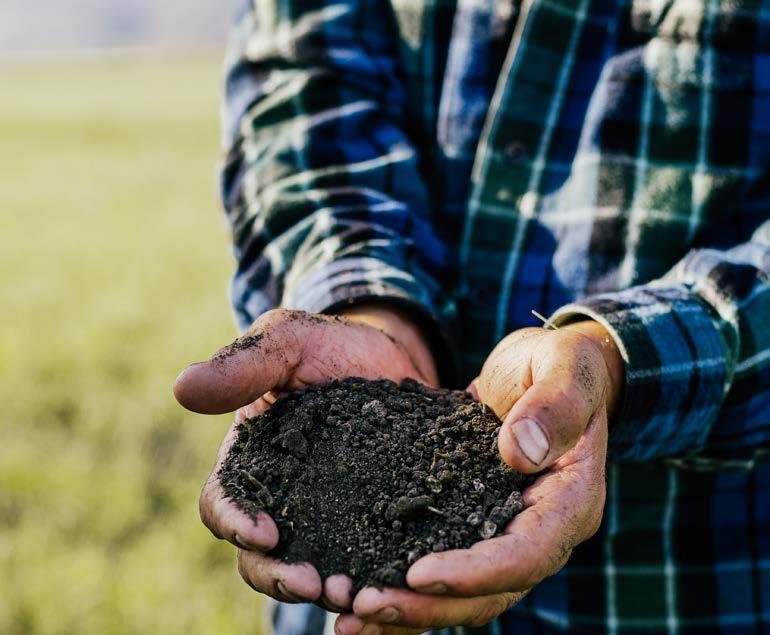
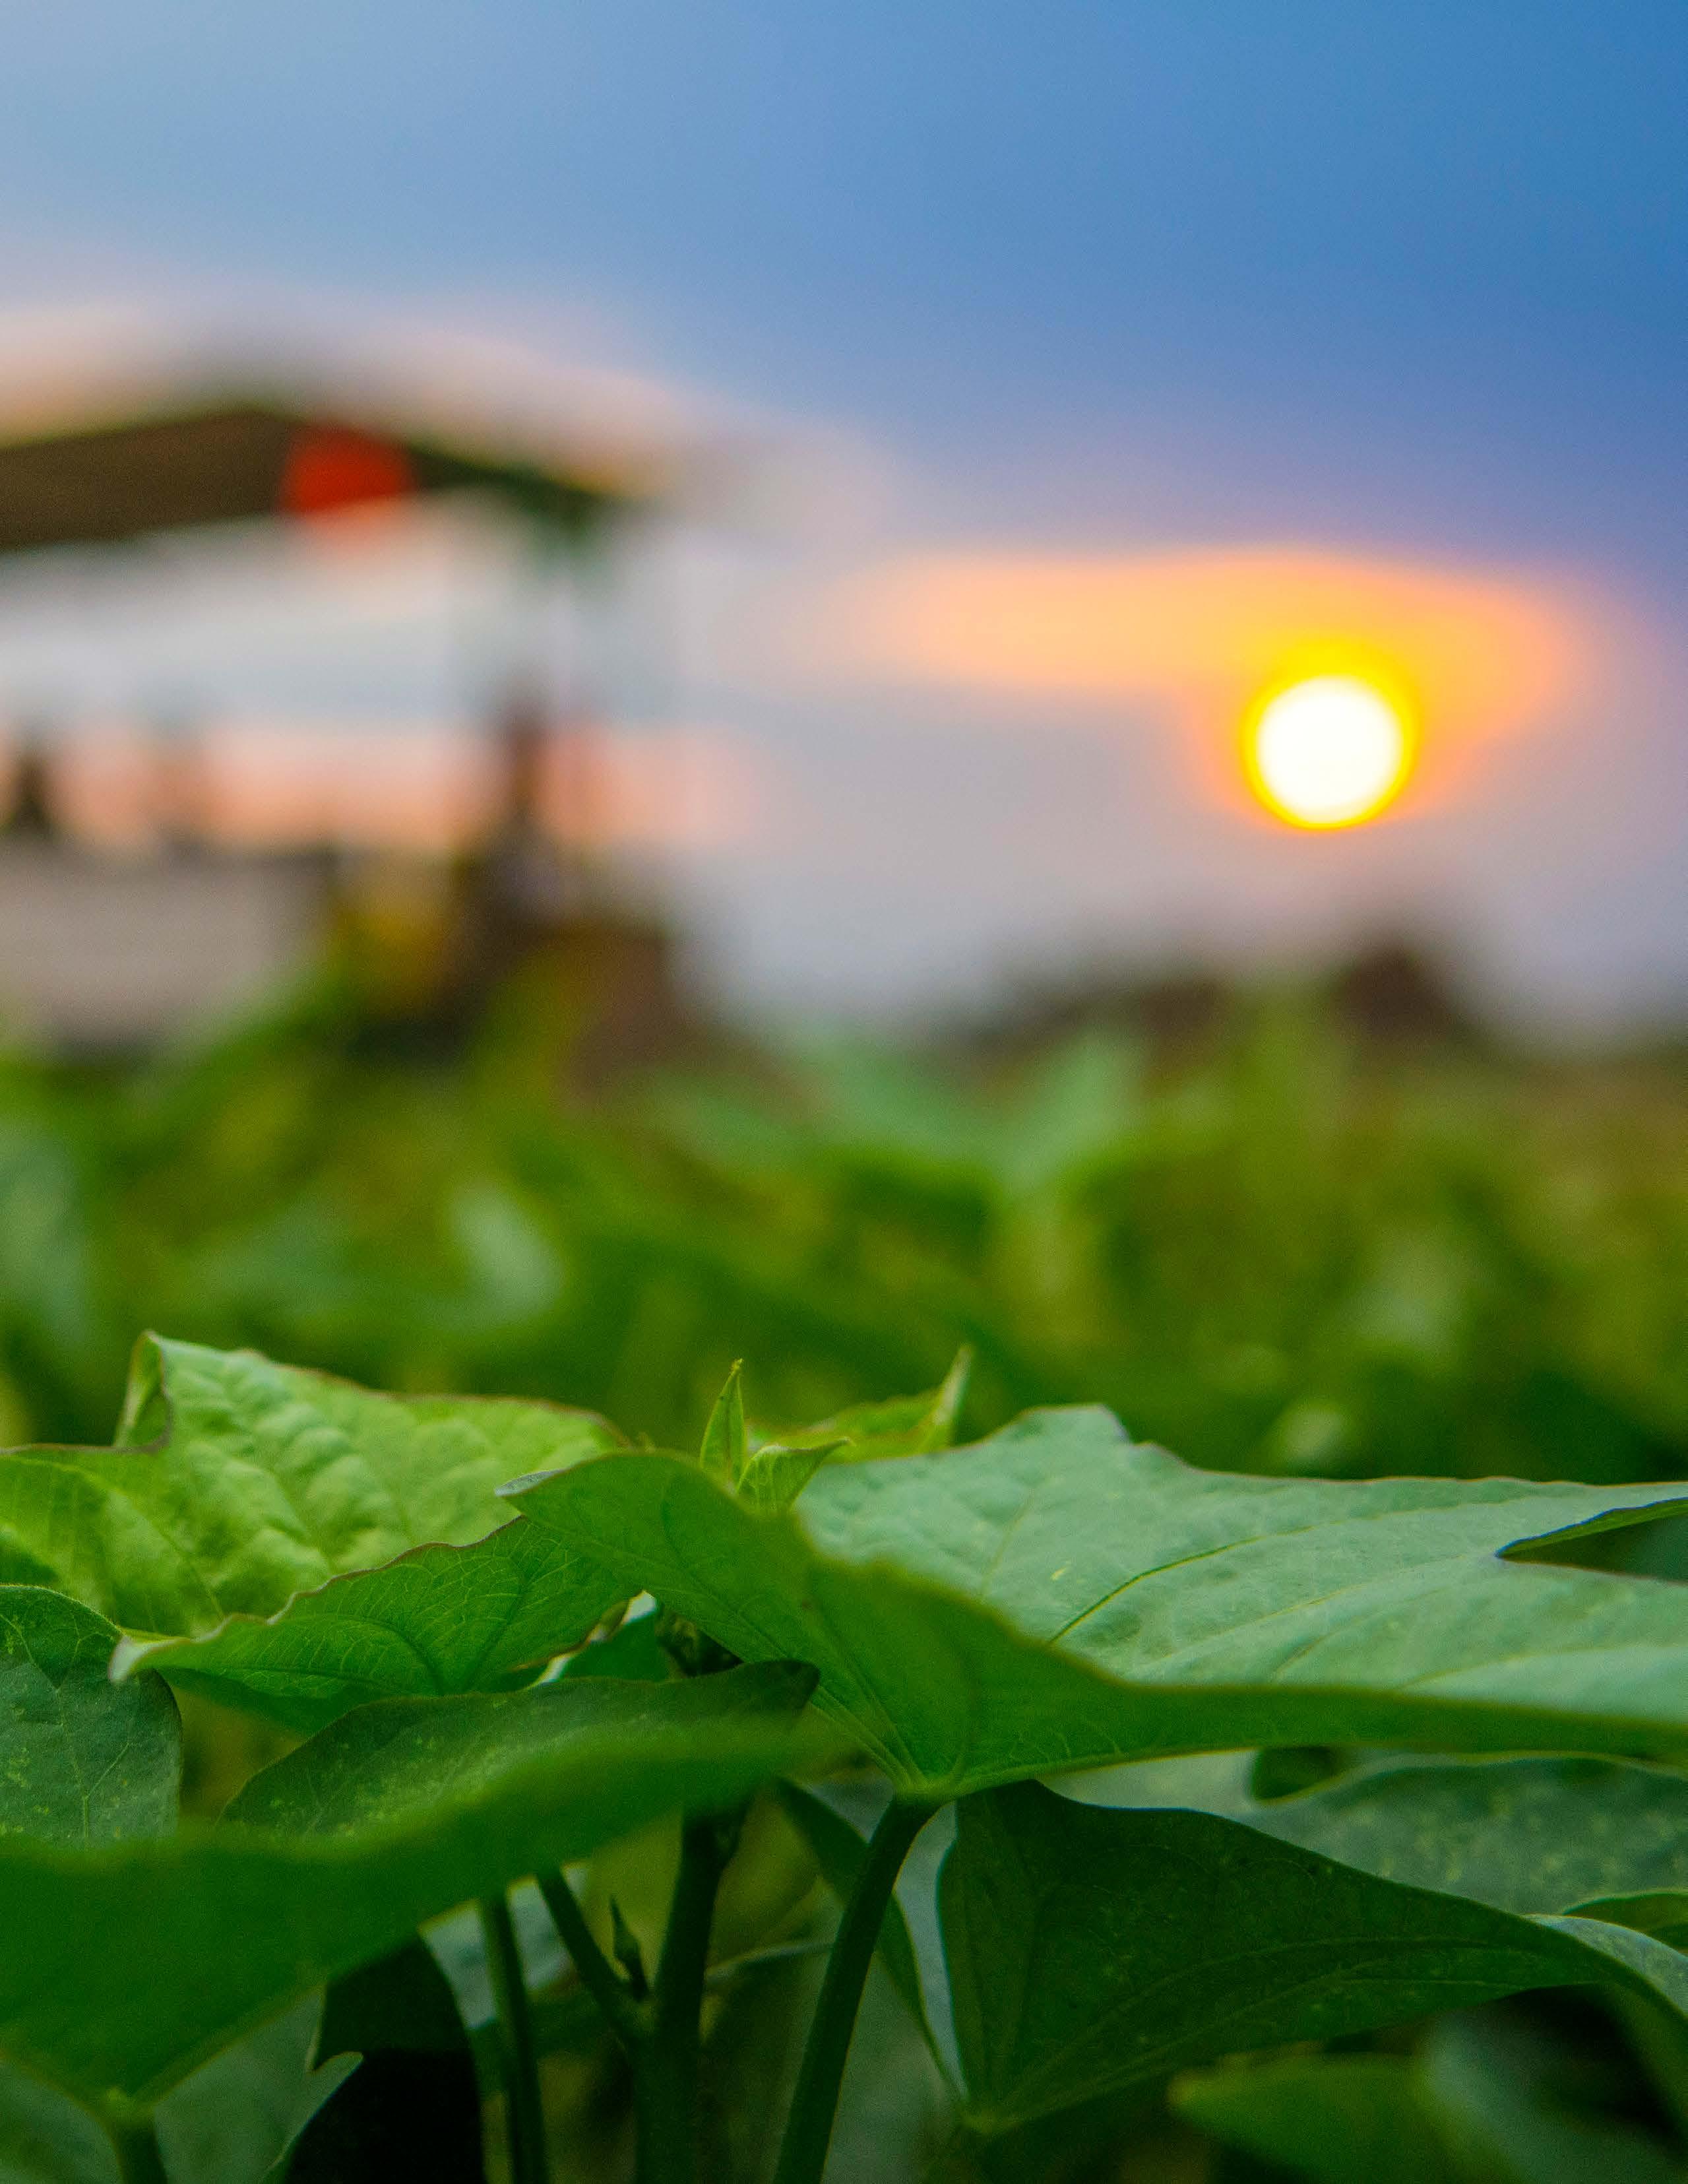
Current Progress: 1.4 million acres since 2020.
Promote soil health through regenerative and organic practices on one million acres by 2030.
We surpassed our goal of supporting soil health on one million acres of farmland through regenerative and organic practices five years ahead of our 2030 target. This milestone was possible through UNFI Foundation grants, impact investments, and strategic procurement. These efforts supported farmers in adopting practices that build healthier soil, enhance resilience, and improve land productivity.
This year, UNFI Foundation funding for regenerative and organic agriculture supported climate-smart practices on almost double the amount of acreage compared to the prior year. At the same time, our partnership with a new sustainability insights provider allowed us to better understand the acreage supported by our organic purchases.
This enabled us to revise our Fiscal Year 2024 acreage numbers that resulted from procurement efforts while giving us greater visibility into how our buying decisions contribute to soil health and help farmers differentiate in the market.
Given the importance of regenerative and organic practices to long-term food system sustainability, we are exploring a next-generation goal that captures this impact within the broader context of nature and ecosystem health. This evolution will be informed by relevant frameworks, stakeholder input and initiatives with aligned partners.
KEY METRICS
1.4M acres supported through regenerative and organic practices since 2020
483,640 certified organic acres that resulted from our core business activities (procurement) in Fiscal Year 202412
48,270 of certified organic acres supported through the UNFI Foundation’s impact investments in Fiscal Year 202513
429,420 of certified organic and regenerative acres supported through UNFI Foundation grantees in Fiscal Year 2025
Top photo courtesy of Liz Birnbaum at the Curated Feast
Creating Wildlife Corridors Across American Farmland:
Joining together with supply chain partners, UNFI and the UNFI Foundation are proud to support the Wilding Pilot Program led by Mad Agriculture and Whole Foods Market. Over the next three years this project will restore over 1,000 acres of marginal cropland into climate-resilient habitats that can restore biodiversity, improve soil and water health, and strengthen the long-term resilience of the food system.
Trusted Advisor Partnership: Scaling Expertise for Soil Health
The UNFI Foundation is proud to support this initiative led by Sustainable Food Lab in partnership with the Red River Basin Commission, North Dakota crop consultants, and other values-aligned UNFI suppliers. This initiative, which started in 2022 and has scaled to reach more than 33 Certified Crop Advisors (CCAs) in North Dakota and the Red River Basin (ND, MN, SD), aims to amplify the adoption of profitable and regenerative stewardship practices by farmers in the Northern Plains.
The effort equips independent CCAs, the trusted experts that farmers rely on for planting and management decisions, with the soil health knowledge, practical tools, peer network, and access to finance necessary for implementing sustainable farming methods. This project, designed and delivered by CCAs, illustrates how investing in technical support through a trusted expert can provide more farmers with the confidence and knowledge to successfully integrate regenerative farming practices, maximizing our impact and doubling down on efforts to protect farmland.
Restore Northwest:
Collective Investment in Regional Agriculture
The UNFI Foundation joined Zero Foodprint (ZFP) and New Seasons Market to bring regenerative agriculture grants to Pacific Northwest farmers. Building on ZFP’s success with similar projects in California and Colorado—providing $3.1 million to support 170 farms while sequestering 130,000 metric tons of CO2e—we're helping to expand these practices to more farmers and regions. Through this program, farmers receive grants to support projects like cover cropping and composting that rebuild soil health.
The UNFI Foundation support came alongside New Seasons Market’s 1% Building Better Soil Earth Month campaign, which connected consumer purchases from many UNFI suppliers to fund these climate-smart practices, showing how retailers, distributors, suppliers, and farmers can work together.
Top photo courtesy of Zero Foodprint / Tillamook County Creamery
Focus Area:
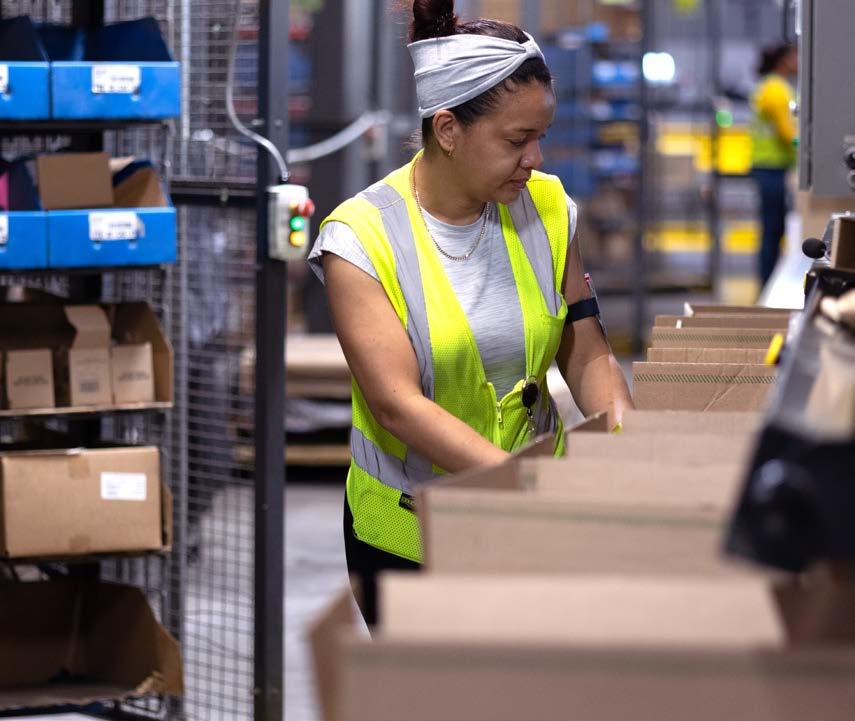
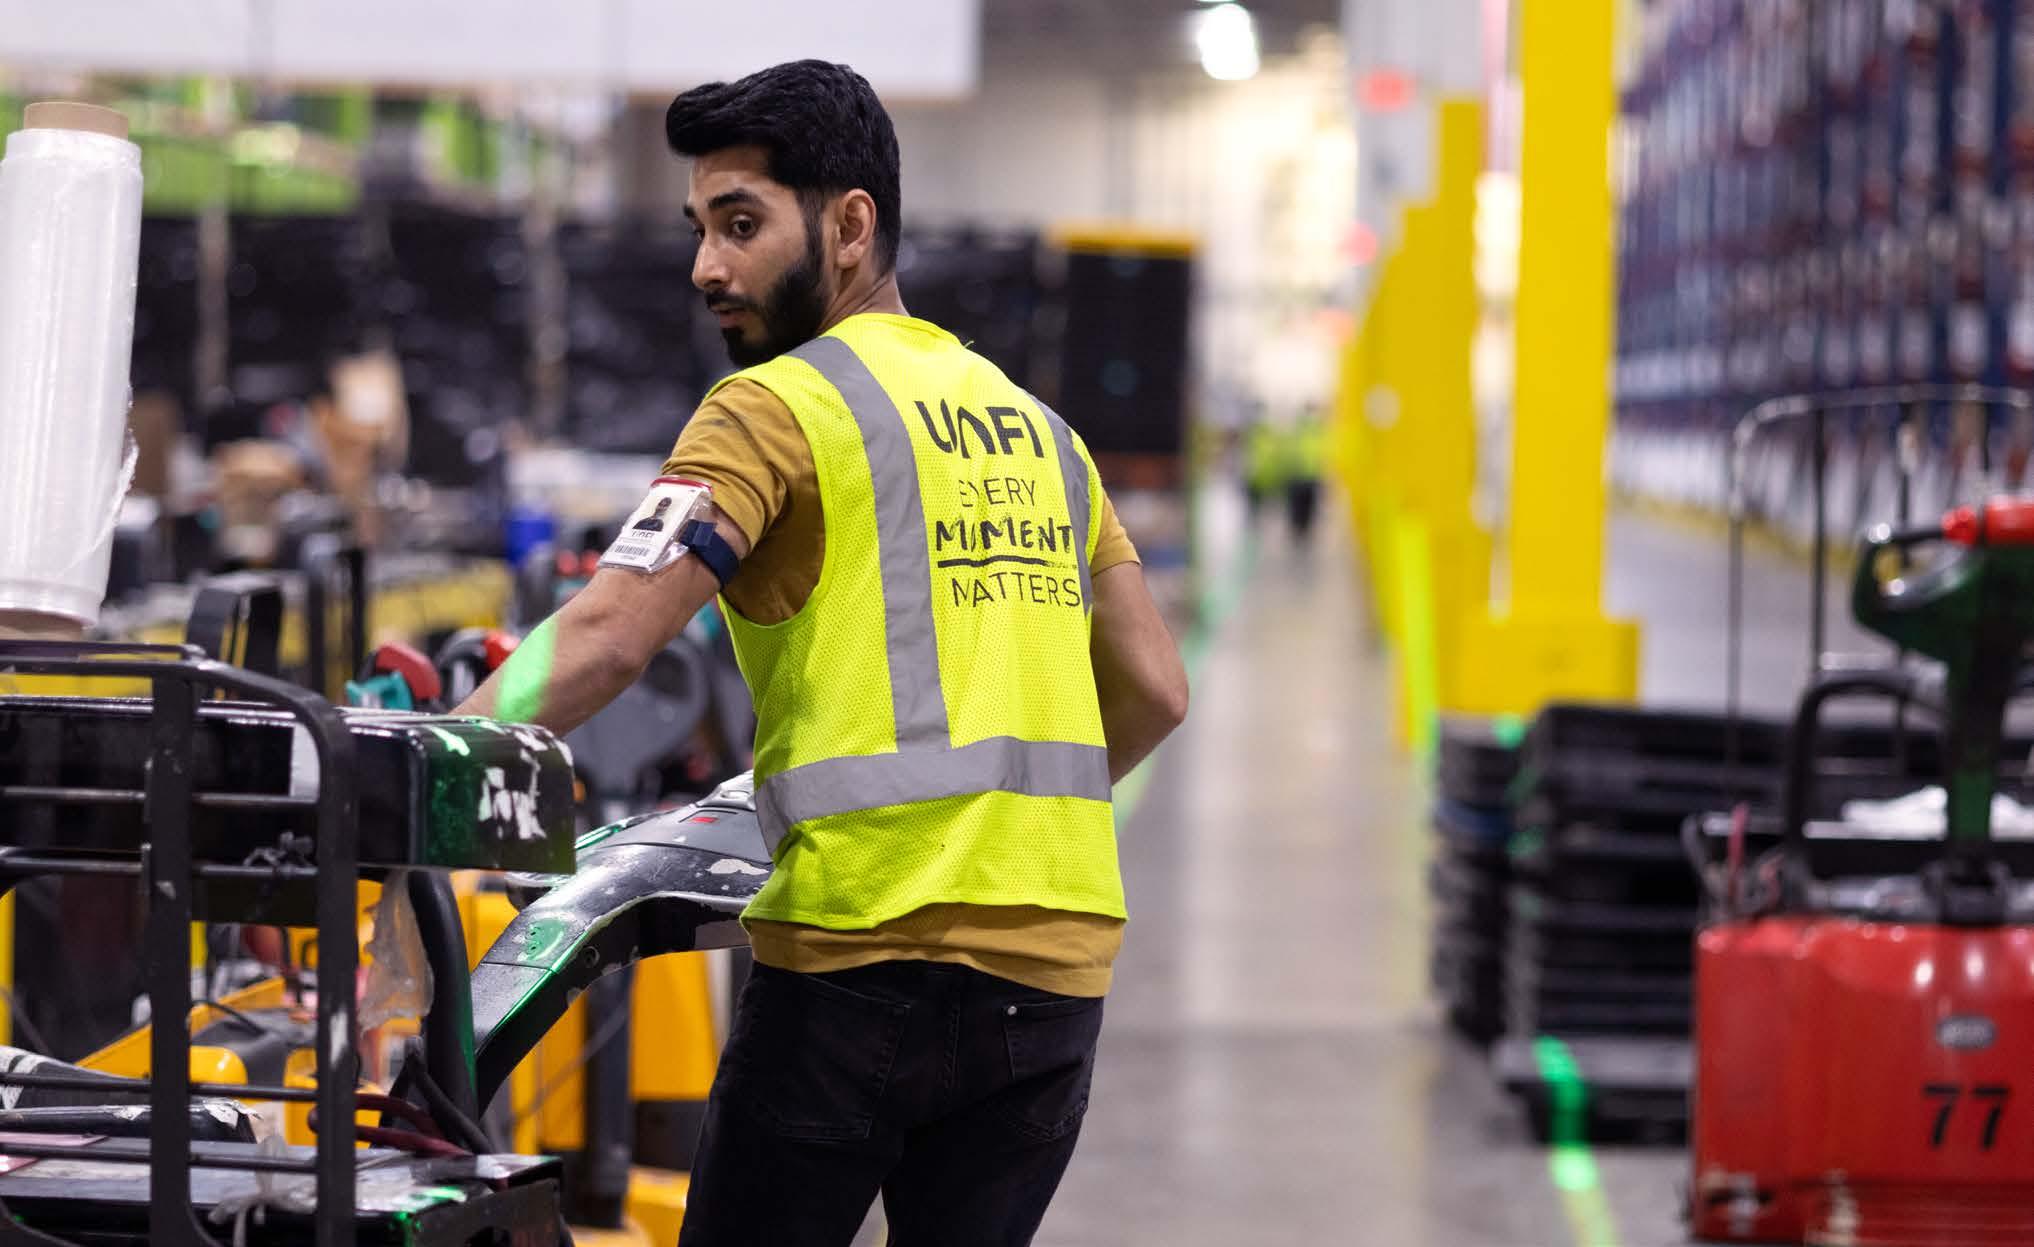
Thriving Associates
Our 25,000+ associates navigate the food industry's unique challenges— physically demanding environments, complex logistics, and evolving customer needs—daily. We focus on empowering associates to develop solutions that strengthen the supply chain, promoting a strong safety culture that improves quality and throughput, and building high-performing teams focused on operational excellence.
This year, we strengthened the programs that make UNFI a workplace where people want to build their careers. We focused on expanding mental health resources and professional development programs to build internal expertise while supporting associate well-being. Seven Belonging and Innovation Groups (BIGs) with over 3,000 members (including office and distribution center [DC] associates) foster community and strengthen associate engagement and retention.
Together, these initiatives reflect our commitment to keeping our associates safe and equipping them with tools for transforming challenges into opportunities for growth and innovation.
Topics to be covered:
• Health & Safety
• Engagement & Well-being
• Equal Opportunities
Health & Safety
The health and safety of our associates is foundational to operational excellence and reflects our core values. Strong safety performance improves associate well-being, quality of life, and retention, while helping UNFI achieve its goal of creating a better future for our customers, associates, and communities.
Breaking down our approach:
• Preventive Systems: Improving data collection for better trend analysis, focusing on incident investigation and root cause analysis to help eliminate hazards before incidents occur, and standardizing risk-reduction programs across our organization.
• Training & Culture: Providing consistent safety trainings and encouraging reporting without fear of reprisal.
• Performance Tracking: Monitoring injury frequency and severity while driving continuous improvement.
• Hazardous Material Waste Management: Ensuring safe handling, storage, and disposal of product, protecting associates and communities from exposure.
We continue to maintain rigorous safety protocols across our distribution network. Meetings start with safety moments, and real-time metrics displayed facility-wide reinforce our focus on safety. This year we standardized training, advanced driver safety, and reduced injury rates and lost time, while strengthening service reliability to our customers.
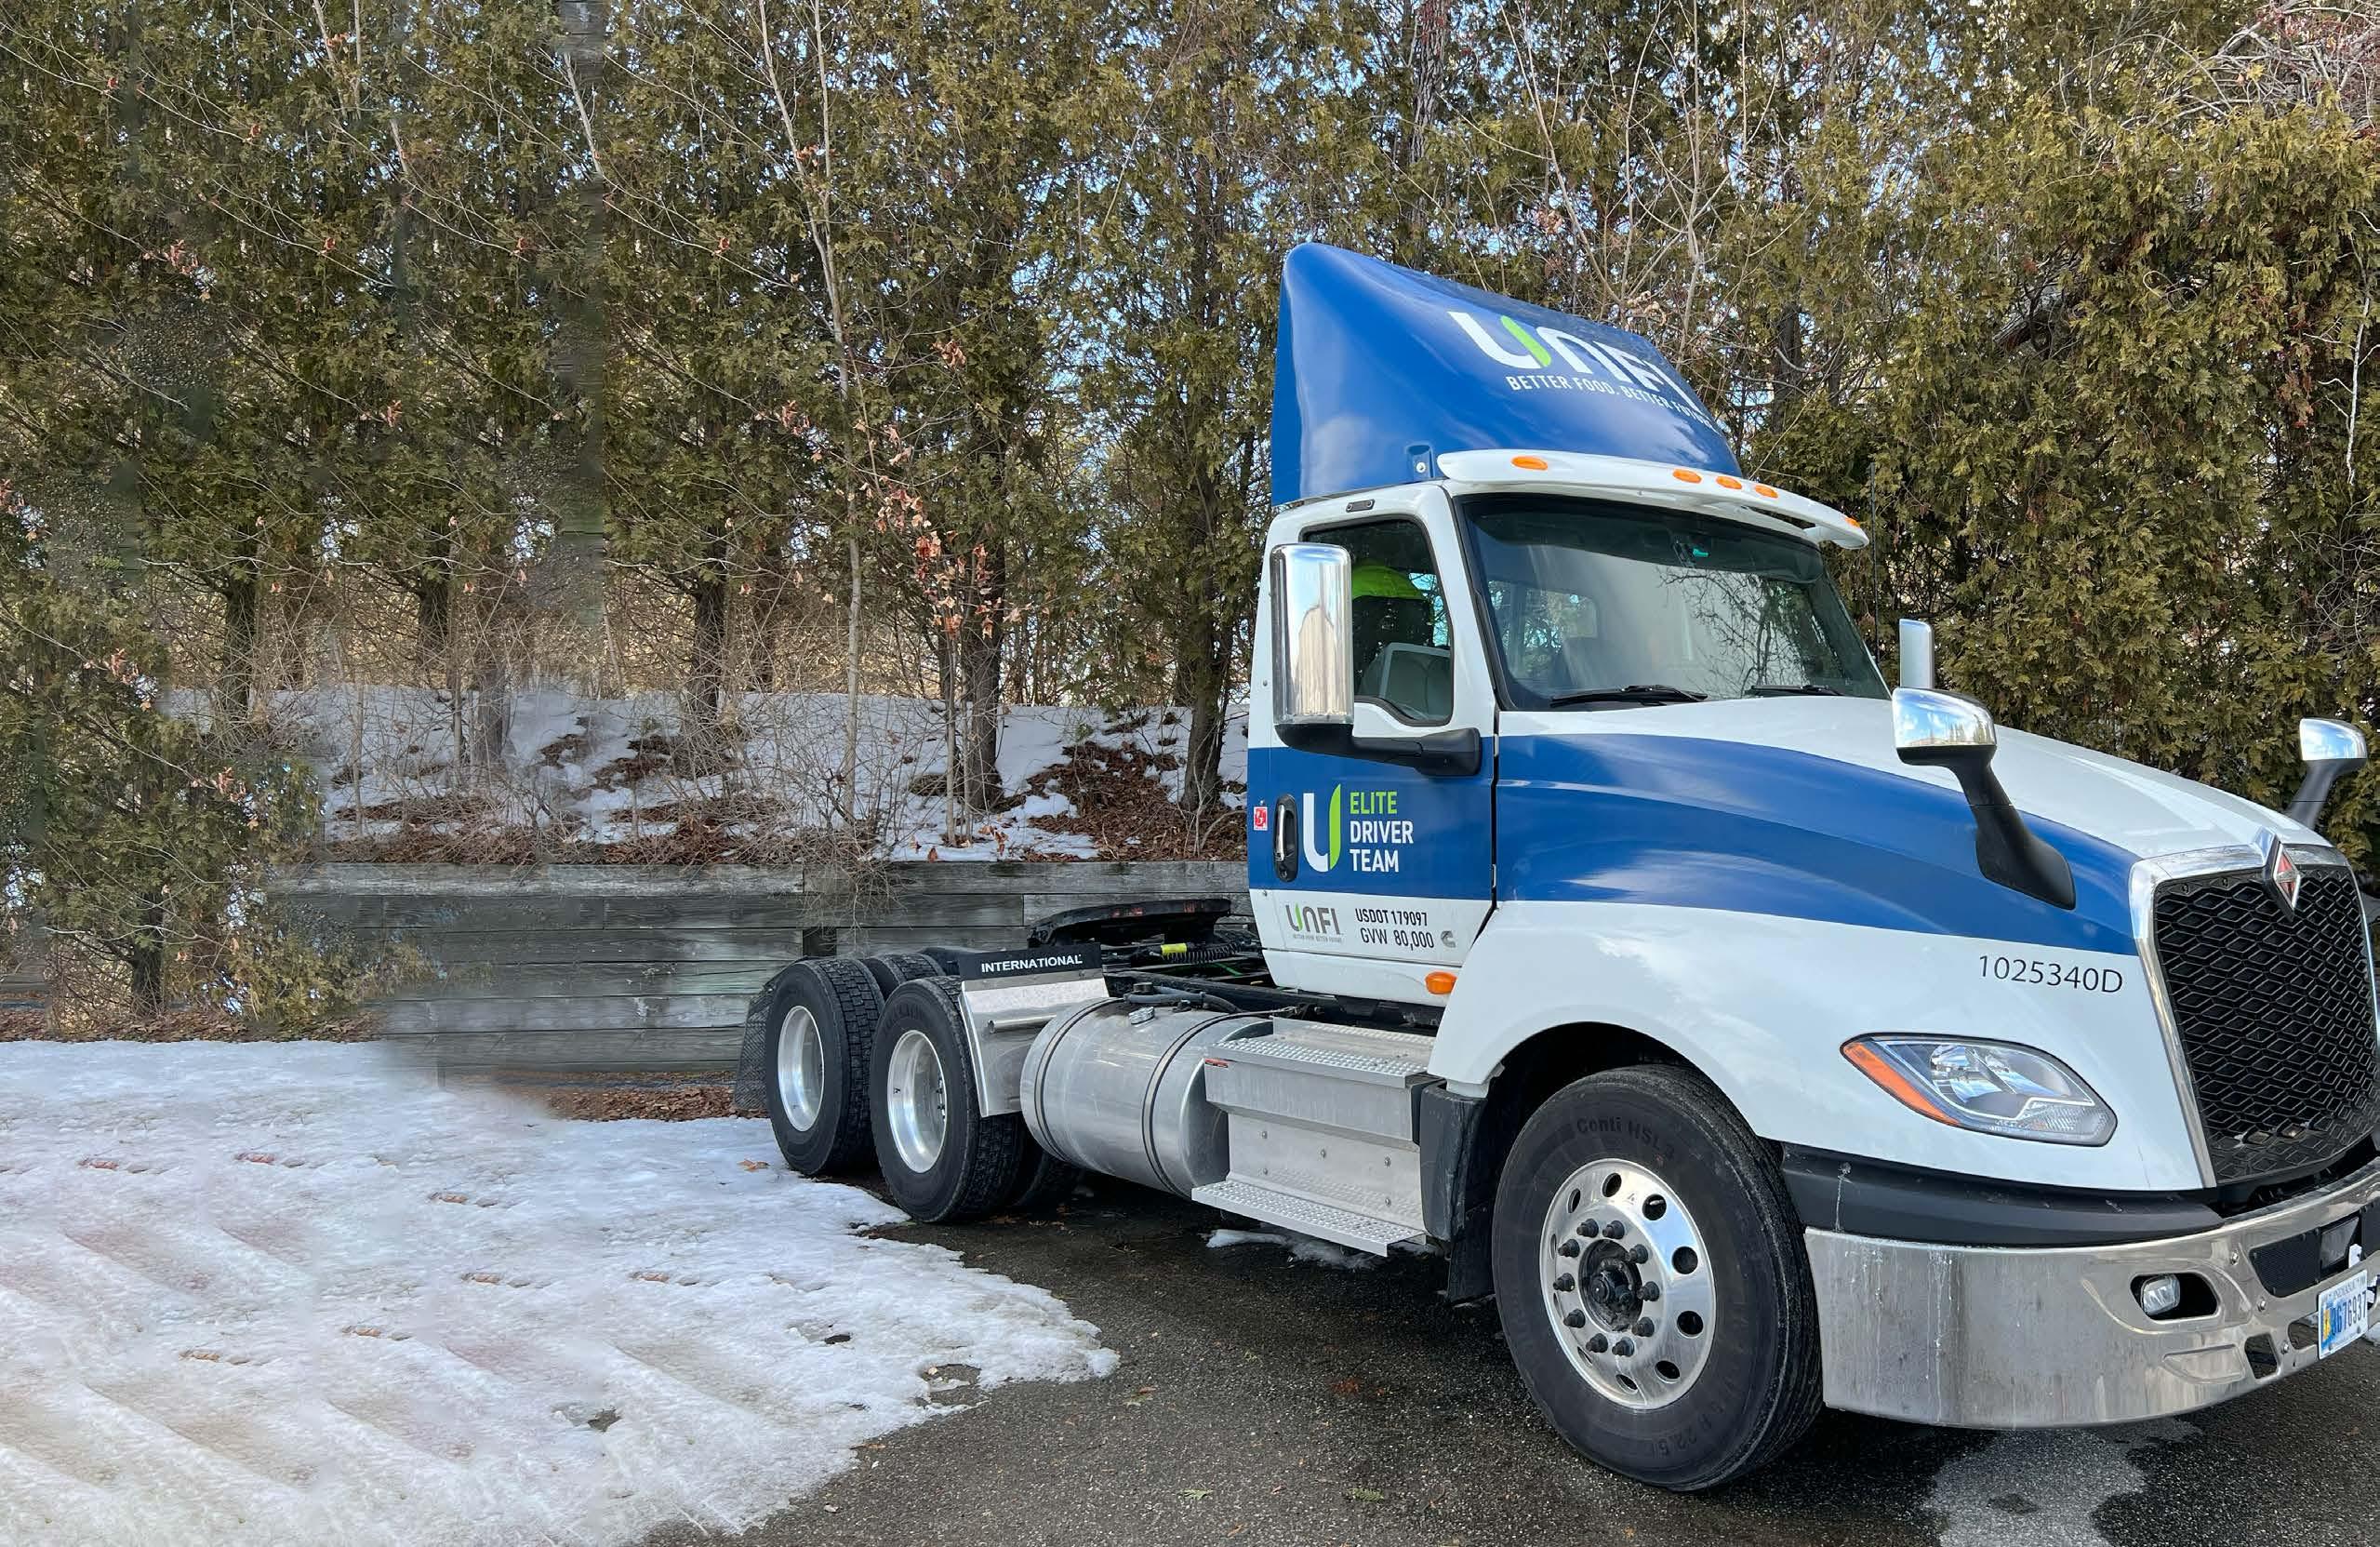
Fleet Management: Real-Time Safety Through Technology
This year, we equipped our fleet with video safety systems, providing real-time visibility into driver performance. These systems deliver automated alerts and provide drivers with immediate feedback and coaching. Remote video review streamlines incident investigations, while advanced dashboards replace manual reporting and highlight safety trends. The technology also identifies fuel reduction opportunities, enabling us to reduce our GHG emissions. Moving forward, we plan to leverage these capabilities to help further reduce preventable collisions and strengthen our safety culture.
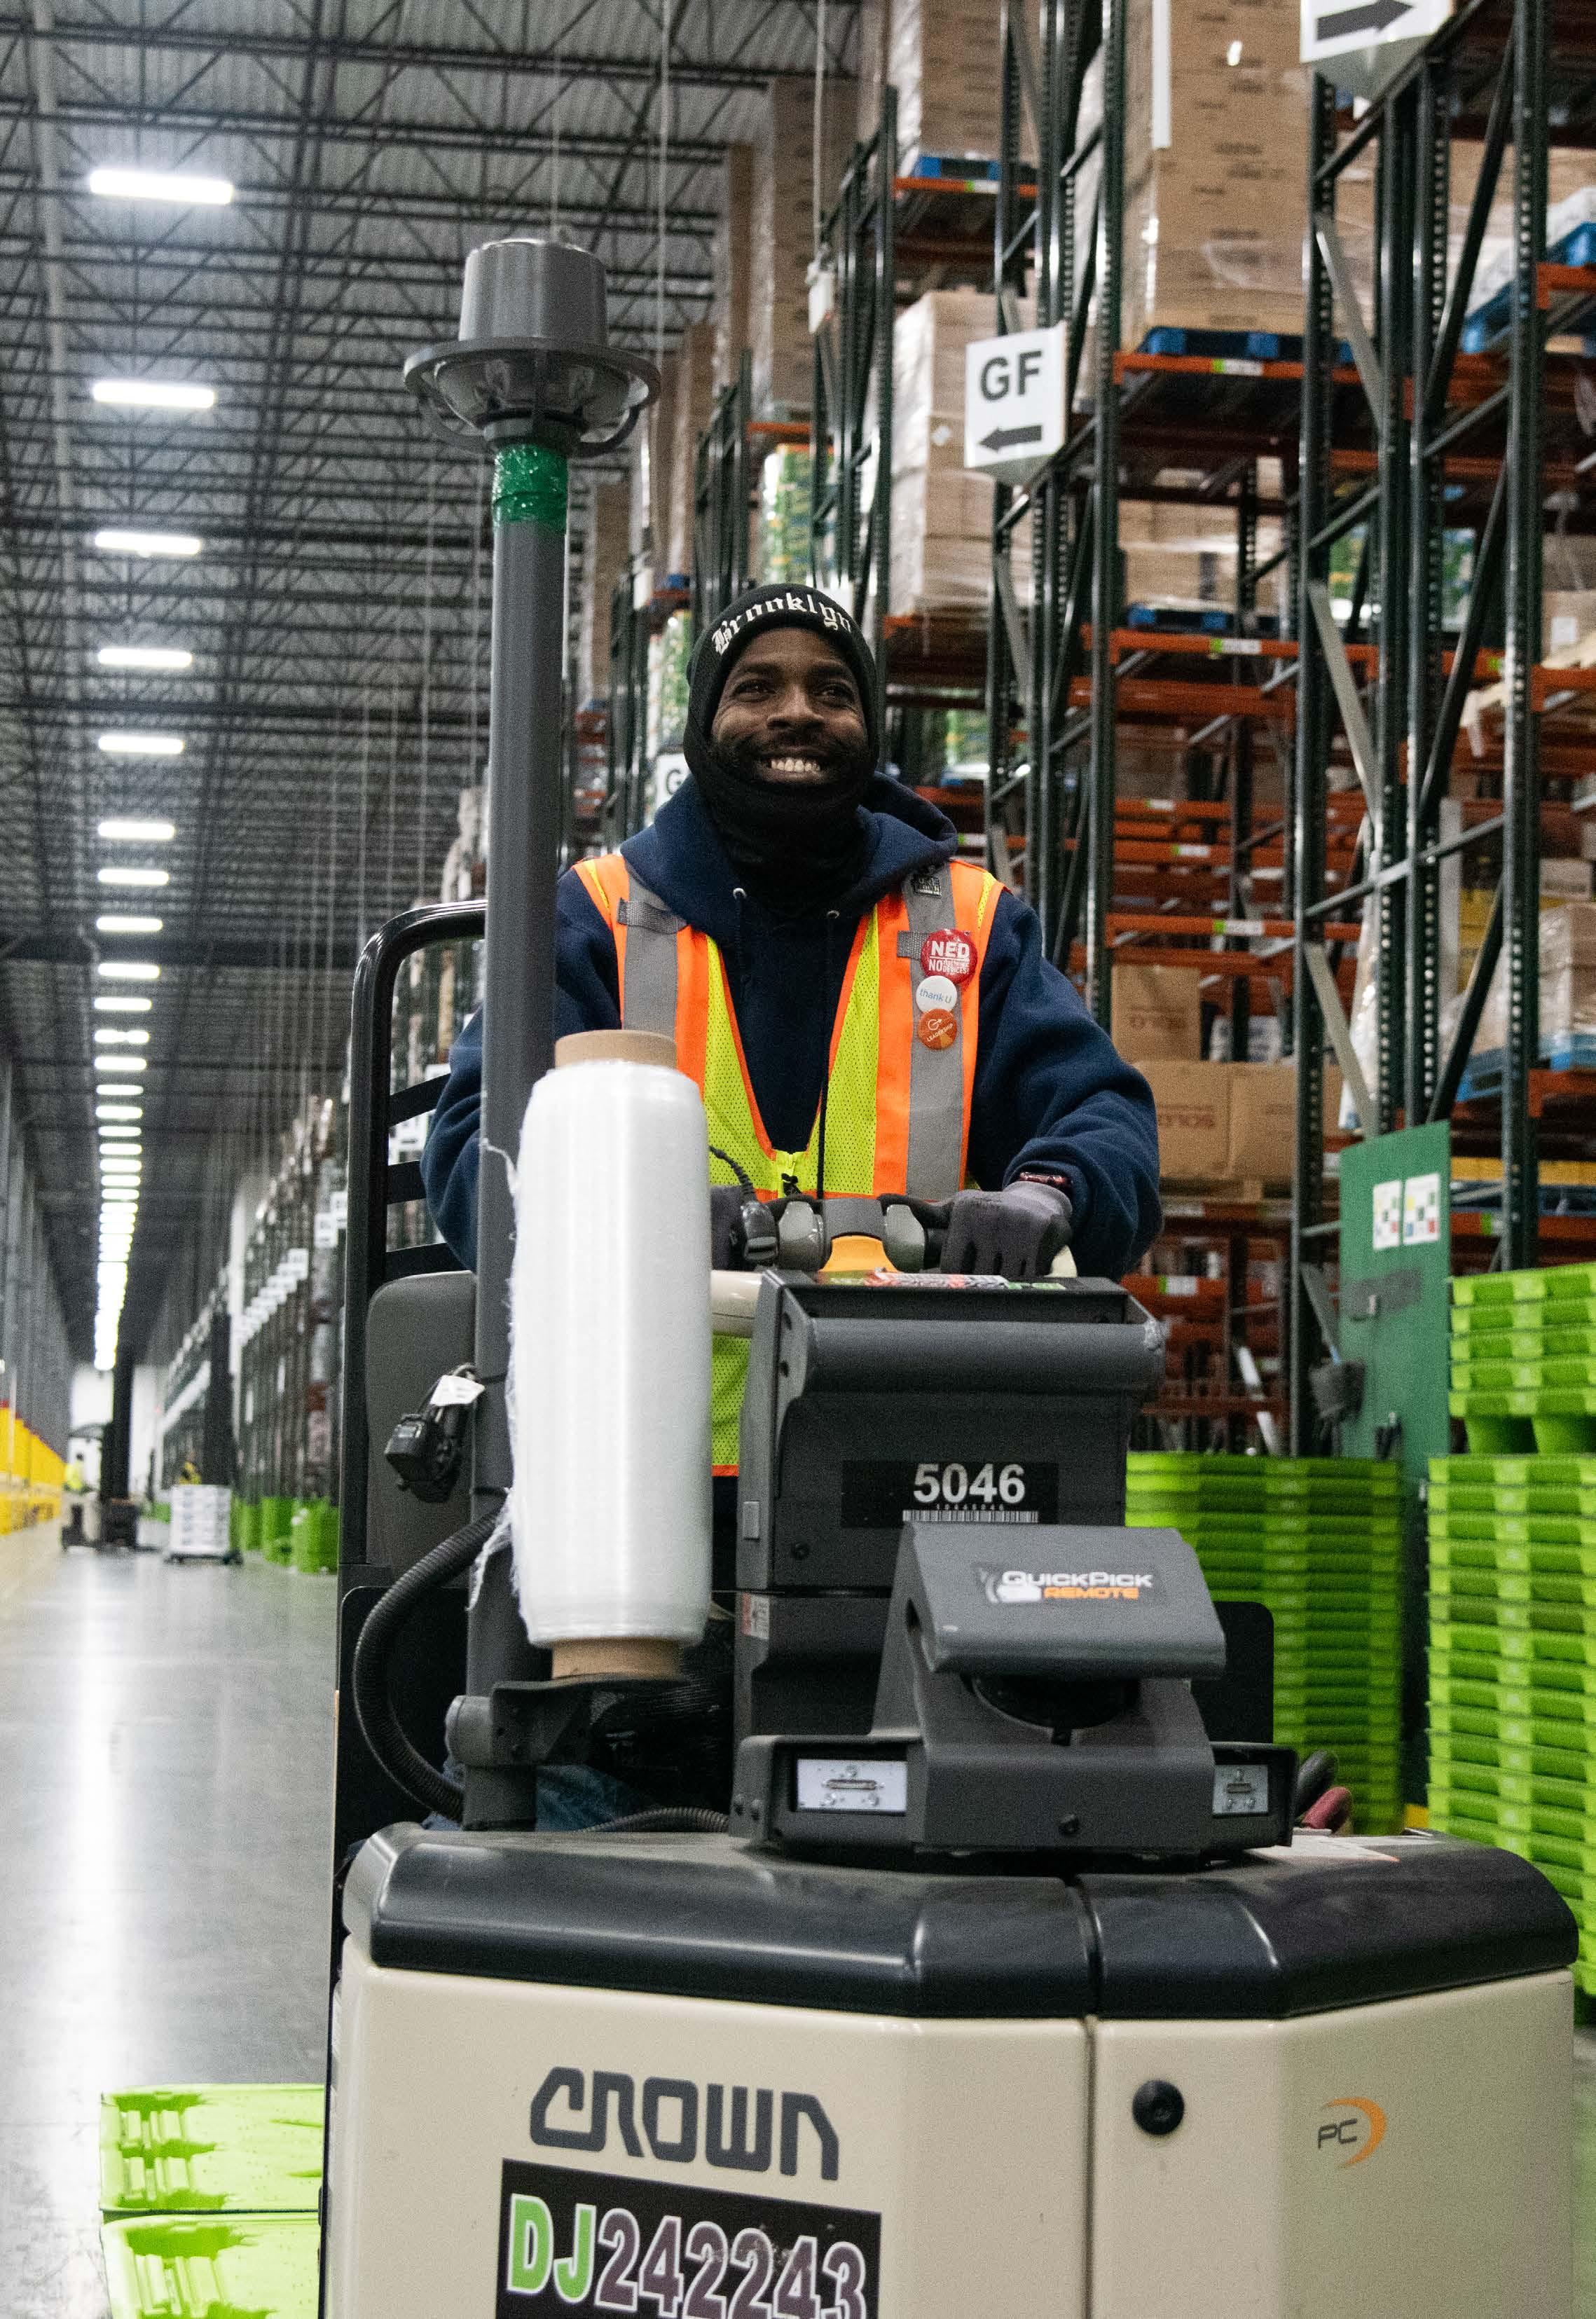
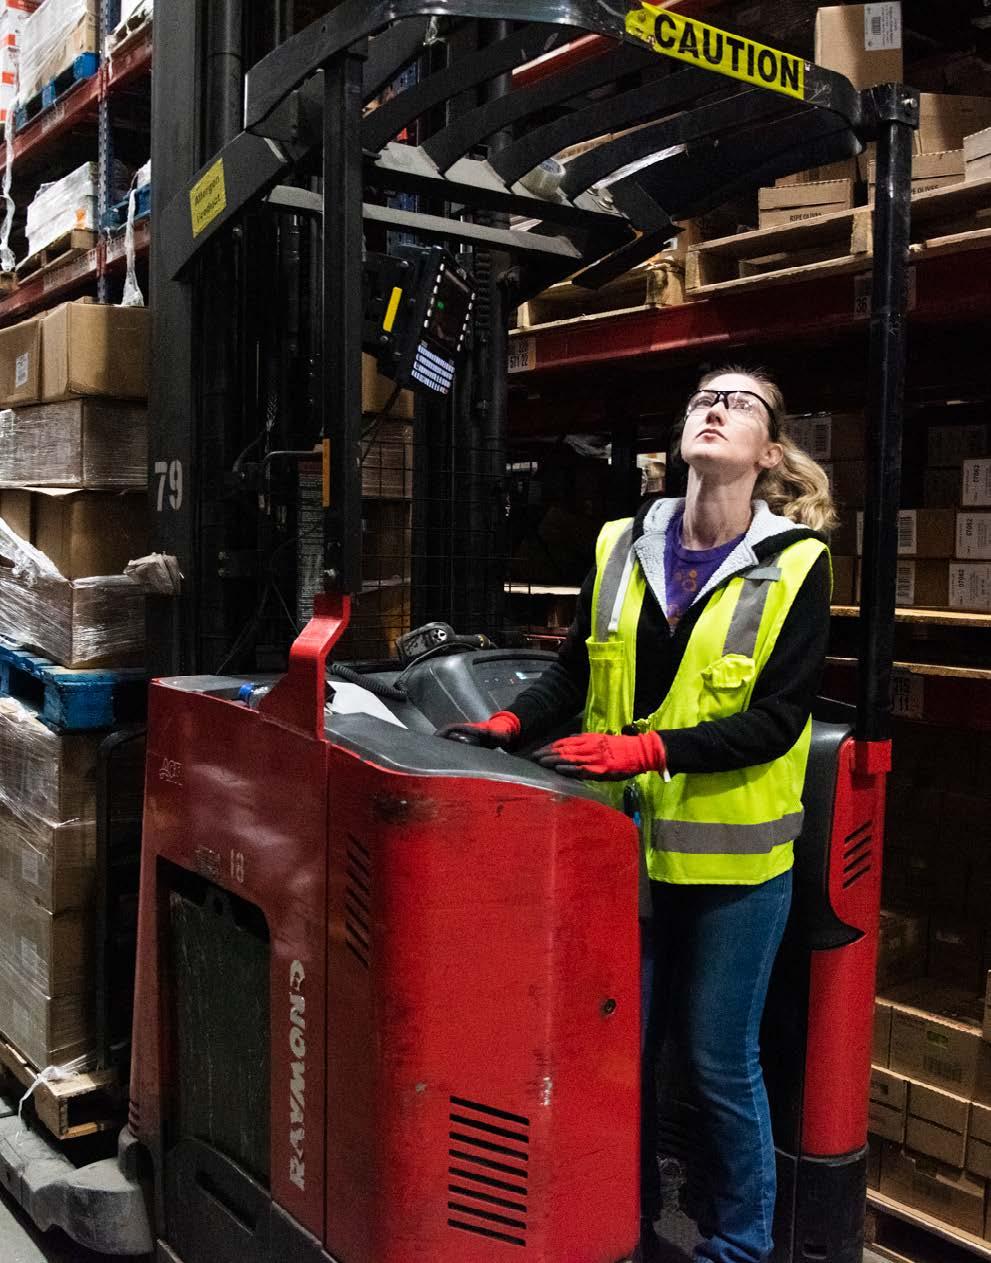
Powered industrial trucks, like forklifts and pallet jacks, are critical infrastructure for moving product in our DCs. This past year, we began implementing even more comprehensive PIT training across all facilities, equipping associates with the tools and skills needed to ensure workplace safety and operational excellence.
Certified PIT trainers deliver uniform instruction exceeding regulatory requirements, with operators receiving the same high-quality training across locations. Following U.S. completion, these program enhancements will expand to Canada, aiming to reduce equipment incidents while building operator confidence.
Engagement & Well-being
We strive to cultivate a workforce where associates feel a sense of belonging and are supported to reach their full potential. According to an enterprise-wide analysis of our wellness program’s 2024 data:
• 79% of participating associates reported improved health outcomes
• Associates active in our wellness program missed 1.8 fewer workdays annually
• Associates engaged in our wellness program had a 21% lower turnover rate than associates not active in our wellness program
We believe that supporting the health and well-being of our associates can lead to a strong, connected workforce dedicated to operational excellence.
Breaking down our approach:
• Professional Development: Creating pathways for advancement through mentorship, leadership programs, and skills training that build expertise internally.
• BIGs: Supporting associate-led groups driving innovation and improving culture through 50+ virtual meetings, trainings, and organized events.
• Holistic Wellness: Addressing physical, mental, and financial health through programs like Healthy Pursuits wellness program, Mental Health First Aid trainings, and on-site flu and biometric screenings.
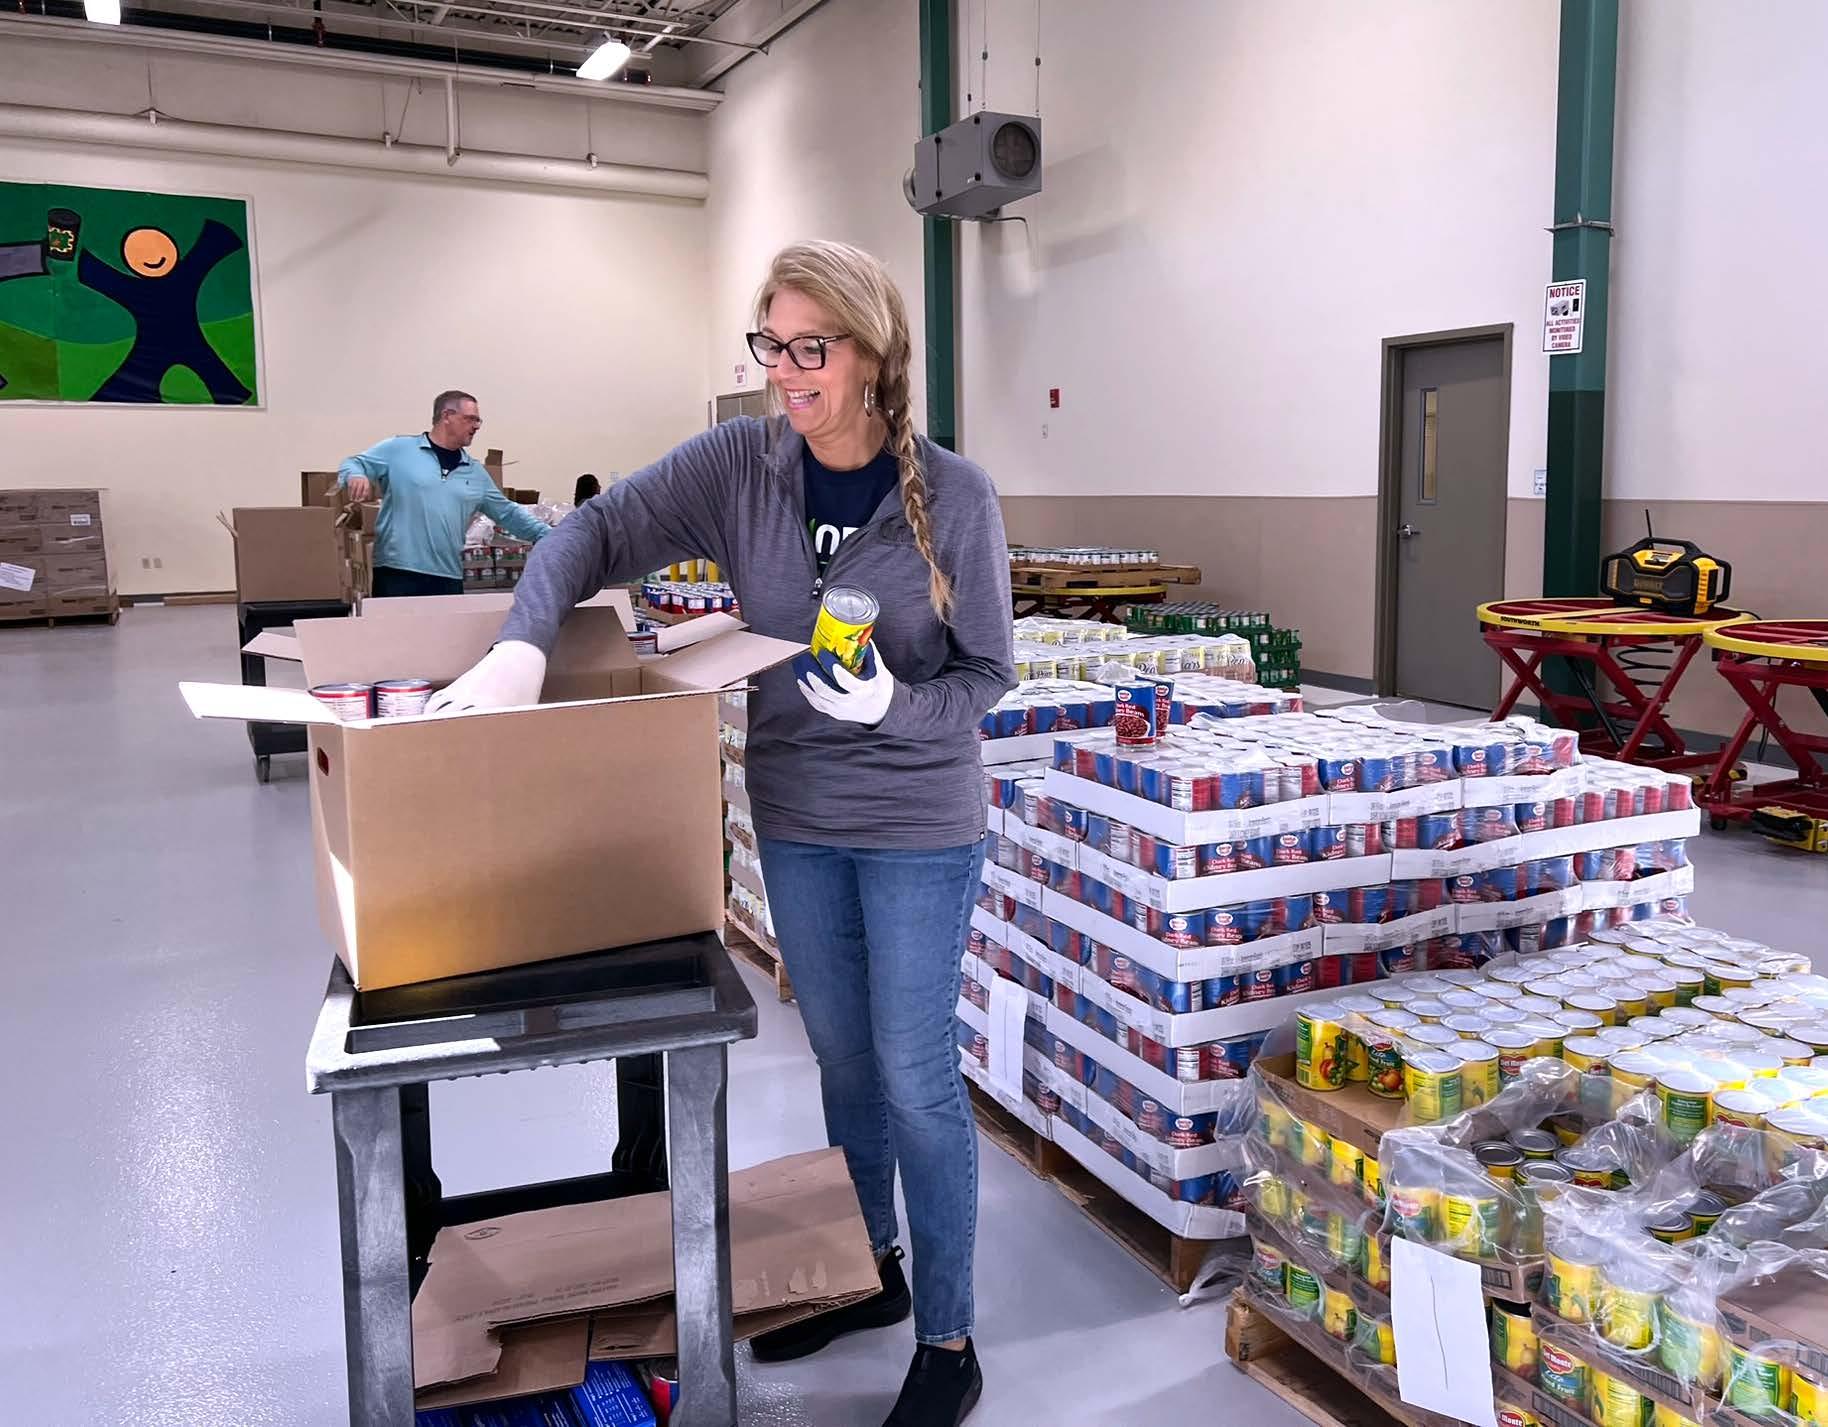
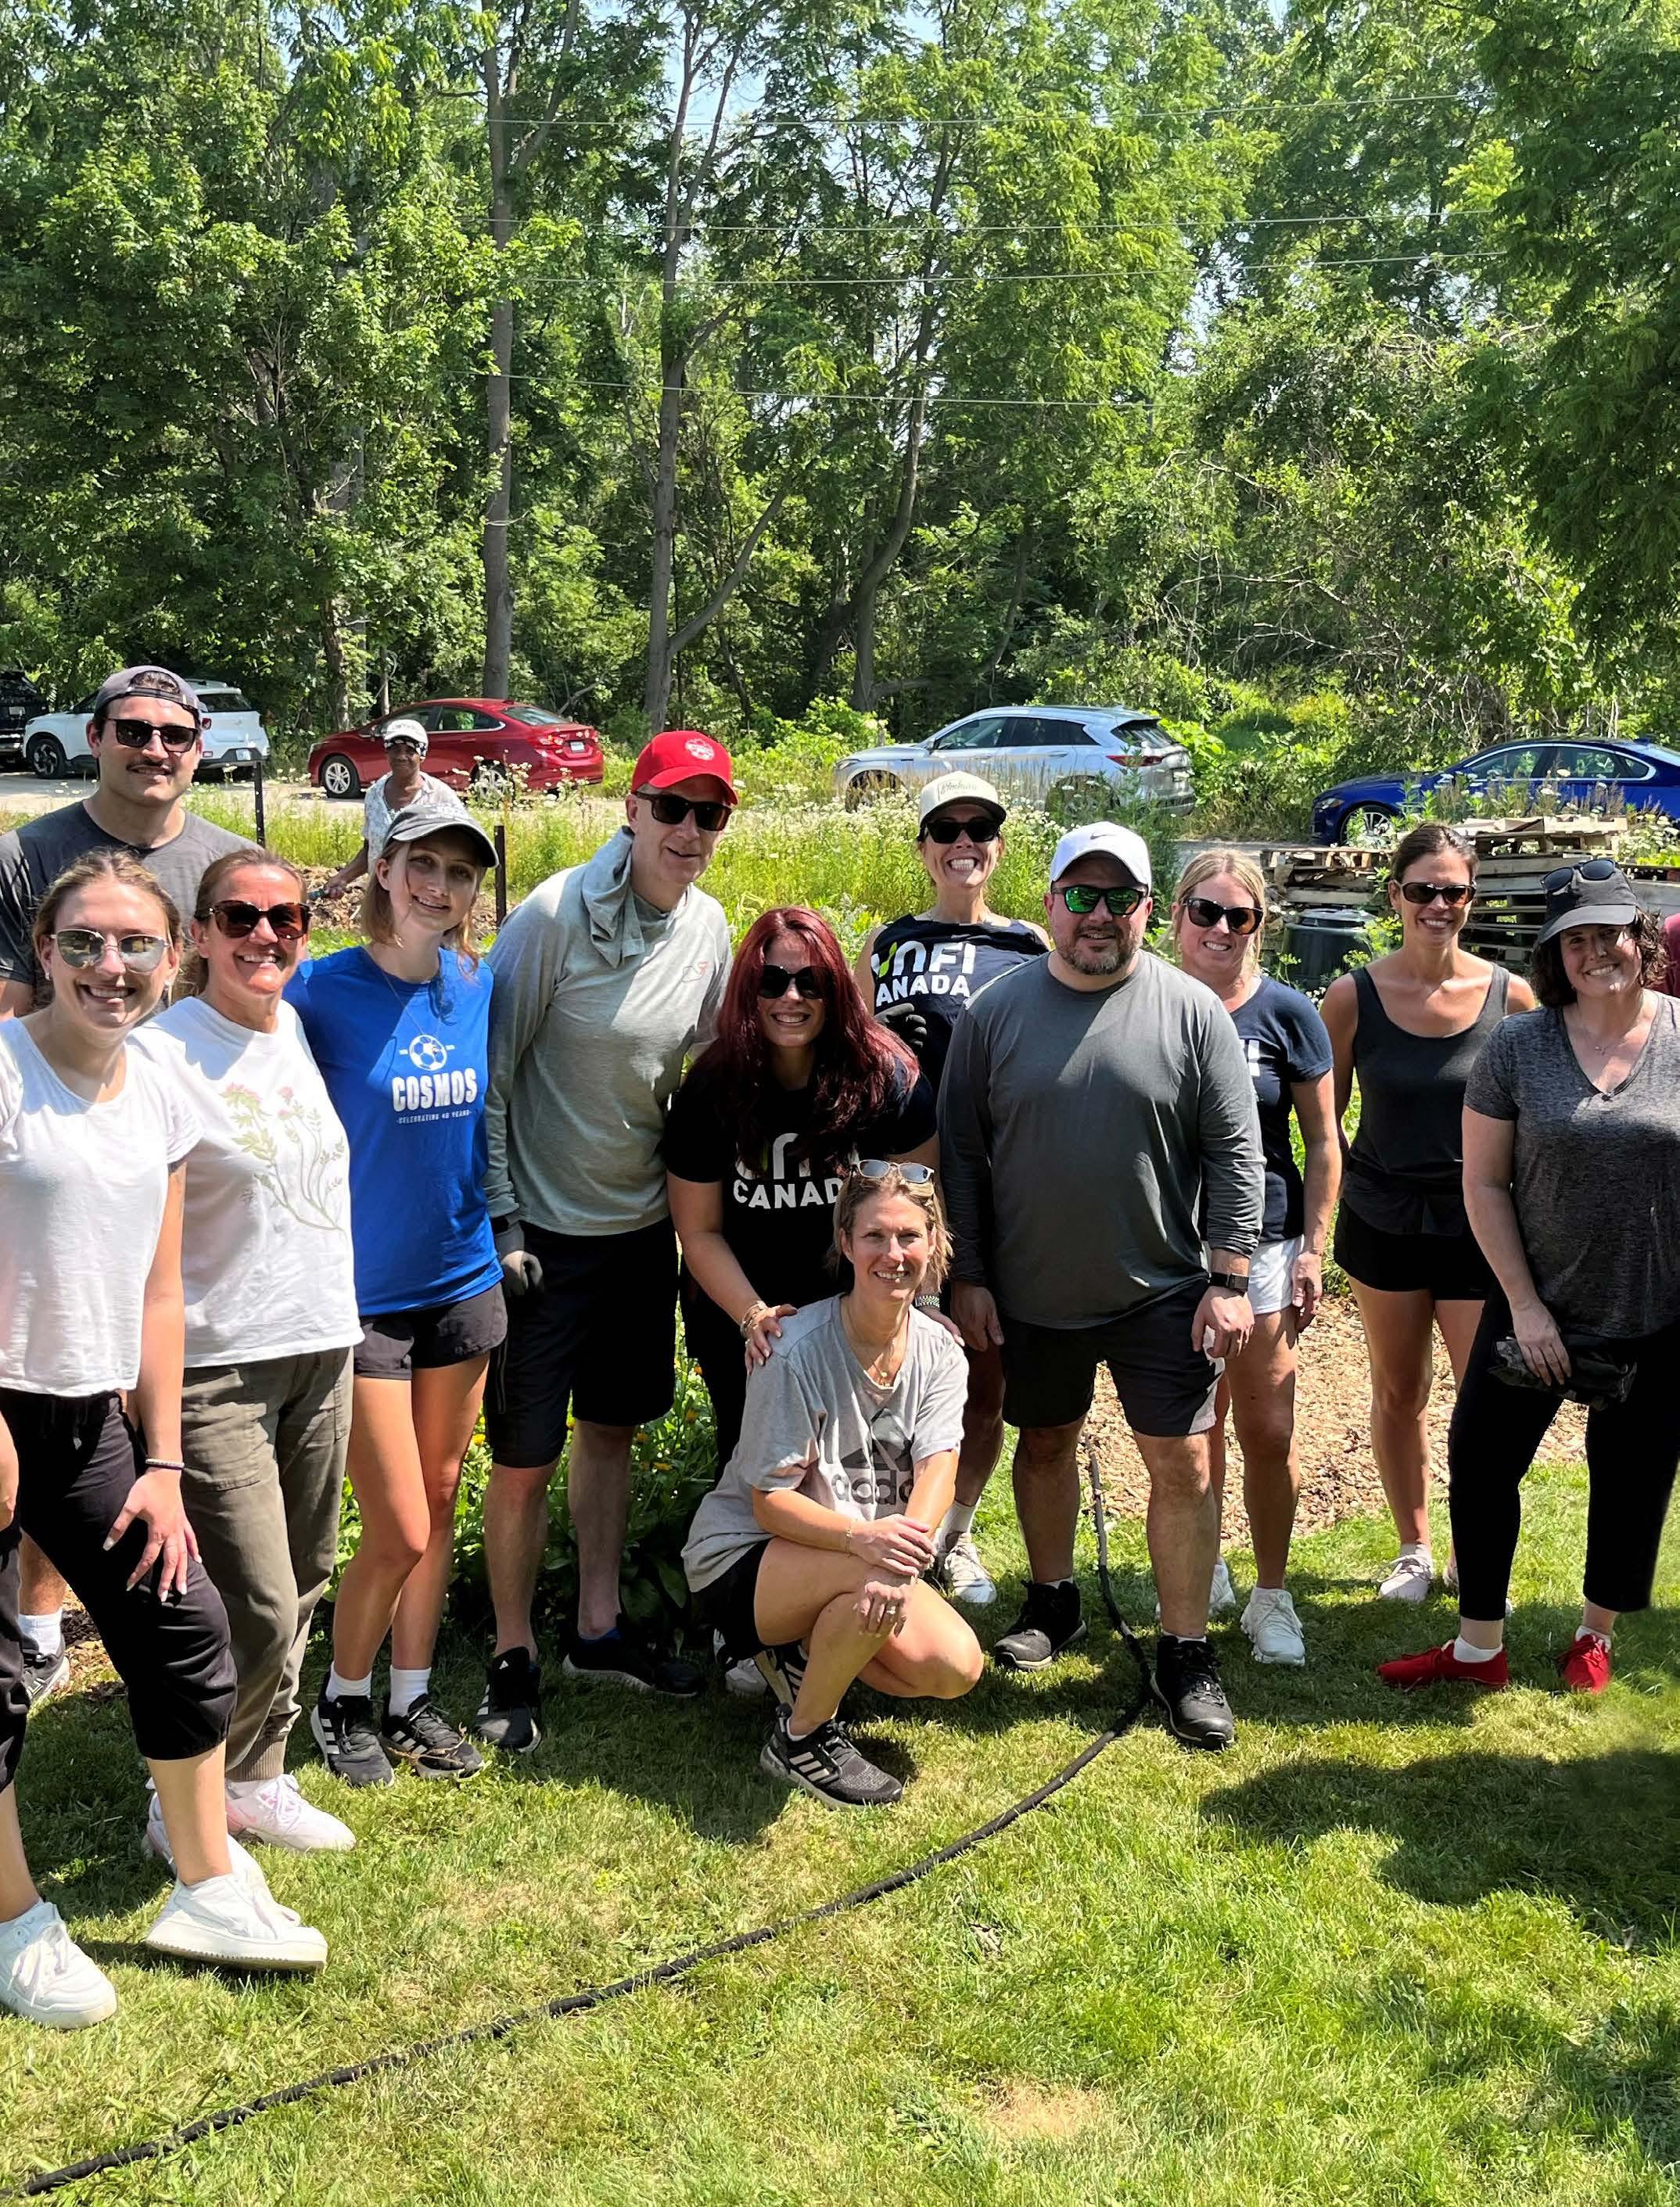
• Community Connection: Empowering associates to engage with and strengthen communities through volunteering events.
Giving back to the community reflects my values, and working at a company that supports volunteerism is very important to me.
Tina Colborn-Krug, Associate Experience Manager in Sarasota, FL
UNFI’s Belonging & Innovation Groups
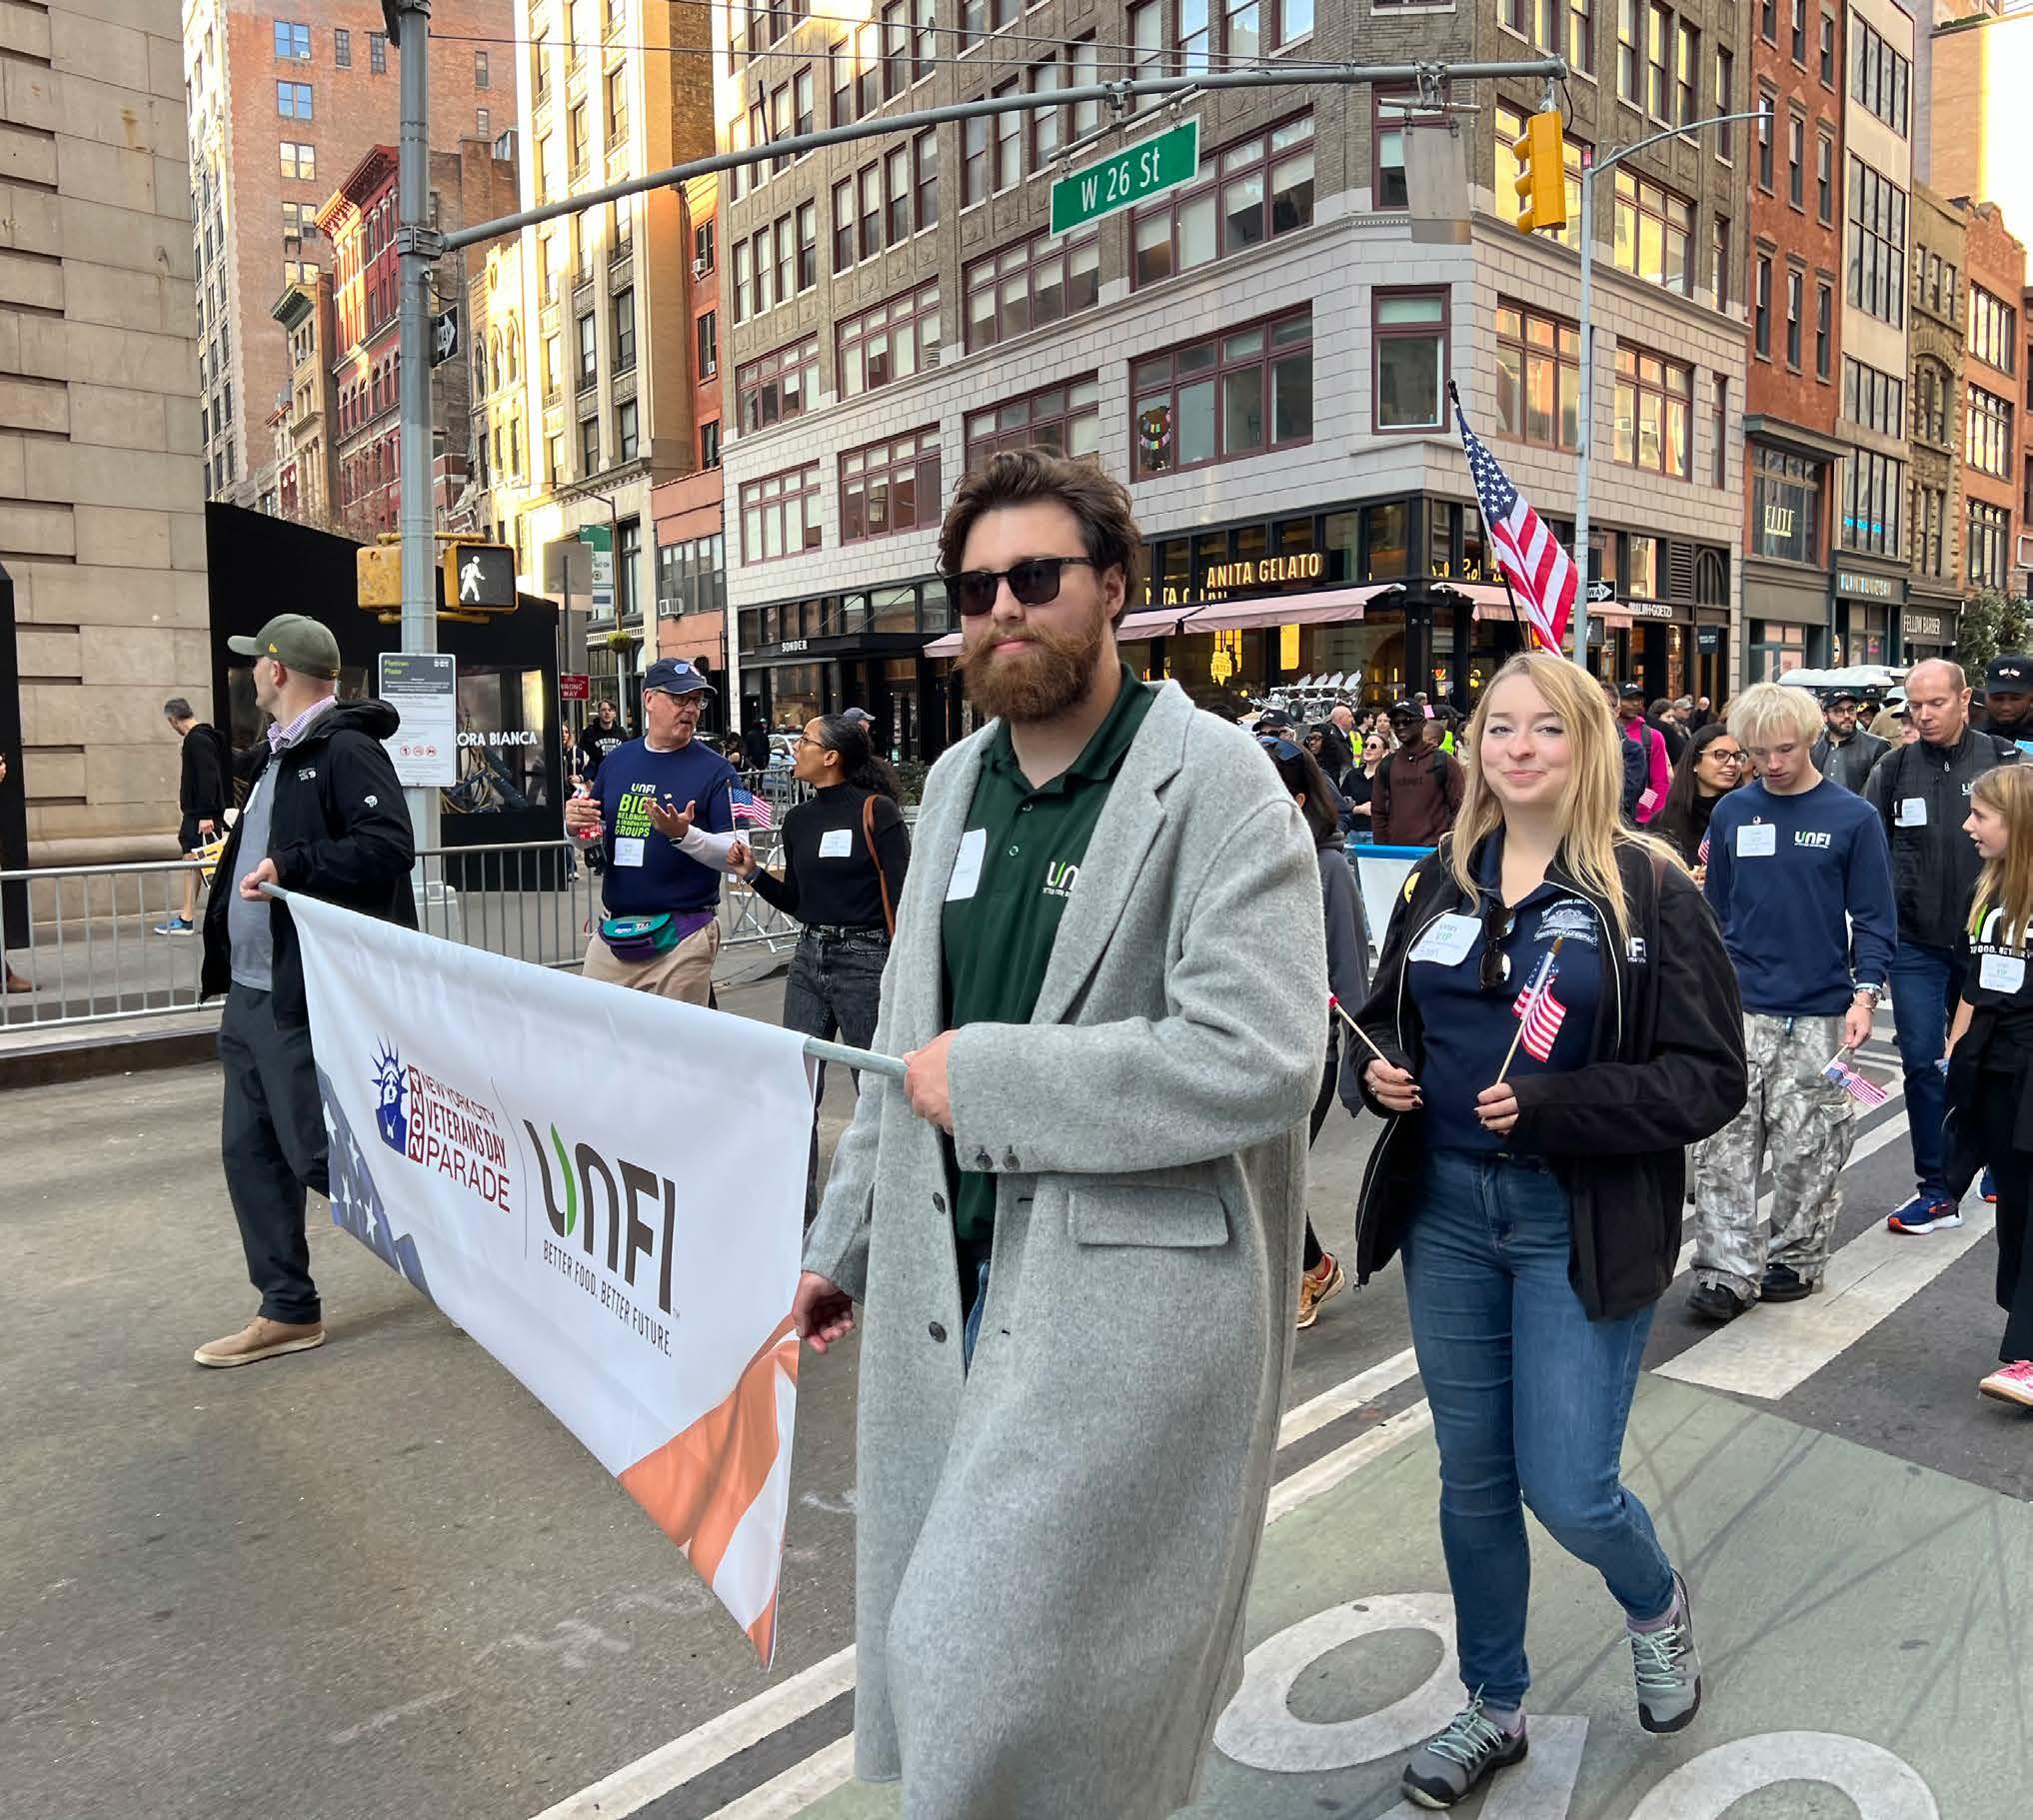
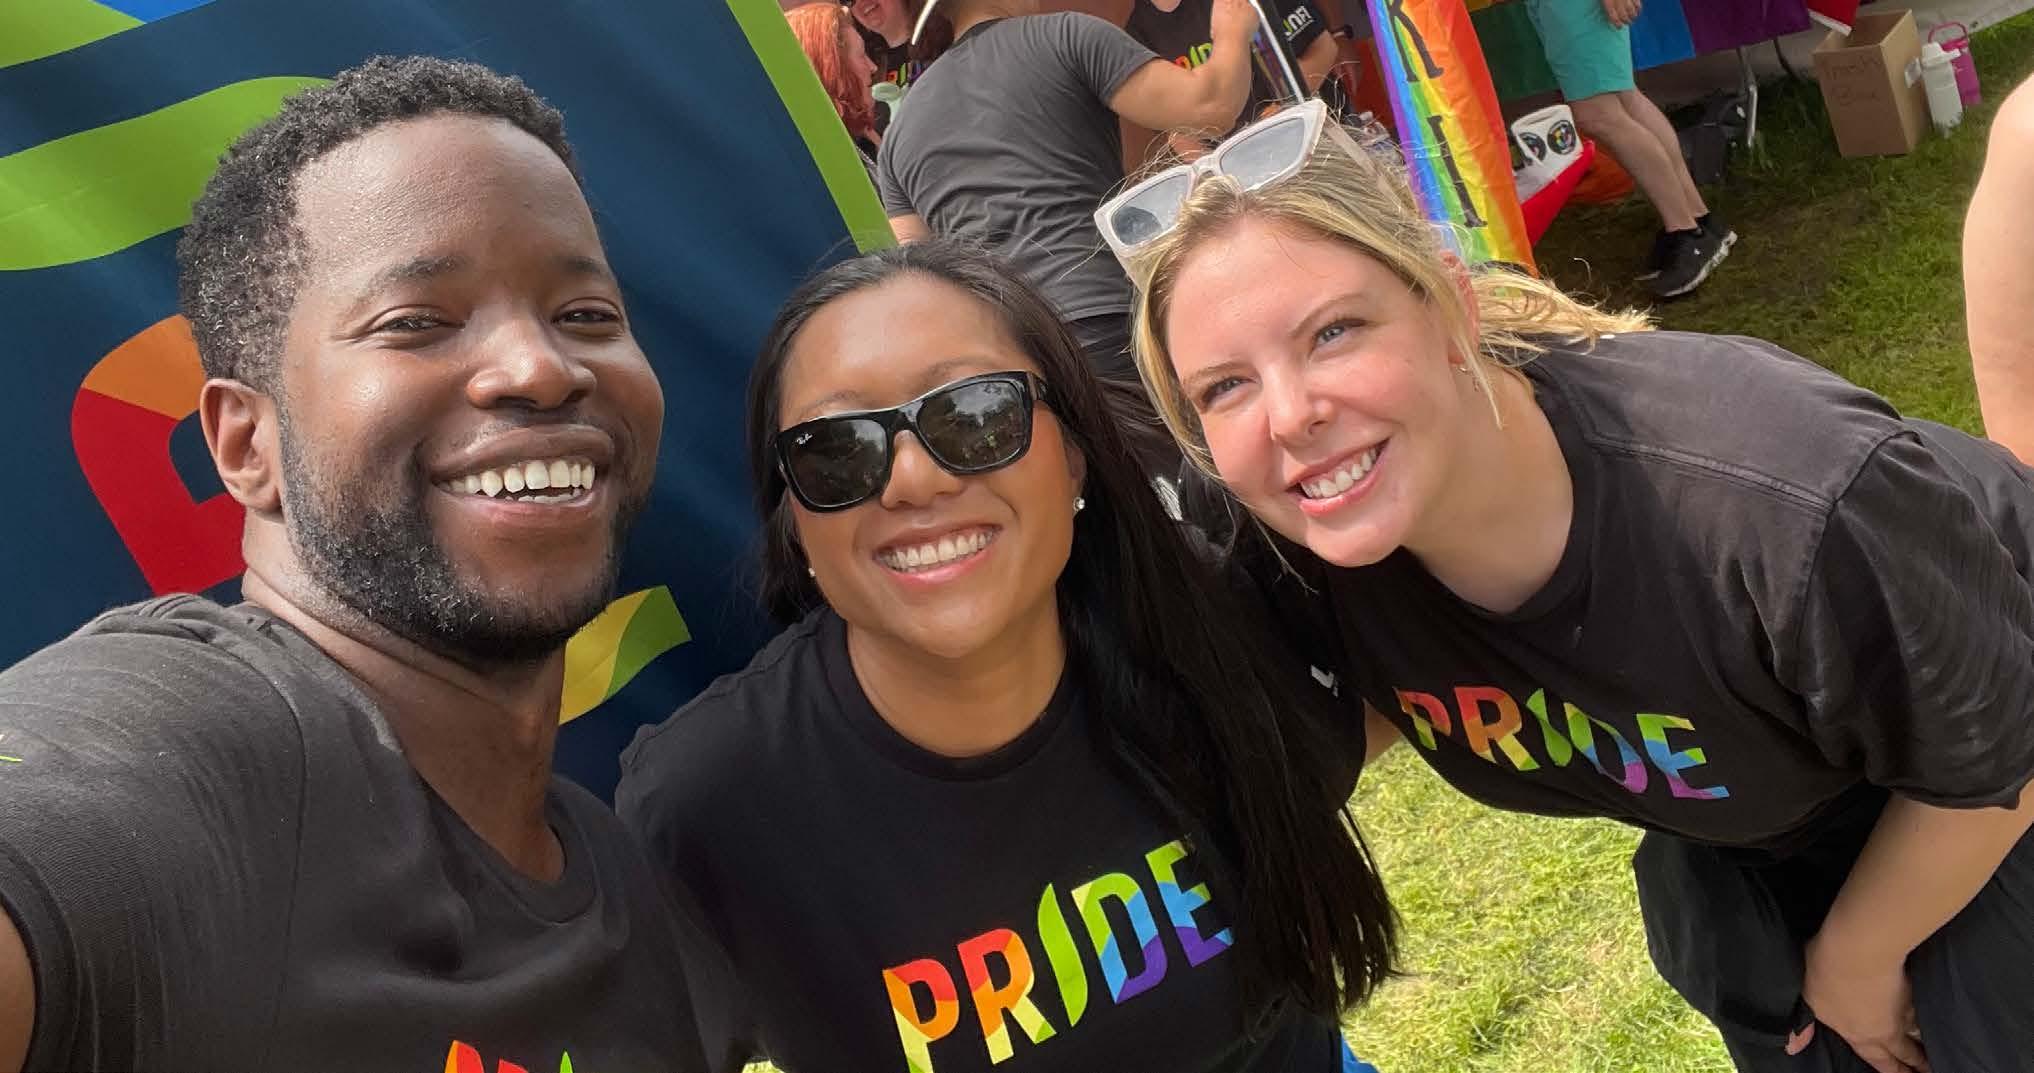
This year, our BIGs organized trainings like financial awareness and mental well-being while also bringing associates together for community service events, contributing a total of 1,199 volunteer hours. The BUILT BIG mobilized 25 DCs to collect over 4,400 clothing items during its Coats for King clothing drive in honor of Dr. Martin Luther King Jr. Day of Service. UNFI’s VIP BIG hosted a Wounded Warrior 5K event and participated in the New York City Veterans Day Parade, while PRIDE BIG organized volunteer events at the Rhode Island and Twin Cities Pride festivals.
With BIG membership up 136% to 3,147 associates, including a 33% membership increase among people leaders, these associate-led groups drive community impact while building engagement across our network. BIGs are organized around specific topics, open to all associates, and all associates can participate in BIG-led activities.
• ACE: Asian Coalition for Engagement
• ADELANTE: Hispanic Network
• BUILT: Black UNFI Leaders of Today
• DREAM: Disability Resources, Equity, Allyship and Mentorship for Disabled Associates
• PRIDE: LGBTQ+ Network
• VIP: Veterans Initiative Program
• WIN: Women’s Integrated Network
113 additional leaders completed mental health awareness training, raising the total to 1,715 since launch in Fiscal Year 2024
90 unique Fresh Perspectives webinar topics
1,119 volunteer hours contributed through BIG participation and BIG-led activities
42% of eligible associates participated in the Healthy Pursuits wellness incentive program
4,692 associates participated in at least one inclusion and well-being-related activity
25 Fresh Perspective Well-being webinars held, addressing emotional, physical, financial, career and community aspects of wellness
50+ virtual BIG meetings, providing education and upskilling sessions
1,067 volunteer hours logged by the Canada team, exceeding their 1,000-hour target
15,027 total associate volunteer hours logged in Fiscal Year 2025
BEHIND
Current Progress: 67,775 hours since our Fiscal Year 2020 baseline.
Log 200,000 associate volunteer hours by 2030.
We continue to build momentum and enthusiasm for volunteerism across UNFI.
Structured approaches like companywide campaigns, BIG-led initiatives, and skills-based volunteering provide approachable pathways for associates to volunteer, while improved systems have strengthened how we measure and track participation. While progress on this goal has been steady, we recognize we are behind schedule and are developing creative solutions to get us on track.
For example, this year our Volunteer Champions Network enhanced our storytelling efforts to showcase the impact of volunteerism at every level, launching a Volunteer Spotlight Campaign to celebrate individual associates and inspire others.
We are also focused on having greater coordination across teams, including Human Resources, Associate Experience, and the BIGs, to increase the number of UNFI volunteer activities offered, and providing education on how to log time. Looking ahead, we are exploring alternative ways of measuring our impact through volunteerism.
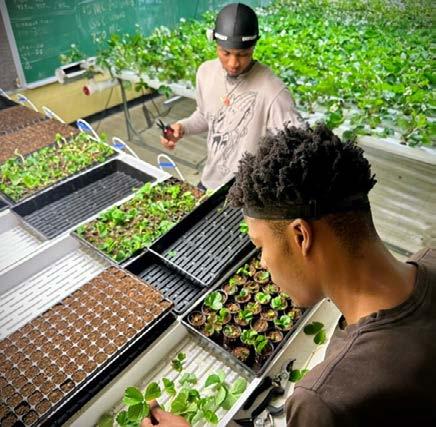
Growing Our Impact: Skills-Based Volunteering in Action
Now in its second year, UNFI’s Skills-Based Volunteering Program connects UNFI Foundation nonprofits seeking assistance with UNFI technical experts for mentorship and skill building.
This year, Ray Bradford, General Manager of UNFI's Hopkins DC and UNFI Foundation Board Member, partnered with non-profit food hub and UNFI Foundation grantee, The Good Acre, to share expertise and strengthen their warehouse operations. By leveraging our expertise in distribution and operations, we can help strengthen the impact our nonprofit partners have in their communities. We are excited to grow this program to have an even greater impact.
It’s rewarding to use my experience to support a UNFI Foundation grantee and help build capacity for such a crucial local resource. Contributing time and know-how is one of the most meaningful ways I can make a difference.
Ray Bradford, General Manager, Hopkins DC
Photo courtesy of The Good Acre
BIG Momentum:
Focus on Our Warehouse Associates
We renewed our efforts to drive engagement with our associates working in the DCs, particularly through BIG engagement and volunteerism. We promoted the BIGs through multilingual signage and team communications, growing total membership to over 3,000 associates, and continued providing associates with opportunities to volunteer in their communities and invest in their professional development.
Mental Health First Aid: Building Support Networks
The Inclusion & Well-being team partnered with Safety to certify Mental Health First Aiders across our distribution network this year. Associates at 46 DCs now have the necessary skills to recognize signs of mental health and safely assist those experiencing a crisis.
These certified associates can connect colleagues with appropriate help before issues escalate. We plan to expand this network of Mental Health First Aiders, broadening the pool of trained associates who can respond with knowledge and compassion.
Equal Opportunities
We provide equal opportunities that help associates build careers across our unique network—from distribution centers to retail stores to corporate offices. This commitment to fair advancement and internal development attracts talent with diverse backgrounds while building deep operational expertise that strengthens our entire supply chain.
Breaking down our approach:
• Transparent Processes: Maintaining clear promotion criteria, standardized compensation, and providing avenues for anonymous associate communication.
• Professional Development: Providing tuition assistance, mentoring, and skills training, aligning individual growth with business needs.
• Fair Labor Standards: Ensuring competitive wages, retaining talent while building community purchasing power.
It was great to be able to connect with associates from other DCs to share our experiences, discover new ways to lead, and gain valuable insight on each other’s journey within UNFI. I’m excited to start applying what I’ve learned to my own practices as a supervisor.
- Jannay Contreras, Operations Supervisor, Hopkins DC, Operations Leadership Development Program participant
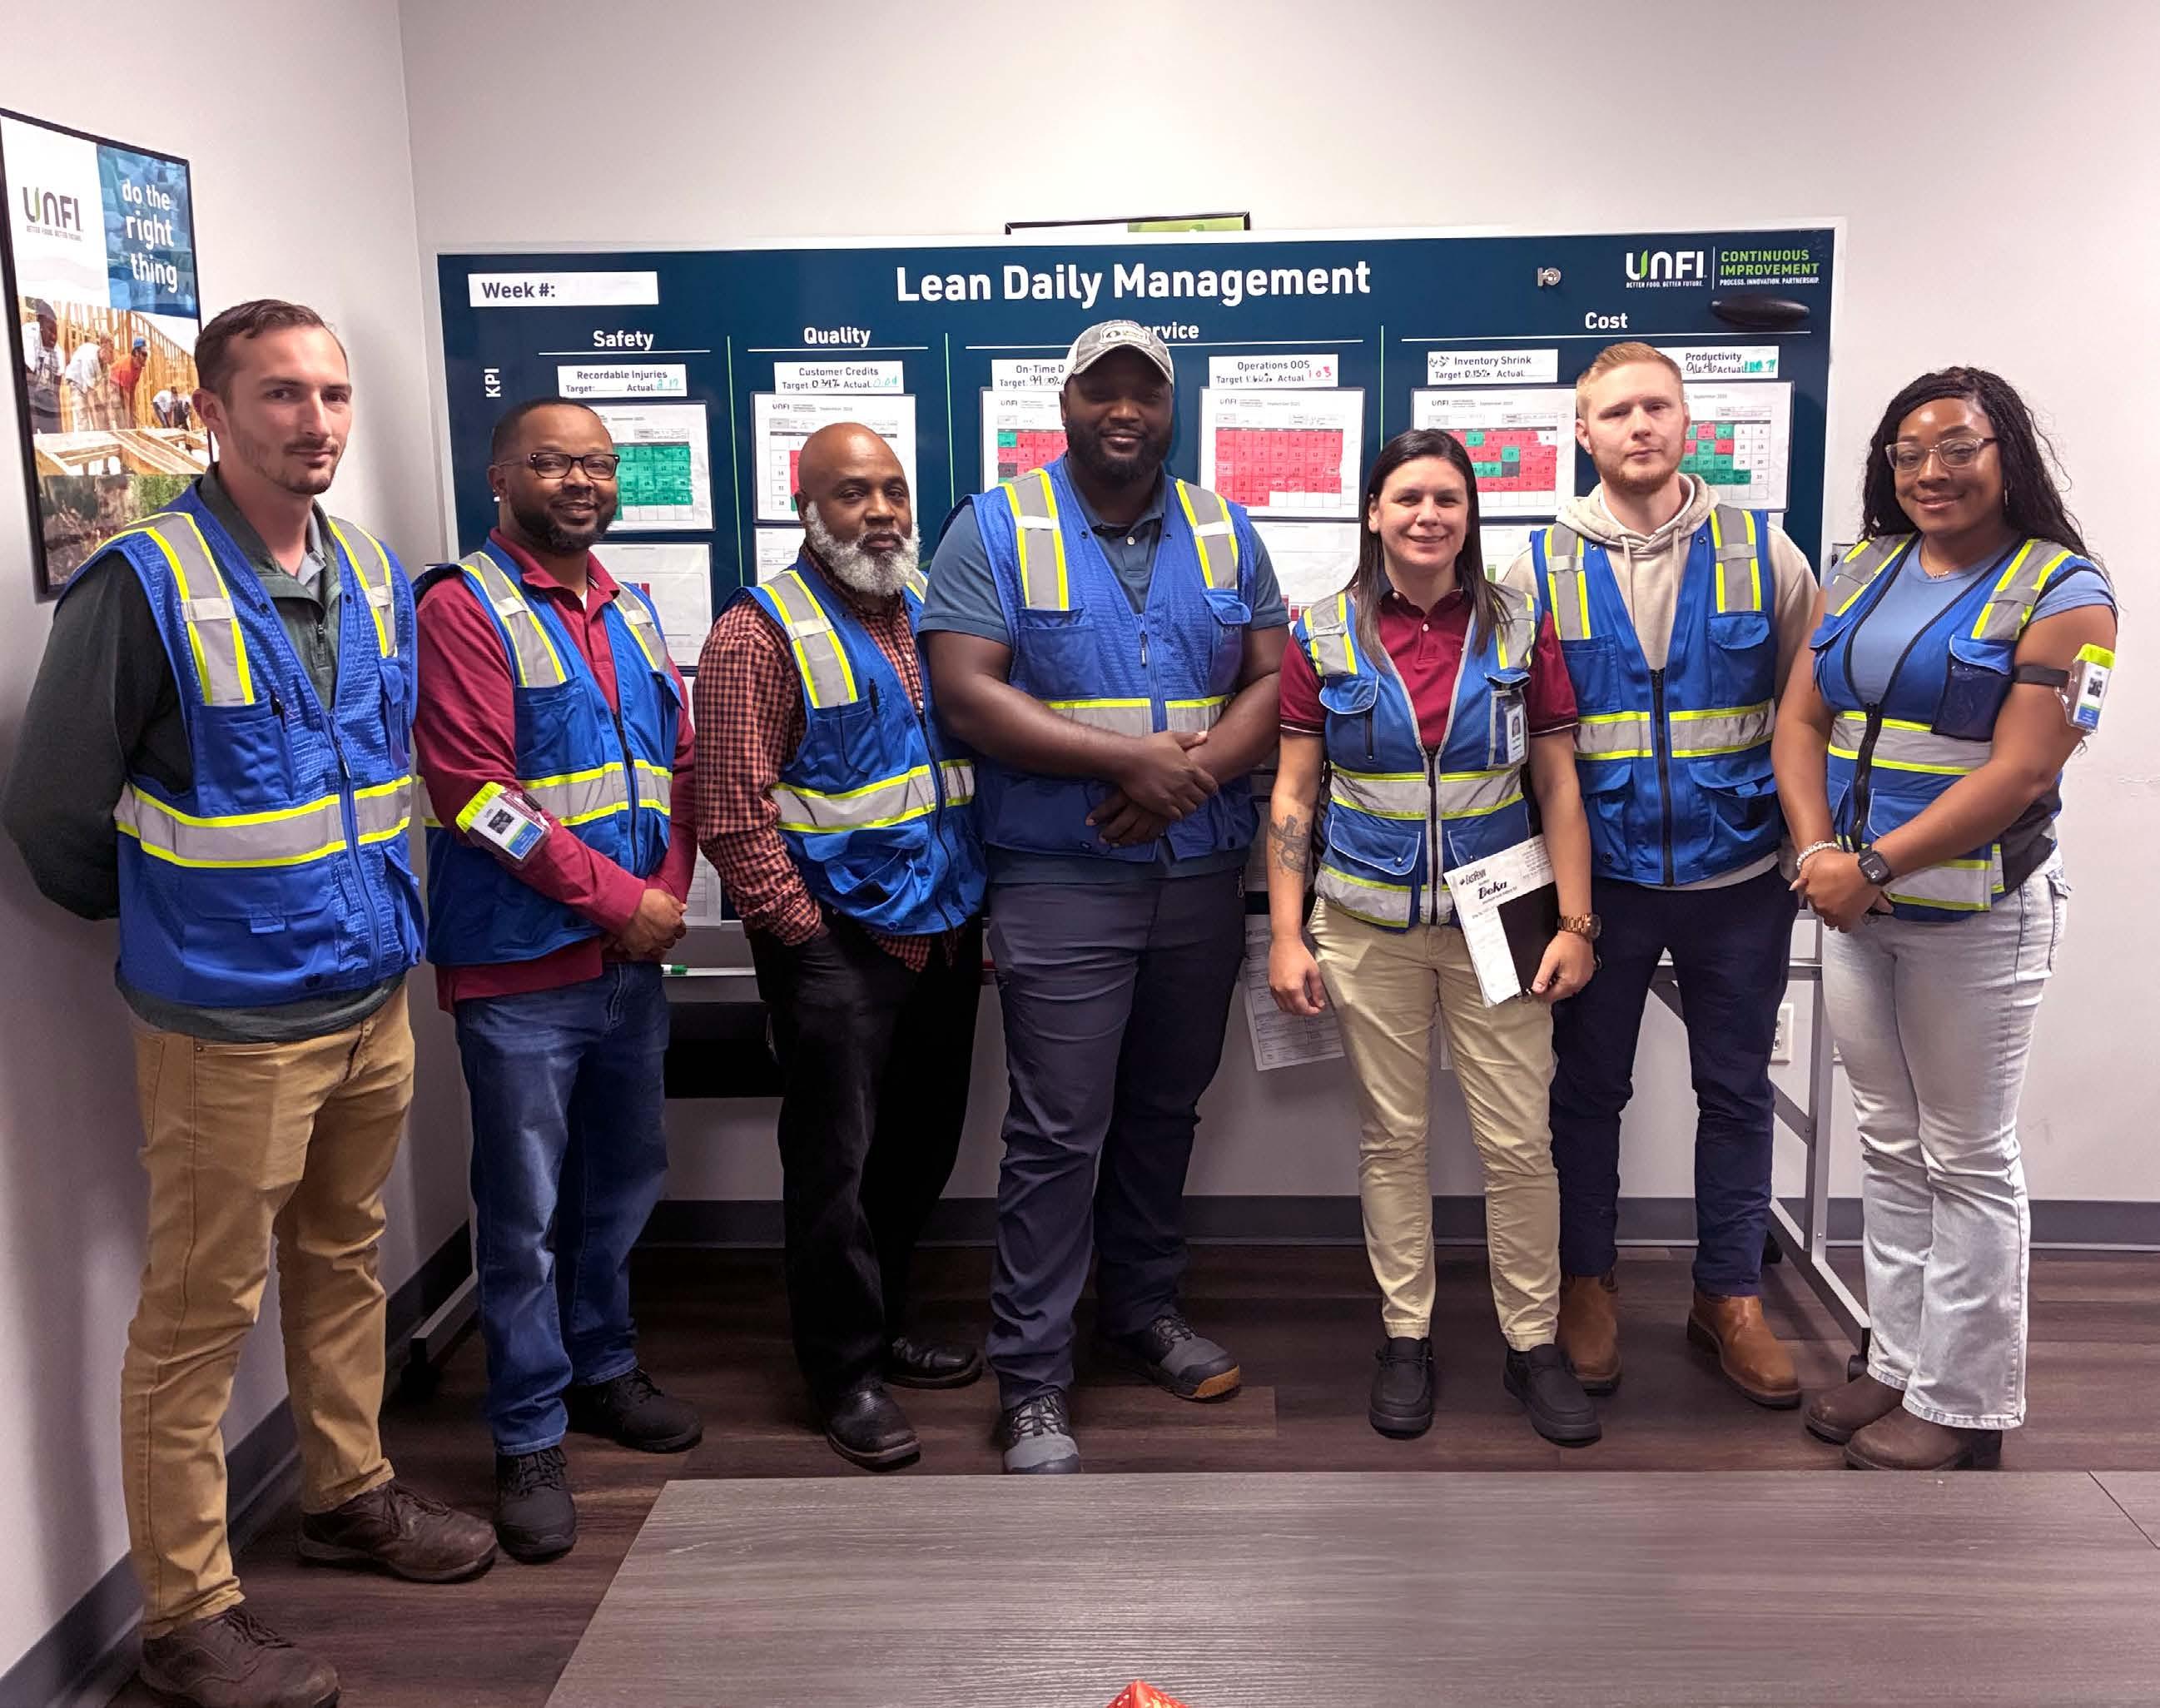
This year, 28 DCs began implementing Lean Daily Management practices to strengthen performance and build a more responsive and efficient supply chain.
Program Highlights :
Leadership Development
This year, we offered multiple development opportunities for associates at every level to build their skills and advance their careers, such as:
Corporate and Wholesale Leadership Programs:
Convened top managers from multiple departments in a "Raising the Bar on Talent" virtual conference, scenario practice, and coffee talks with senior leaders.
Operations Leadership Development Program, Sponsored by WIN-BIG:
Provided operations associates with courses on Leading People and Leading the Business, Real Talk sessions with women leaders, and in-person meetings at the Women in Supply Chain Forum.
Mentor Marketplace:
Connected associates with established leaders through open enrollment, helping associates navigate career paths and achieve development goals.
Building a Culture of Recognition:
Offered training sessions for people leaders focused on how meaningful recognition drives engagement and connection across teams.
Workplace Respect Dynamics—Recognizing and Disrupting Patterns:
Provided tools to help leaders create psychological safety by recognizing how everyday perceptions and workplace dynamics influence decision-making, teamwork, and inclusion.
Workplace Respect Dynamics—Subtle Acts of Exclusion:
Equipped leaders with the skills to strengthen psychological safety by recognizing and addressing subtle acts of exclusion that impact trust, collaboration, and team performance.
117 mentors connected with 168 associates via the Mentor Marketplace
Focus Area:
Efficient & Sustainable Operations
Efficient operations help maximize our resources to reduce emissions and operating costs while improving processes. Efficiency gains compound across our network— each kilowatt-hour saved, mile optimized, and pound of waste diverted from landfills helps reduce our costs while protecting natural resources.
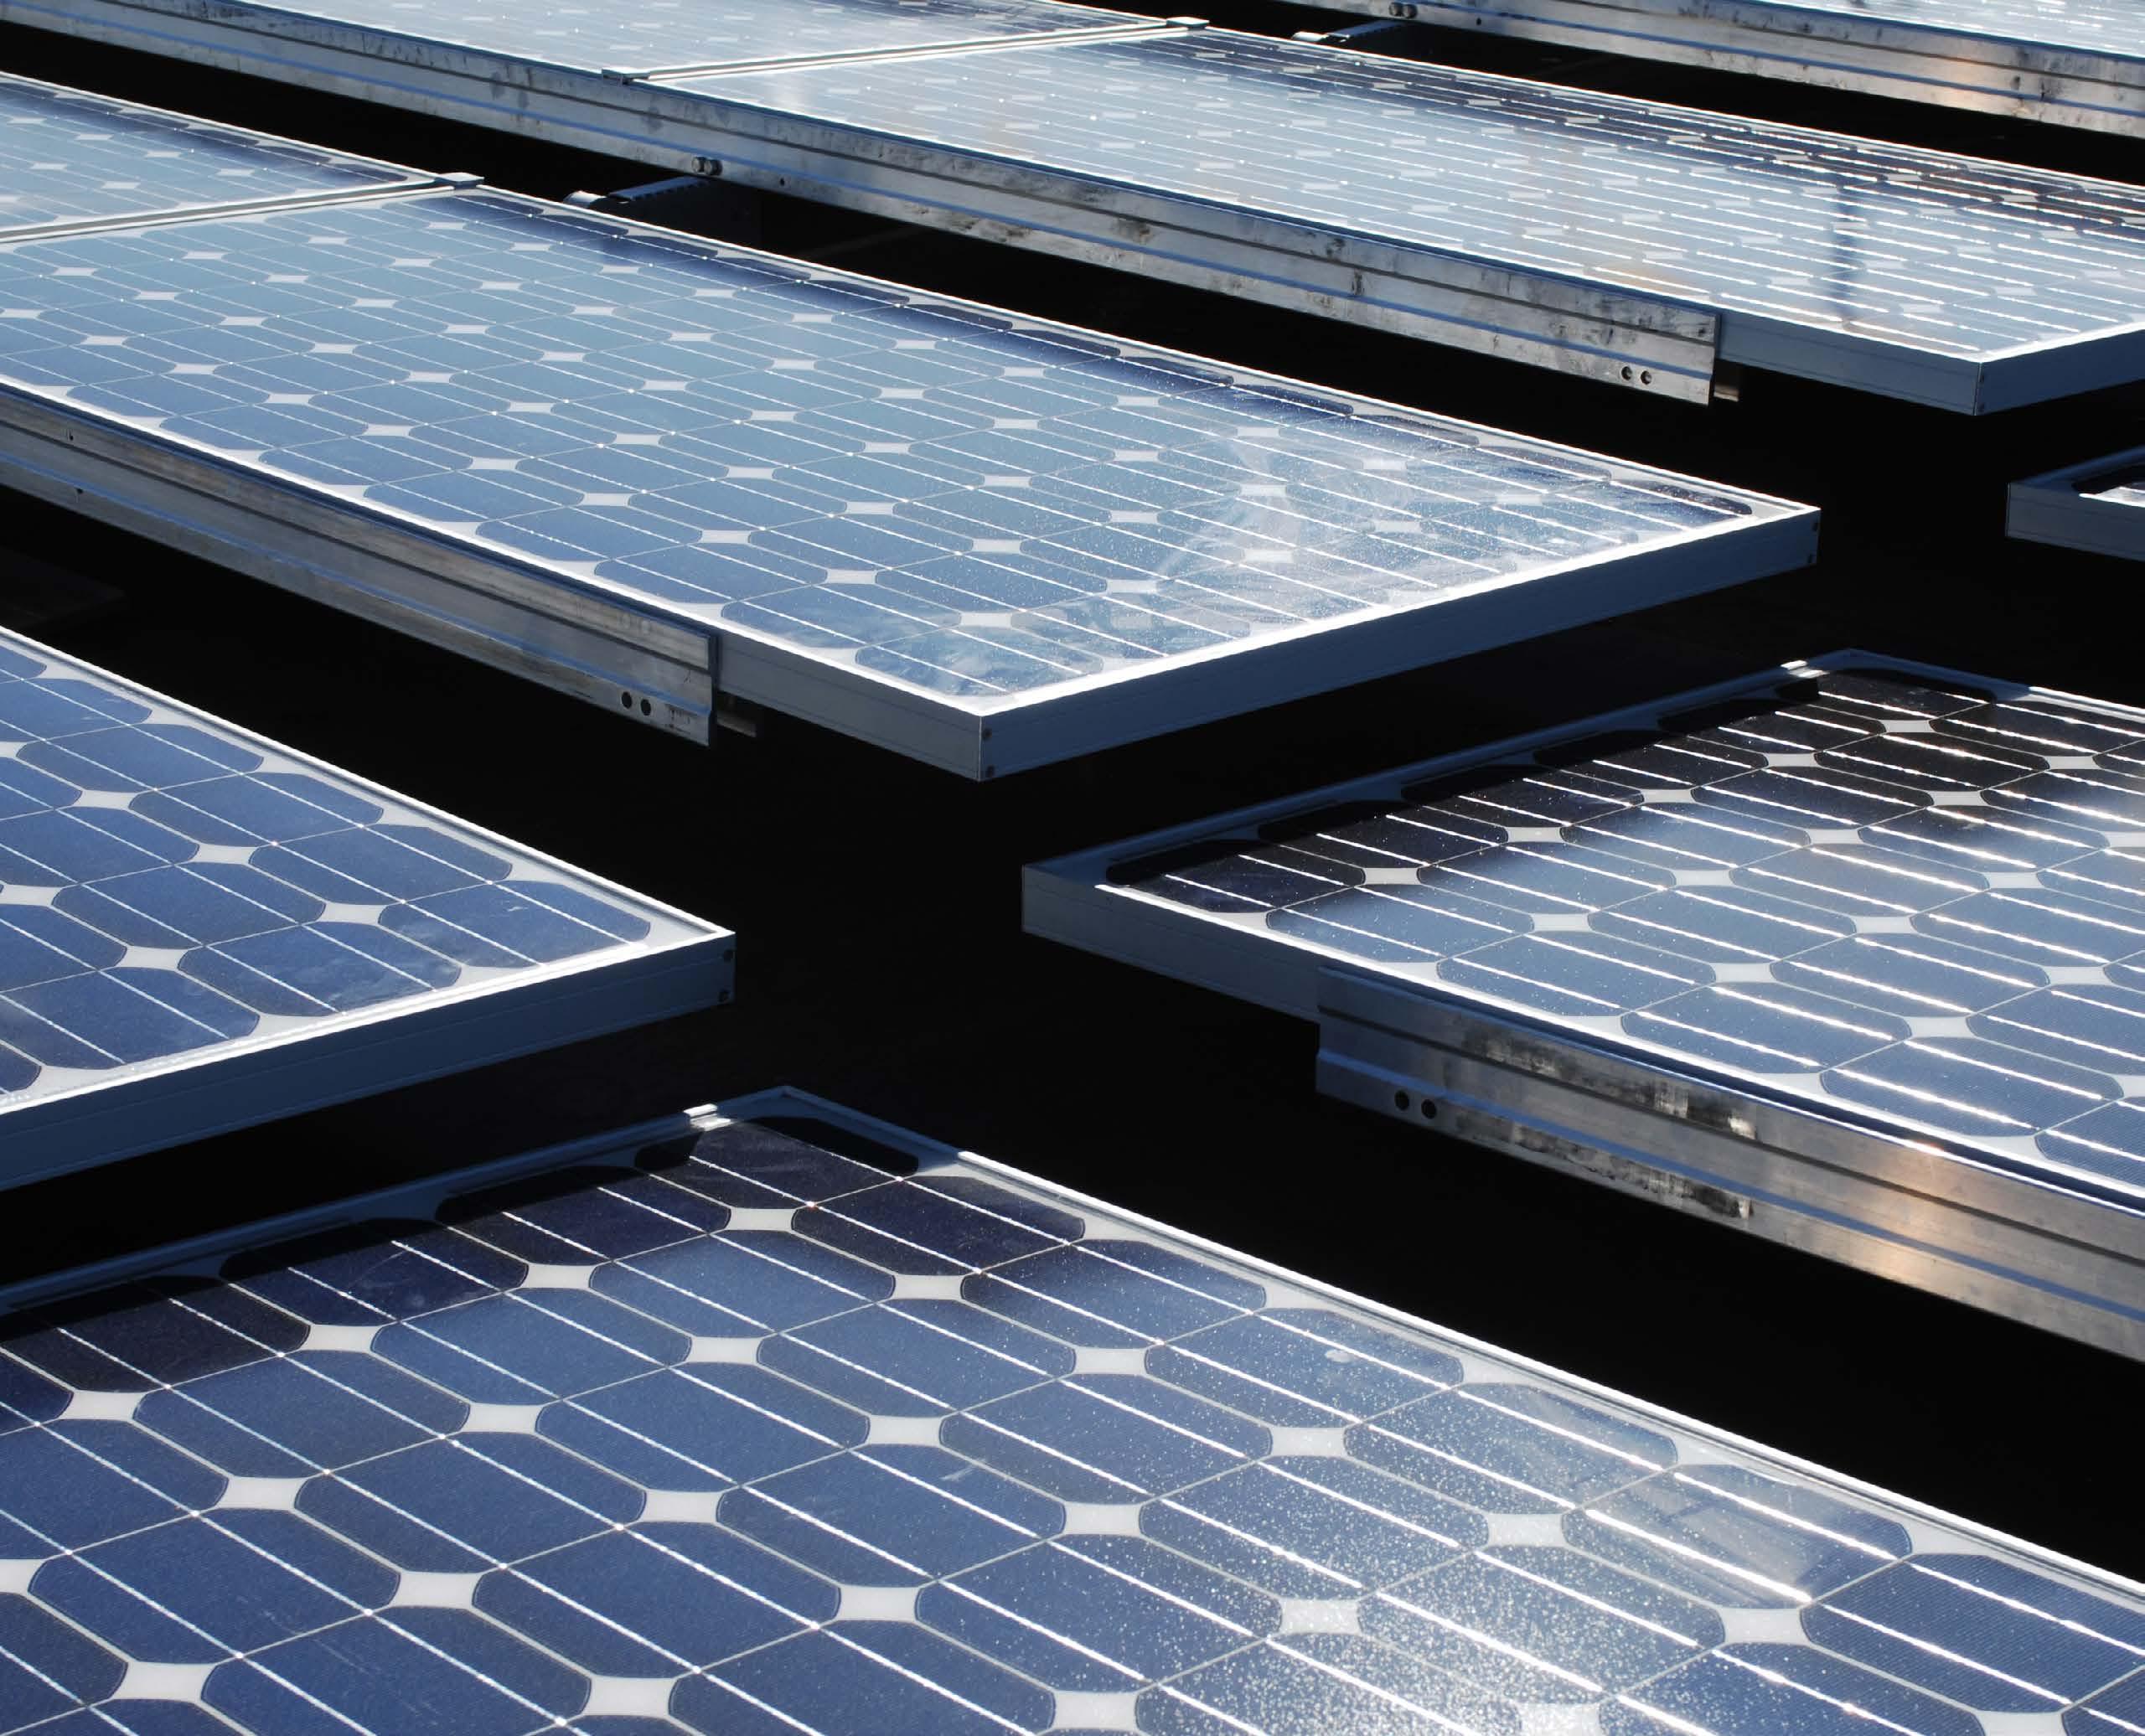
Our efficient operations work comes to life in three key areas: energy efficiency, renewable energy, and fleet electrification. Projects like our 6.7 MW solar array at our Riverside distribution center (DC), completed this year, along with energy tune-ups across our DC network, demonstrate our commitment to smart energy management. This year, we worked to reduce fleet emissions by adding more electric yard trucks as well as electric and hybrid refrigerated trailers, while using advanced telematics to optimize our routes.
We also strengthened our waste diversion programs, diverting products from landfills to salvage, donations, recycling, composting, anaerobic digestion, and animal feed programs.
Topics to be covered:
• Climate Change Mitigation & Adaptation in our Operations
• Energy Use
• Waste Generation & Diversion
Climate Change Mitigation & Adaptation
in Our Operations
We are working to reduce GHG emissions from our facilities and fleet. This operational lens—distinct from our supply chain climate work—targets direct and indirect GHG emissions reductions that can cut utility and fuel costs, increase resilience, and support continuous service during disruptions.
Breaking down our approach:
• Fleet Transformation: Deploying additional electric yard trucks, electric and hybrid refrigerated trailers, and advanced telematics to optimize routes and reduce idling.
• Infrastructure Development: Adapting infrastructure and assets to increase resilience against physical climate change risks.
• Energy Optimization: Implementing initiatives like renewable energy purchases and refrigeration upgrades to improve energy performance and reduce GHG emissions.
This year, we grew our electric yard truck fleet by 9% from the previous year, representing about 18% of our 132 yard trucks, and kicked off a multiyear electrification project at our Gilroy DC.
Gilroy DC: Blueprint for Electric Fleet Transformation
Our Gilroy facility is on track to become UNFI's first largely electrified transportation fleet in 2027. The project will include Direct Current fast charging for 30 electric tractors—meaning power will be delivered directly to the vehicle’s battery, reducing charging times—and a rooftop solar array with battery storage. This system is expected to eliminate roughly 272,000 gallons of tractor fuel from the roads annually, reducing our overall Scope 1 GHG emissions, while also reducing noise and air pollution for nearby communities. Lessons from this infrastructure project will guide future network-wide electrification strategies.
Current Progress: 298gCO2e/tonne-kilometer (a 49% increase from our Fiscal Year 2020 baseline)
Reduce Scope 1 and 3 heavy freight well-to-wheel GHG emissions from transportation by 38% per tonne-kilometer by the end of Fiscal Year 2030.
As a distributor, transportation emissions directly affect our carbon footprint, operating costs, and service quality. Lagging performance on this goal is due to both a reduction in payloaddistance since base year and the lack of substantial reductions in transportation emissions during this time.14
We remain committed to reducing our Scope 1 and 3 heavy freight well-to-wheel GHG emissions from transportation and are investing in projects to support meaningful change. We are continuing to build infrastructure for fleet electrification and emissions reduction— starting with Gilroy's electric fleet transformation project—and to leverage fleet telematics to help identify and monitor efficiency opportunities. We aim to balance operational efficiencies with long-term climate impact reduction.
What are Scope 1 and Scope 3 heavy freight well-to-wheel GHG emissions?
Scope 3 (well-to-tank) refers to our indirect GHG emissions from third party vehicles—emissions generated by all activities that occurred before fuel combustion.
Scope 1 (well-to-wheel) refers to our direct GHG emissions from UNFI owned or leased trucks and refrigerated trailers—emissions generated from the use of fuel in these assets to propel vehicles, haul goods, and maintain product temperatures.
Scope 1 and 3 (well-to-wheel) is the full life cycle of the fuel we use—from extraction and refining fuels to distribution and use.
KEY METRICS
~4% decline in fuel efficiency compared to Fiscal Year 202415
2% reduction in miles traveled compared to Fiscal Year 2024
20% reduction in idle time compared to Fiscal Year 2024
56% of Scope 1 and 2 market-based emissions were fleet emissions in Fiscal Year 202416
53 electric and hybrid trailers in our fleet
24 electric yard trucks in our fleet
14 We currently use the “distance-based” method for calculating transportation emissions; “payload-distance” refers to the weight of the goods being transported, and the distance they are transported.
15 This reduction could be due to changes that have opposing effects on fuel economy. For example, changes in total highway vs. city street miles. We will continue to monitor this metric in the years ahead to ensure we are optimizing our fuel efficiency. UNFI also believes that we may be operating at the upper limits of fuel efficiency with our current tractor technology. Beginning in the next Fiscal Year, we will begin introducing tractors with new diesel power train advancements as part of our efforts to enable additional improvements in miles per gallon.
16 See GRI Content 2-4 “Restatements of Information” for how this compares to FY2023 data.
Energy Use
By optimizing our energy consumption, we reduce emissions from our facilities while increasing cost savings, improving cash flow, and maximizing equipment operating time. This helps us reduce our carbon footprint and improve the efficiency of our operations.
Breaking down our approach:
• Efficiency Upgrades: Implementing advanced refrigeration controls coupled with onsite energy tune-ups.
• Renewable Energy: Expanding solar installations while purchasing renewable energy certificates.
• Energy Regulations and Data: Leveraging benchmarking and reporting requirements to identify opportunities, and accessing utility rebates to offset upgrade costs.
This year we continued advancing our energy strategy. Projects like the Riverside DC solar array, set to be commissioned in early Fiscal Year 2026, and the Gilroy DC solar array with battery storage, scheduled for completion in 2027, demonstrate our commitment to leveraging renewable energy systems. We also continued purchasing renewable energy certificates to help reduce Scope 2 market-based GHG emissions. While upgrading equipment can come at a premium, we continue to pursue rebates and incentives to help reduce costs while promoting energy reduction.
KEY METRICS
42% of electricity sourced from renewables, which is a ~37% increase from Fiscal Year 202417
696,074 MWh of energy consumed, which is ~1.8% less energy than Fiscal Year 202418
10% decrease in energy intensity compared to Fiscal Year 2024
~5% reduction in Scope 1 and 2 GHG emissions compared to Fiscal Year 202319
UNFI’s largest solar array to date at our Riverside DC, is the length of nine football fields and is projected to meet 80% of Riverside’s energy needs.
AHEAD OF SCHEDULE
Current Progress: 213,171 metric tons CO2e (a 47% decrease since our Fiscal Year 2020 baseline)20
Reduce absolute Scope 1 and 2 GHG emissions from all other emission sources by 50% by the end of Fiscal Year 2030.
With a network of 52 DCs, we believe it’s important to focus on reducing our direct and indirect operational GHG emissions. Implementing energy efficiency programs and generating on-site solar energy are key to cutting our GHG emissions while also providing an added benefit of lowering our operating costs.
17 This figure does not include solar power generated from our sites.
18 This includes purchased electricity and natural gas but excludes fleet fuel.
19 See GRI Content 2-4 “Restatements of Information” for how this compares to prior year.
20 Consistent with prior years, our GHG reporting is one year behind the Impact Report’s temporal boundaries; we are reporting on FY2024 GHG inventory in the FY2025 report.
Finding Hidden Savings: Energy Efficiency Tune-Ups
Energy assessments help us identify opportunities in our warehouses where we can improve our operations while reducing our impact on the planet. We learn how to optimize refrigeration, HVAC, and other systems—finding simple adjustments that can improve efficiency and yield meaningful returns. For example, this year’s assessment at our Stockton DC helped save enough energy to power 143 households annually.21 Through these assessments, we are seeing facilities achieve up to 15% in energy savings—particularly from refrigeration, which accounts for the majority of energy load in DCs with cold storage.
Energy efficiency is about reducing waste and optimizing our operations, leading to savings and fewer greenhouse gas emissions from things like refrigeration or lighting.
—Nate Lapides, Senior Manager, Climate and Energy, UNFI.
Waste Generation & Diversion
We are committed to reducing the amount of waste we generate and rerouting waste away from landfills through salvage, donations, and alternative waste stream options such as animal feed, compost, anaerobic digestion, and recycling. These efforts are critical to reducing our impact on the planet.
Waste generation refers to the amount of waste produced across our operations while waste diversion measures how much of that waste is redirected away from landfills.
Breaking down our approach:
When food waste ends up in the landfill it produces methane, a potent GHG gas, making waste diversion an important part of our strategy to reduce emissions.
• Salvage Program: Offering imperfect but usable food products at discounted prices to value-driven retailers.
• Donations: Routing excess inventory to food bank partners through improved processes and training.
• Material Recovery: Implementing enterprise-wide recycling and waste diversion programs to significantly reduce landfill contributions and promote a zero waste culture.
• Strategic Partnerships: Working with specialized vendors to customize waste stream management while strengthening internal processes and partnerships.
This year, we focused on improving our inventory tracking system and solidified our partnerships with community food banks to strengthen our food rescue program. We expanded our salvage offering to include UNFI-owned brands products, which contributed to a 5% year-over-year increase in salvage revenue while reducing the amount of product that ends up in the landfill.
Top photo courtesy of Hmong American Farmers Association, UNFI Foundation grantee
Current Progress: 85% of waste was diverted from landfills.
Achieve zero waste to landfills from DCs by 2030.
Our zero waste to landfills goal is aligned with the Zero Waste International Alliance’s recommendations that to achieve “zero,” we must divert at least 90% of waste from landfills, incinerators, and the environment.22 In Fiscal Year 2025, we diverted 85% of waste from landfills.
This year, we included pallets in our tracked diverted materials, which are often reused or recycled but had previously been excluded, leading to a significant increase in non-food materials recycled. Excluding pallets, our diversion rate would be 78%, which is an 8% improvement from Fiscal Year 2024.
Further, while we continued to use waste audits to estimate food sent to landfills and inform our program strategy, we are working to improve our methodology. Additional information on our waste methodology can be found in the appendix.
KEY METRICS
We know that collaboration is key to achieving our zero waste to landfills goal. We are working closely with our waste vendors to help us achieve this goal, including bringing on a new partner to help streamline our data and tailoring diversion solutions to each facility. We will continue investing in the capacity of our DC teams to optimize our waste efforts.
~80,927 metric tons of non-food materials recycled
~142,637 metric tons of waste generated
~48,486 metric tons of food waste generated 23
~ 34% of total waste generated was food waste
~85% of food waste diverted from landfill
~65,391 metric tons of CO2e avoided through food waste diversion programs 24
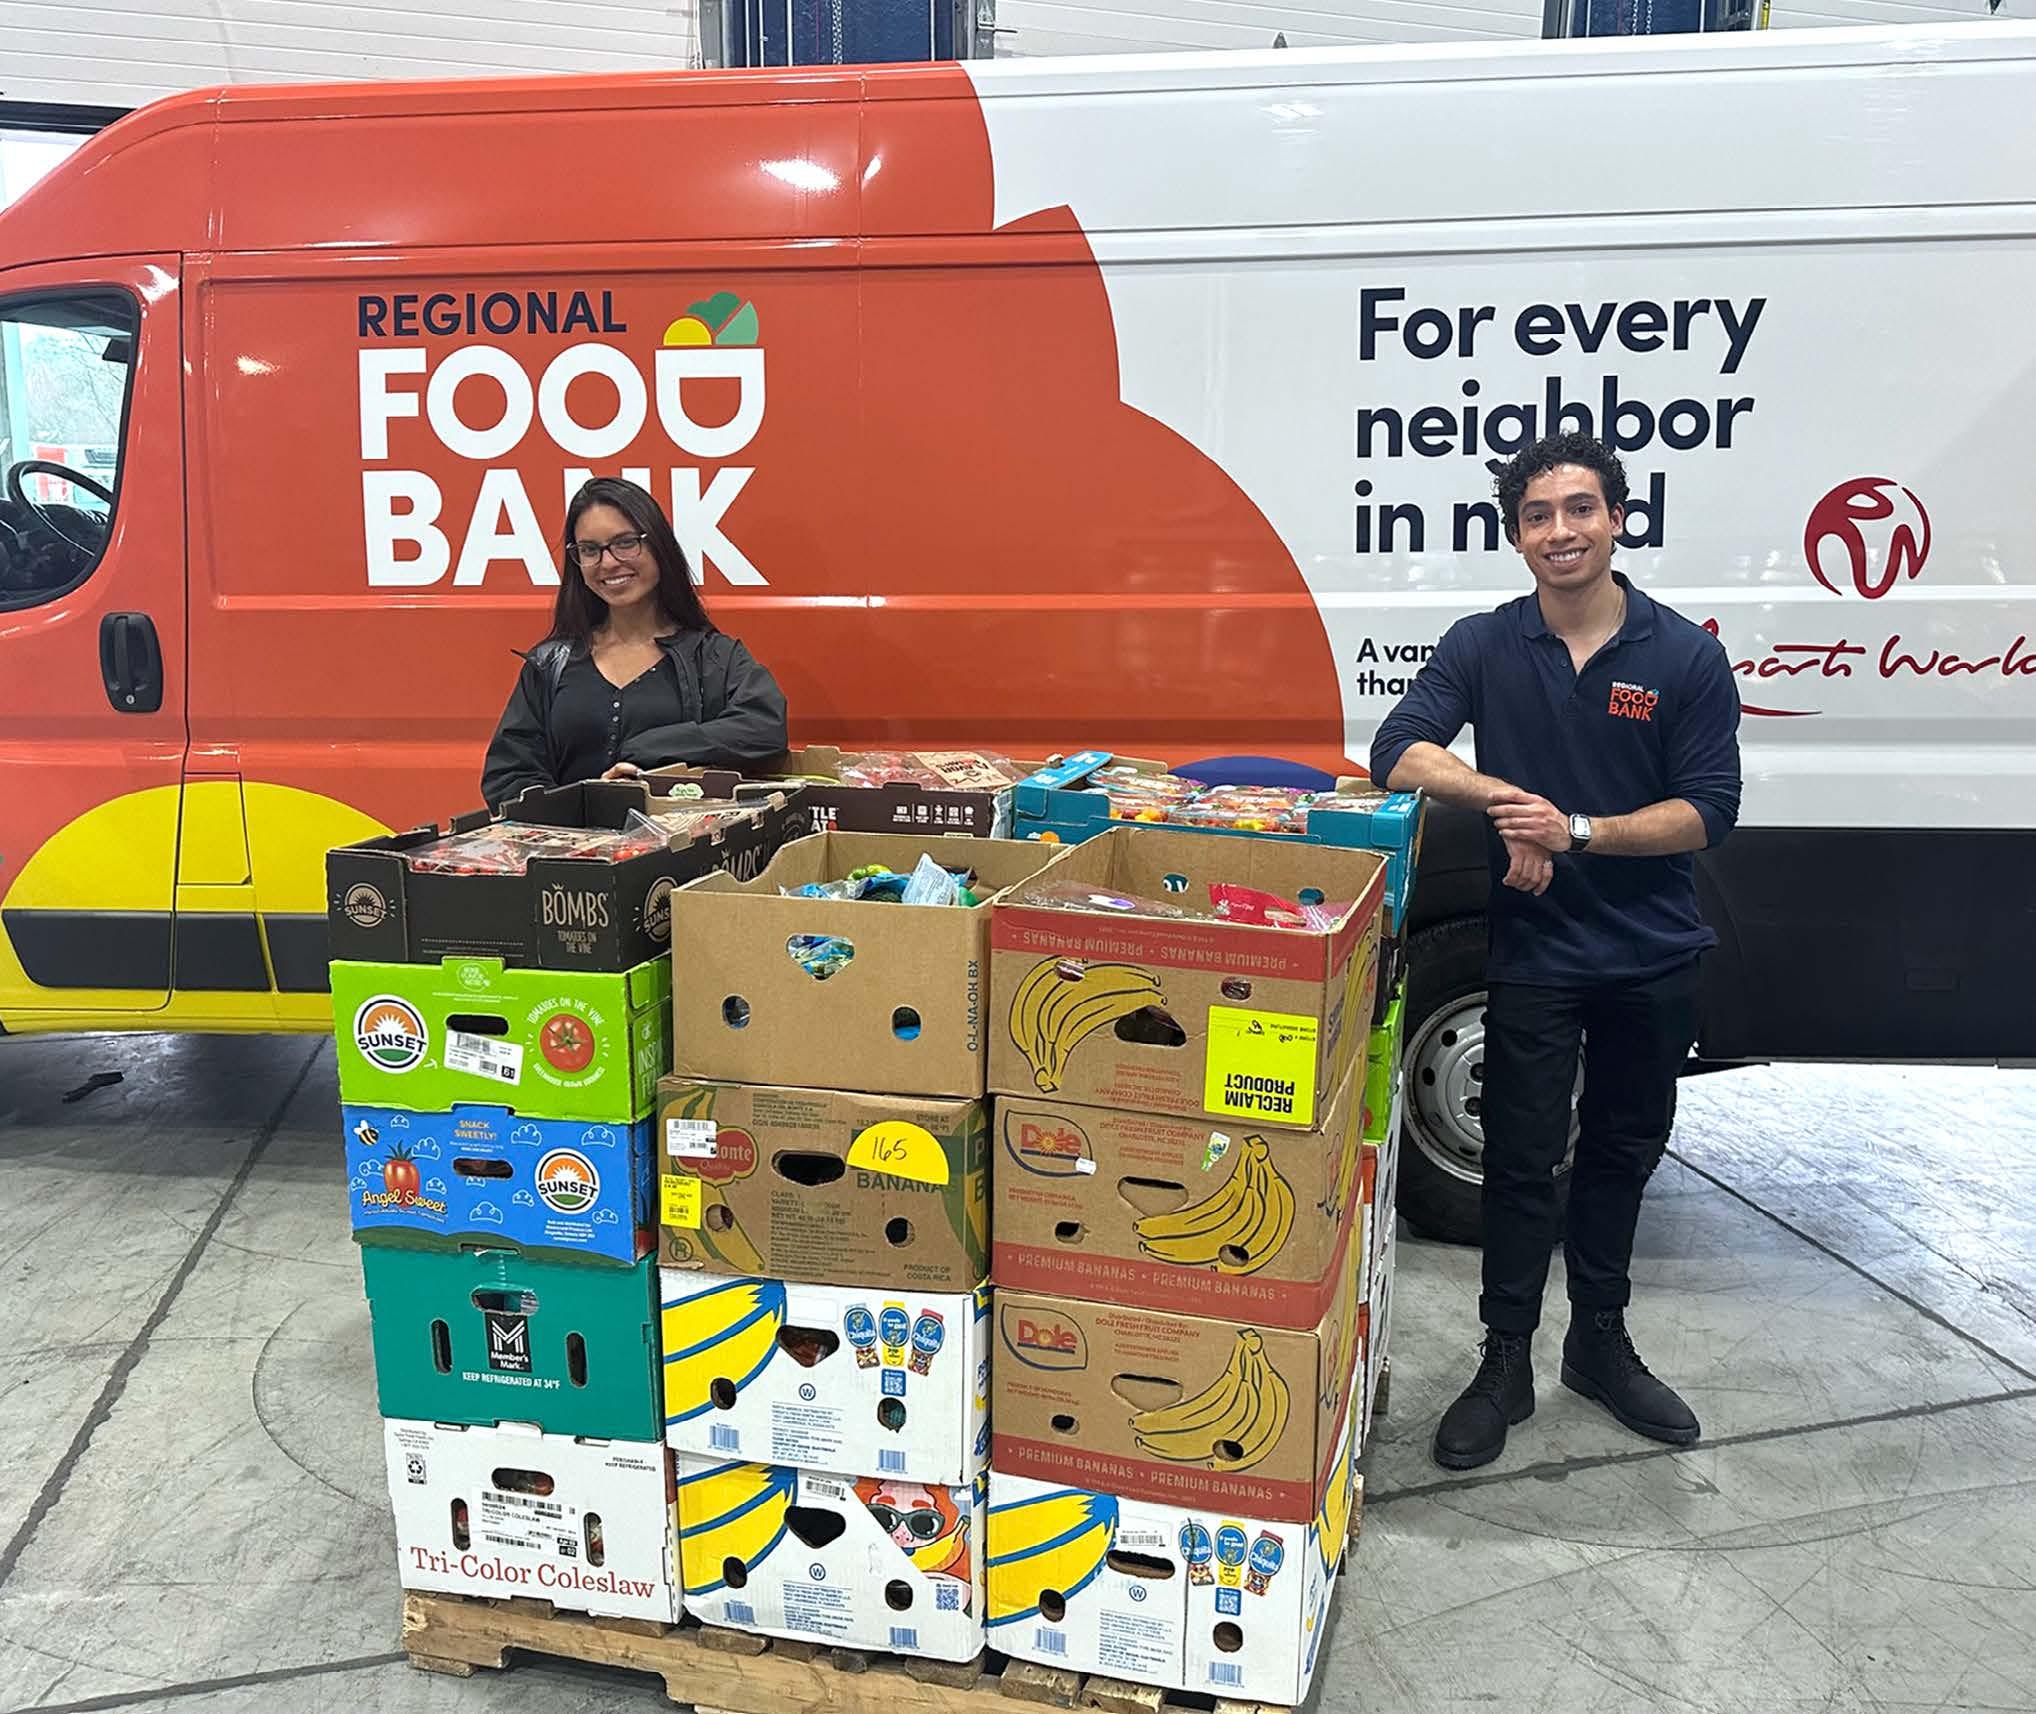
Salvage and Donation Services: Preventing Waste, Feeding Communities
This year, we expanded and enhanced our internal system for tracking inventory and reducing waste, which went live in Fiscal Year 2024. We hosted site-specific trainings and partnered with key stakeholders, including Inventory Control, Procurement, and Sustainable Operations, to equip DCs with the tools for implementing this system and leveraging it to make more data-driven decisions in a timely manner.
For example, when a product is nearing expiration, the DC teams are more empowered to make informed decisions about where to route it—to salvage, for donation, or for an alternative waste stream. As a result, more products are being removed from shelves before expiration to be donated or resold and, importantly, kept out of landfills.
Focus Area:
Nourished Communities
We believe that communities are nourished in many ways: when people have consistent access to safe and nutritious food, when local economies are flourishing, and when the food system supports growers and eaters.
UNFI plays a unique role in fostering nourished communities through our UNFI Foundation grant programs, safety certifications that help ensure quality across our network, food donation programs that recover excess food for communities, and our owned brands portfolio that expands access to affordable and nutritious options.
• Community Health & Food Safety
• Food Access
• Community Livelihood Topics to be covered:
Top photo courtesy of CCOF, a UNFI Foundation grantee, via Liz Birnbaum at the Curated Feast.
Community Health & Food Safety
As a leading food distributor, upholding public health through rigorous safety standards and empowering informed choices through transparent product labeling is core to our operating principles. This not only ensures we meet regulatory requirements but builds consumer trust and enables retailers to serve their communities’ unique dietary needs.
Breaking down our approach:
• Food Safety Infrastructure: Promoting SQF certification standards, temperature monitoring, and sanitation and pest control systems preventing contamination and enabling rapid issue resolution.
• Training Excellence: Deploying comprehensive annual training to ensure warehouse associates, drivers, and retail associates understand their roles and responsibilities in supporting the food safety program.
• Product Accessibility: Offering USDA Organic, Non-GMO Project Verified, Kosher, and other certifications, making these options more affordable for all communities.
• Transparent Information: Providing clear labeling and shelf-edge technology, helping shoppers identify products that meet allergen, dietary, and religious requirements.
This year, we continued working to protect communities through comprehensive Food Safety and Quality Assurance (FSQA) programs spanning our network. Technology monitors temperatures during transport, while standardized procedures maintain consistency across facilities.
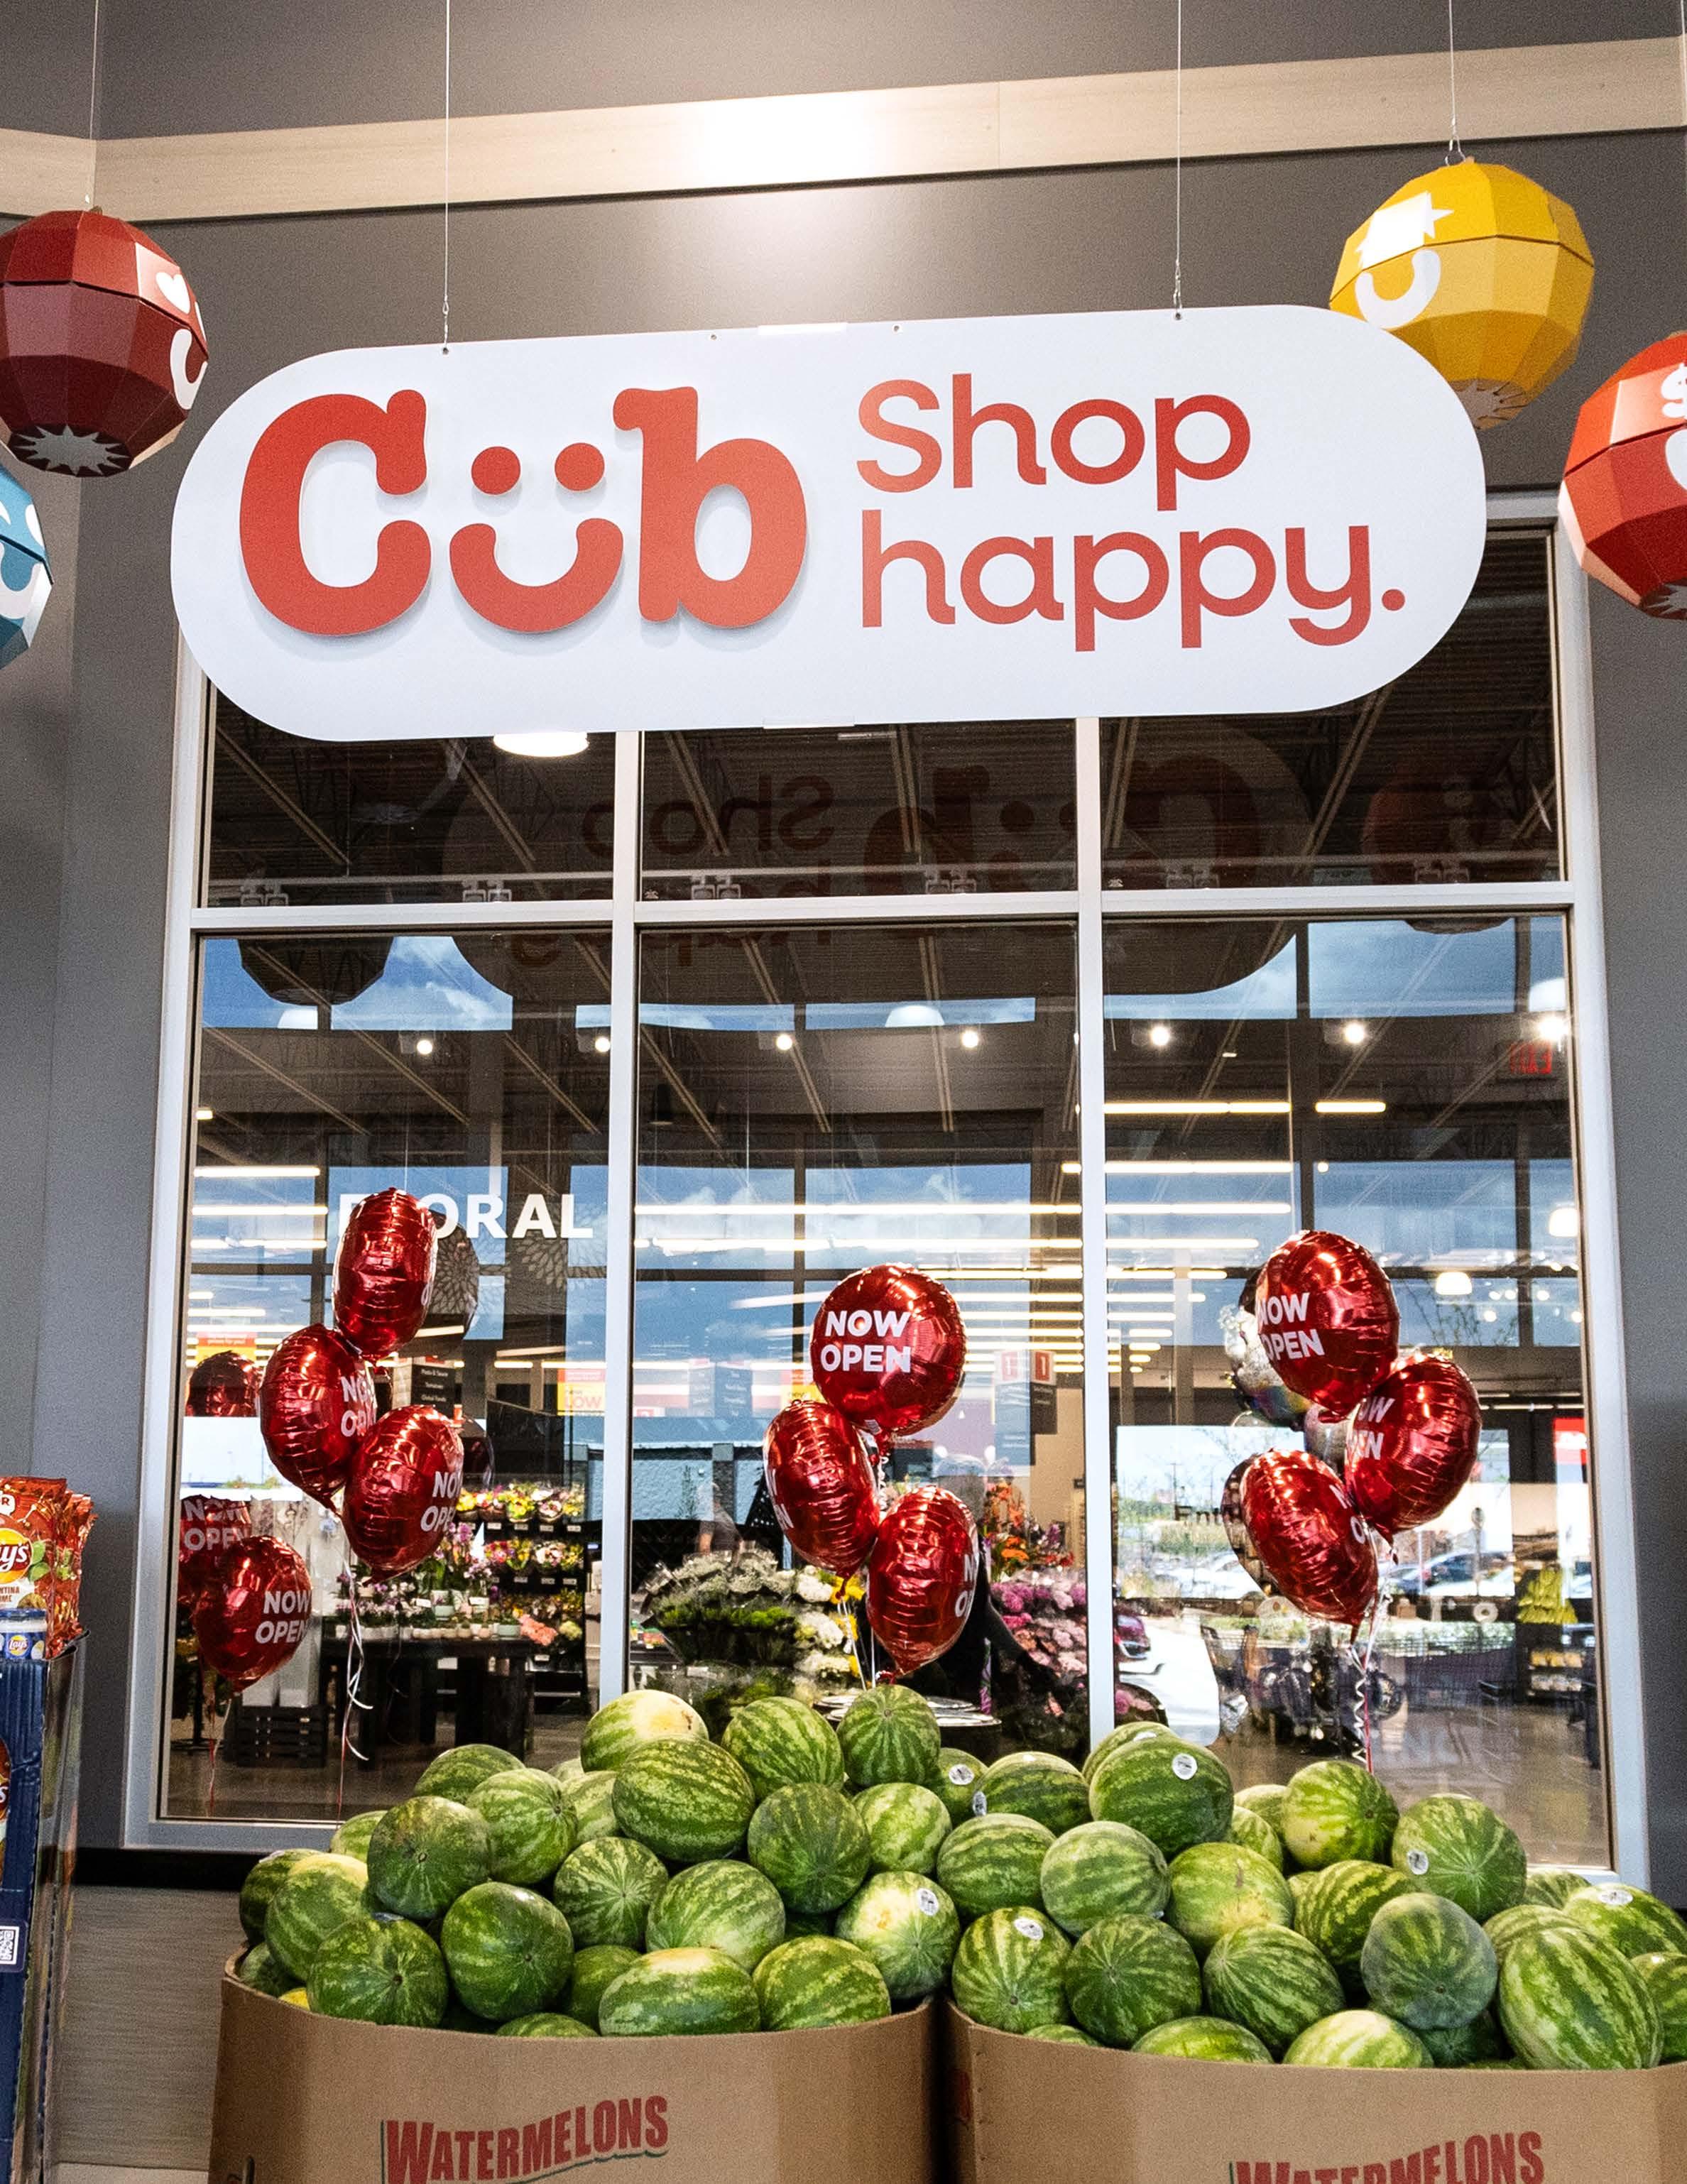
This
year, UNFI launched Shop Happy, a new brand platform for its Cub stores that aims to provide an elevated experience for shoppers.
ACHIEVED
Achieve SQF certification at all eligible DCs by the end of Fiscal Year 2025.
We completed SQF certification across all eligible DCs, meeting the gold standard in food safety management. This network-wide achievement promotes consistent safety protocols from warehouse to shelf, giving customers confidence that products move through facilities meeting the industry's most rigorous standard.
DISCONTINUED
Strive for a “Green” Ecolab Retail audit rating at all our retail stores.
Since Fiscal Year 2021, we have worked with Ecolab, a global leader in food safety, to conduct regular audits of our retail stores to ensure strong food safety protocols are in place and properly followed. We have reported on the rolling average of “Green” ratings from monthly audits at applicable retail locations and, while we have seen steady improvement year-over-year, we want to take this work to the next level.
As we continue to improve our processes within our retail business, we are enhancing our audit procedures to standardize and pursue best in class practices. We anticipate rolling this out across retail locations in Fiscal Year 2026.
While we will be reassessing the best and most accurate way to measure our food safety goals for our retail locations, we believe this new approach demonstrates our unwavering commitment to food safety excellence.
KEY METRICS
224 total product categories supported by our owned brands portfolio
4,413 unique owned brand SKUs
44% of owned brand SKUs are labeled as Kosher
96% average SQF score across our DCs
93% combined average scores for internal and external audits of food quality and safety across our DCs
SQF Certification: A DC Network-Wide Achievement
SQF certification is a globally recognized and comprehensive framework for food safety that aims to guarantee the safety of food products across the supply chain. This year, we achieved our goal of reaching 100% SQF certification across all eligible DCs—those that carry foods—by onboarding the remaining five facilities. Meeting the criteria required to be SQF certified required redesigning workflows, installing monitoring equipment, and completing many hours of training.
We are proud of the work our teams put into implementing and maintaining SQF systems across our DC network. We believe that through this certification, we are not only streamlining food safety procedures, but improving the quality of products we distribute.
At UNFI, food safety is more than compliance—it is a shared commitment to building a world-class food safety management system across our network of distribution centers. Through collaboration, innovation and accountability, we’re protecting consumers, delivering trusted products, and contributing to a healthier, more resilient food system for the communities we serve.
- Tehzin Chadwick, SVP, Safety, UNFI
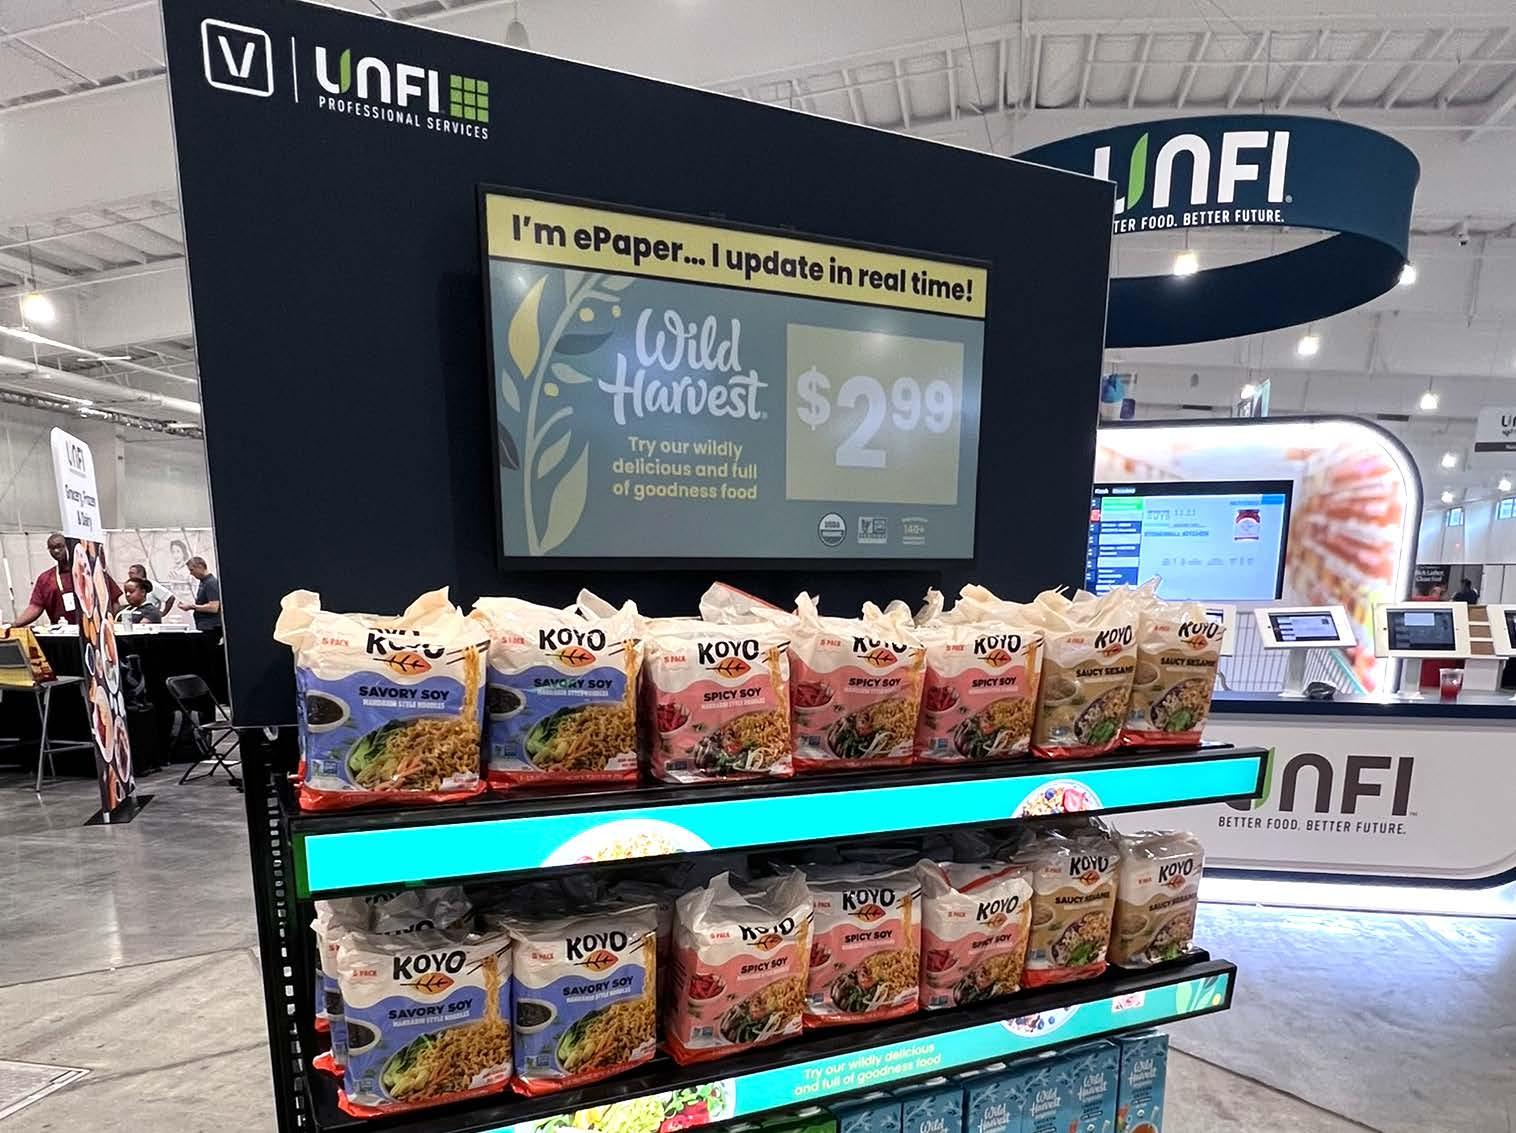
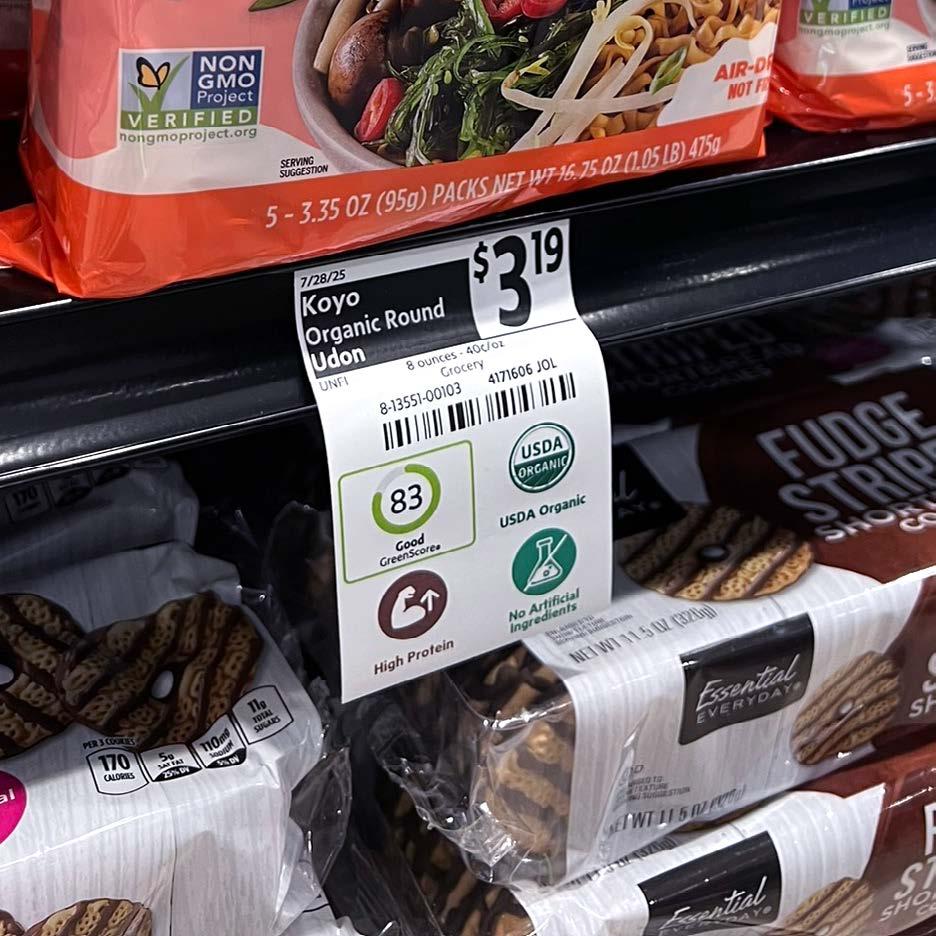
Healthy Shelf Labels: Intelligence at the Shelf Edge
This year, UNFI Professional Services partnered with food health and sustainability intelligence platform, GreenChoice, PBC, as part of a suite of offerings provided to our retailers to enhance consumer experience and drive sales.
GreenChoice provides science-based food, health, and sustainability scores and data on over one million verified items across 70+ attributes including organic, gluten-free, no artificial ingredients, heart-healthy, minimally processed, and more. Colorful and eye-catching shelf tags help customers quickly find products matching health needs, dietary restrictions, or values.
Retailers using GreenChoice’s Healthy Shelf Labels report up to 30% sales increases in tagged categories, driving more informed purchases. We are excited to bring this service to small and independent stores, helping them expand their merchandising capabilities, use real-time data to meet community-specific needs, and increase sales.
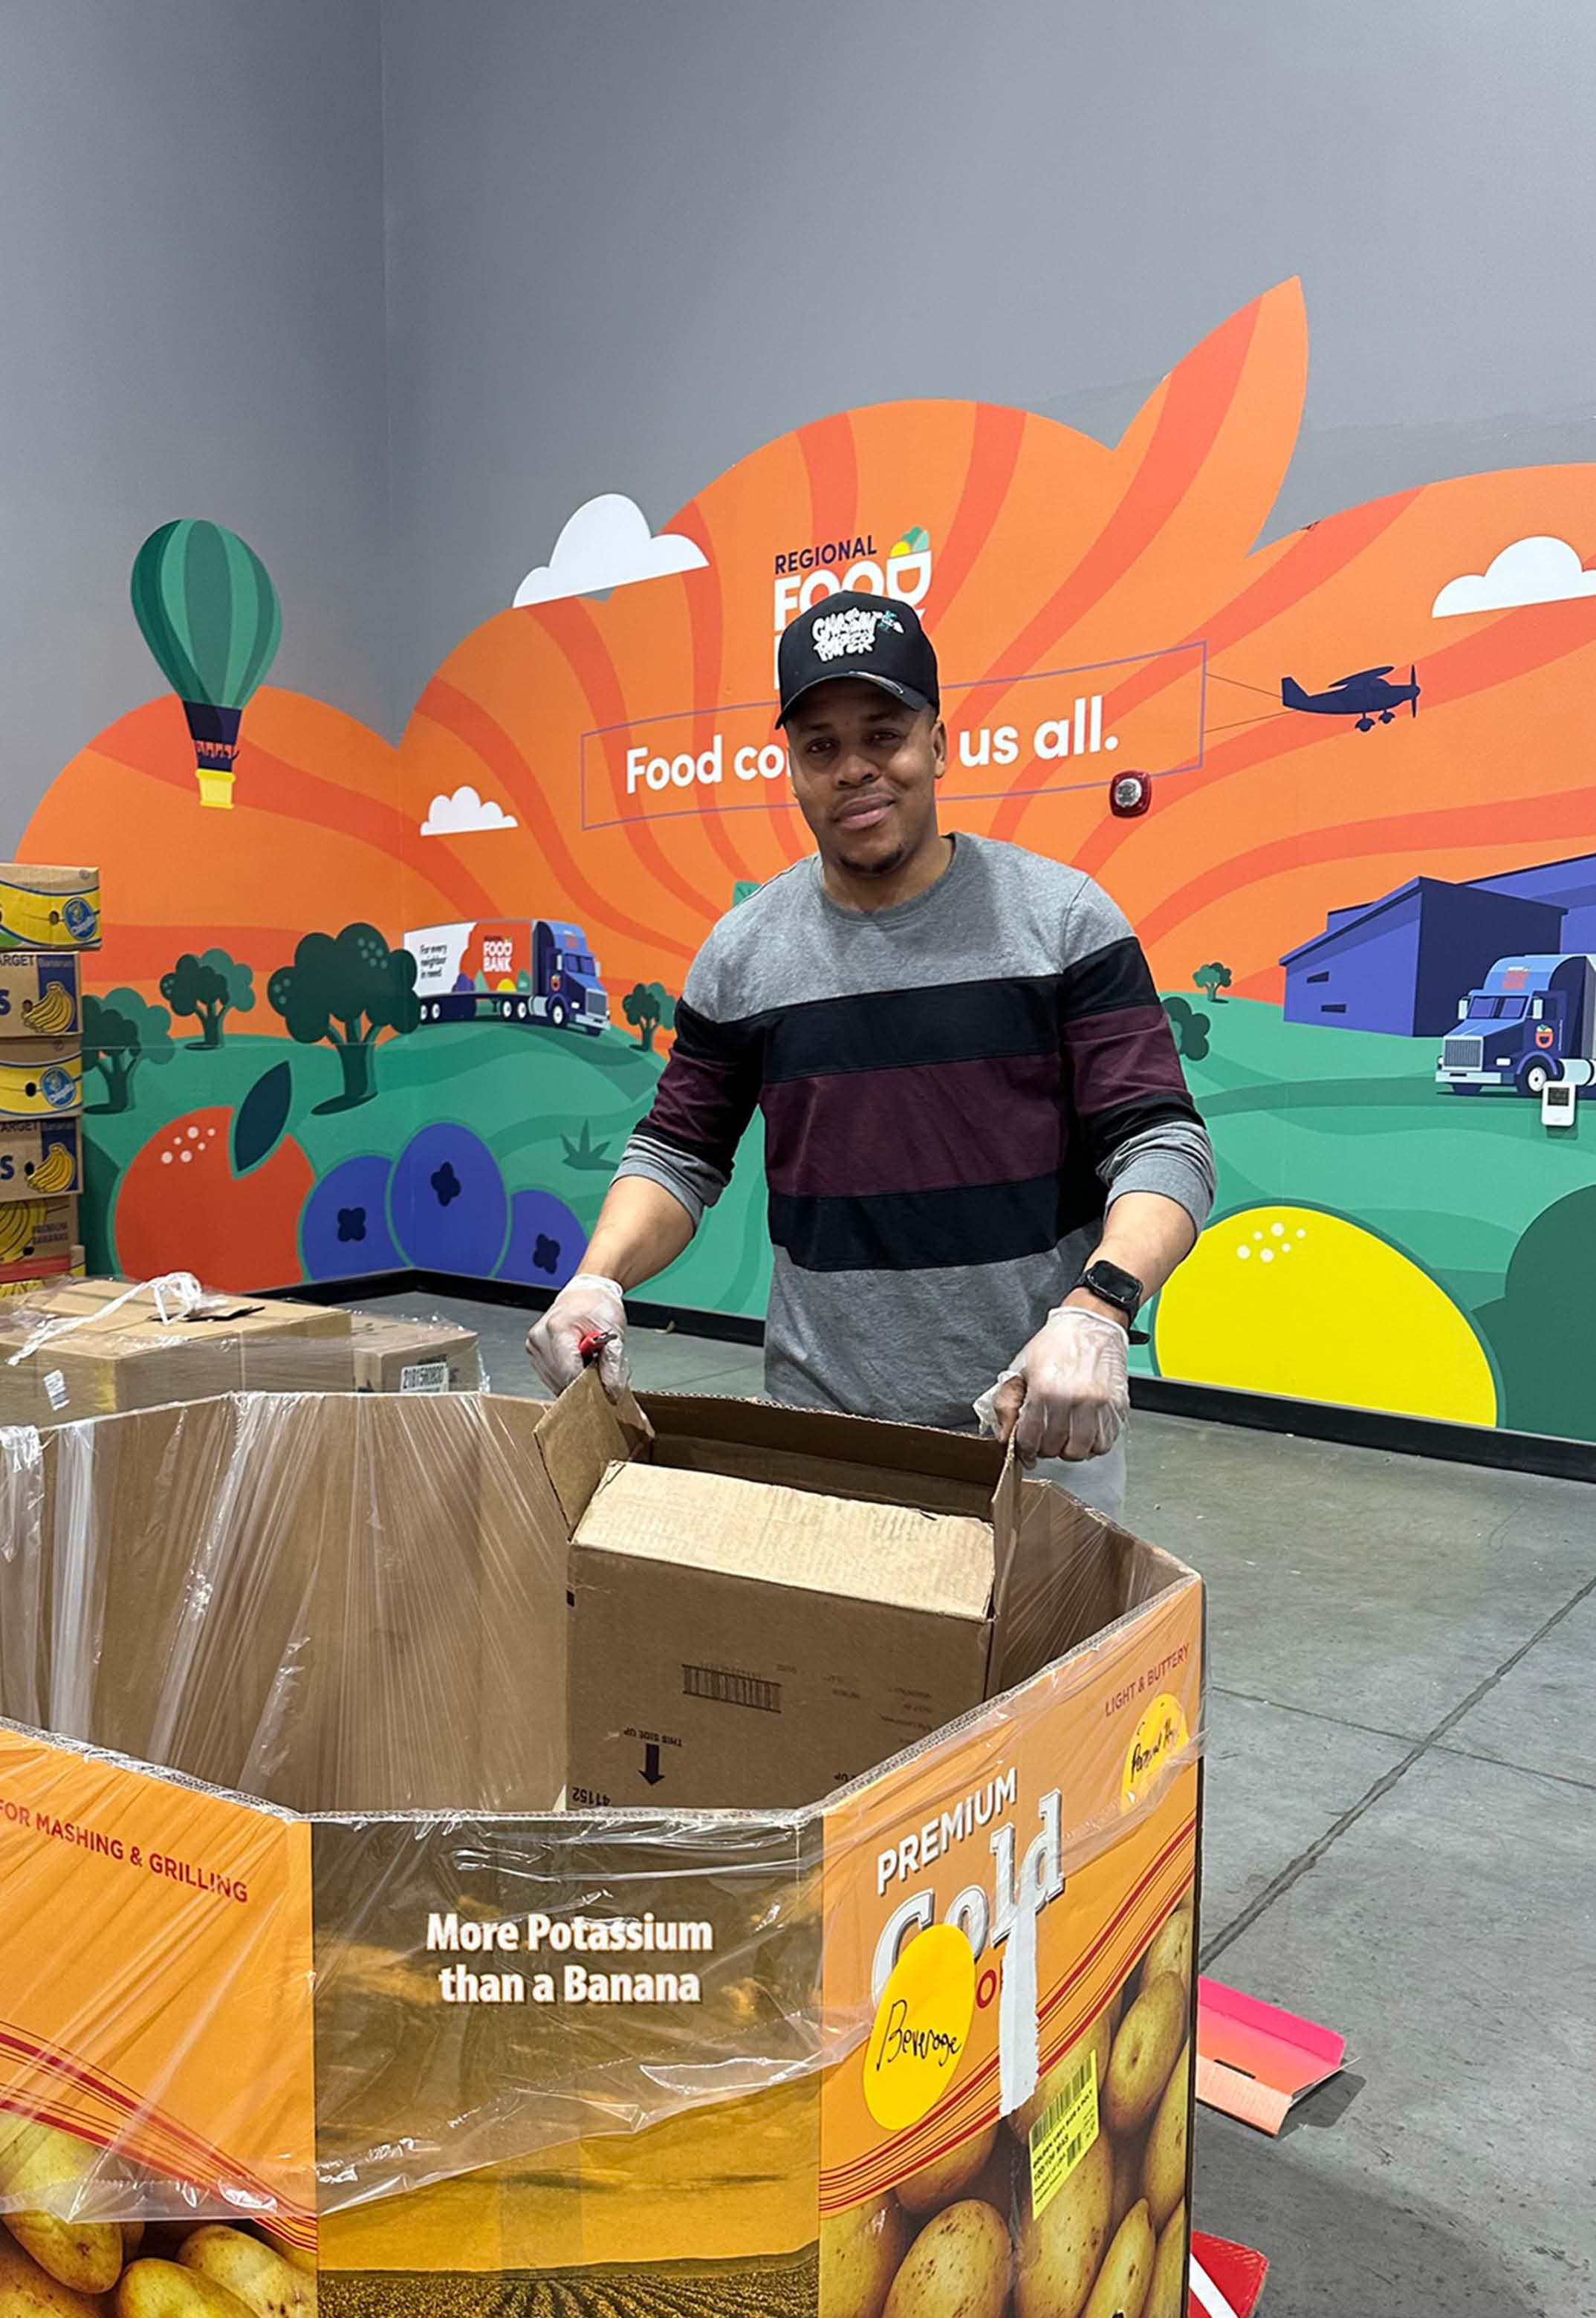
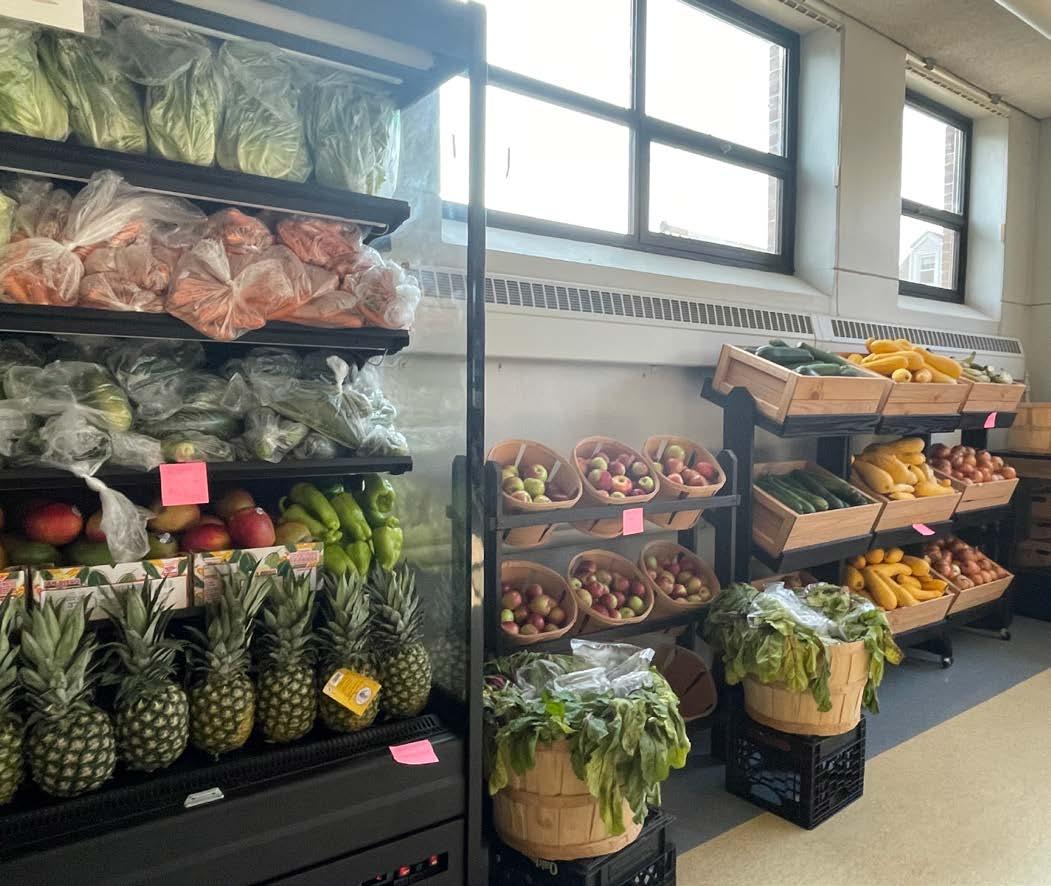
Food Access
We seek to support the consistent availability of nutritious, affordable food for all communities. By expanding product offerings in underserved markets, investing in food recovery, and supporting innovative solutions through the UNFI Foundation, we are well-positioned to help increase access to healthy food.
Breaking down our approach:
• Food Recovery Systems: Capturing products with packaging damage or approaching expiration dates and routing them to food banks and community organizations.
• Nutrition Incentives: Providing UNFI Foundation grants to nonprofit organizations implementing programs that double SNAP benefits for produce purchases and expand Veggie Rx programs.
• WIC Enhancement: Expanding nutritional options available to mothers and children through improved owned brands product offerings.
• Community Grantmaking: Empowering organizations already embedded in communities to address the root causes of hunger.
This year, we strengthened our food recovery efforts at UNFI selling shows, enhanced our owned brands WIC program, and grew our philanthropic impact.
Right photo courtesy of Good Neighbors, a UNFI Foundation grantee.
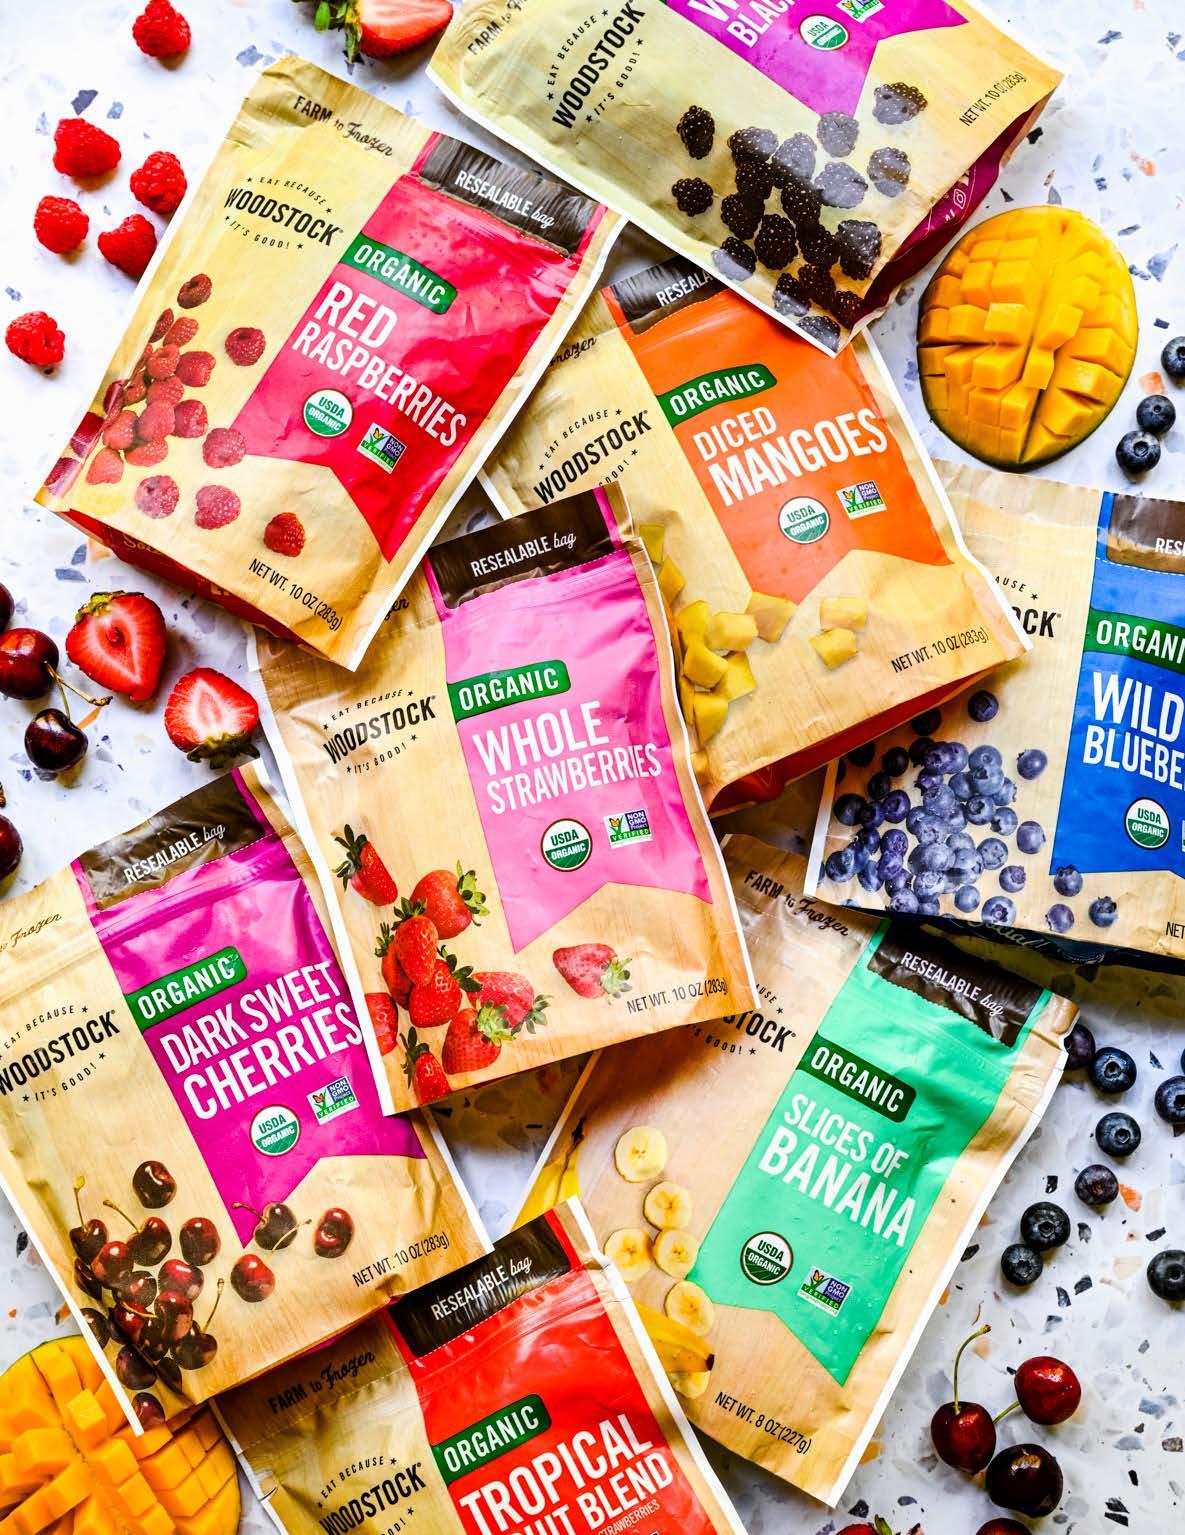
UNFI’s Owned Brands:
Great Tasting Food at Competitive Prices
Our private label portfolio makes nutritious food affordable without sacrificing quality. With eight core brands across value tiers and over 4,400 SKUs, our owned brands’ products undergo rigorous testing to match or exceed national brand standards. Private brands also typically cost 20-30% less than comparable options. This year, we focused on enhancing our owned brands’ offering of WIC-eligible products by working directly with state WIC departments to collect redemption data. We are proud to share that participants used over $9 million worth of benefits to purchase from the 800+ eligible items we offer. These insights enable us to better serve families who rely on WIC.
UNFI Foundation:
Empowering Community Solutions
Through grantmaking, impact investing, and volunteering, the UNFI Foundation goes beyond traditional corporate philanthropy to help build resilient, equitable, and sustainable food systems. This year, the UNFI Foundation provided $1.8 million in funding to nonprofit organizations across the U.S. and Canada. Foundation funding supports nonprofit organizations working on food-focused initiatives, including food recovery programs, nutrition incentive initiatives, local distribution models, and inclusive food business development. In addition to providing capital, the UNFI Foundation leverages UNFI's expertise, scale, and supply chain to support and amplify grantee partners' work, creating lasting change across the food system.
Learn more about the UNFI Foundation here.
Photo courtesy of Sprout Nola, a UNFI Foundation grantee
AHEAD OF SCHEDULE
Current Progress: 234,872,096 pounds of food donated since Fiscal Year 2020 baseline.
Donate 250 million pounds of food (equivalent to approximately 208 million meals) by 2030.
As a national food distributor, we have an important role to play in addressing food access. One way we do this is through food donations to nonprofits.
This year, our Canada team surpassed their food donation goal, contributing 404,000 pounds of product to community partners. We expect to achieve UNFI's goal ahead of schedule and are working to identify even more donation opportunities across our network.
KEY METRICS
35,193,453 pounds of food donated in Fiscal Year 2025, which is equivalent to ~29 million meals25
841 WIC-eligible owned brands products available across the US26
GRANTEE IMPACT IN FISCAL YEAR 2025 27
$1.6M grant dollars distributed
$200,000 in impact investments deployed
$1.4M in nutrition incentive dollars distributed
$10.3M of food purchases made by grantees went directly to local farms
18M pounds of food recovered and diverted from waste
25 This uses Feeding America’s widely accepted calculation that 1.2 pounds = 1 meal.
26 This metric only reflects products within UNFI’s owned brands portfolio that are recognized by WIC at the national level.
27 These are outcomes shared by
Photo courtesy of Alchemist CDC, a UNFI Foundation grantee
Community Livelihood
We strive to champion economic opportunity and help strengthen the communities we serve by supporting small, local food businesses and growers. By focusing locally, we can reduce supply chain disruptions, source unique products that offer retailers a differentiated portfolio, and generate economic well-being by keeping dollars in the community.
Breaking down our approach:
• Local Sourcing: Supporting regional suppliers to keep dollars circulating within communities while reducing transportation costs.
• Emergency Response: Mobilizing distribution infrastructure and supplier networks to deliver immediate disaster relief.
• Small Business Support: Helping local producers access mainstream markets through technical assistance and procurement commitments.
• Community Investment: Funding organizations that understand local economic realities and can scale proven solutions.
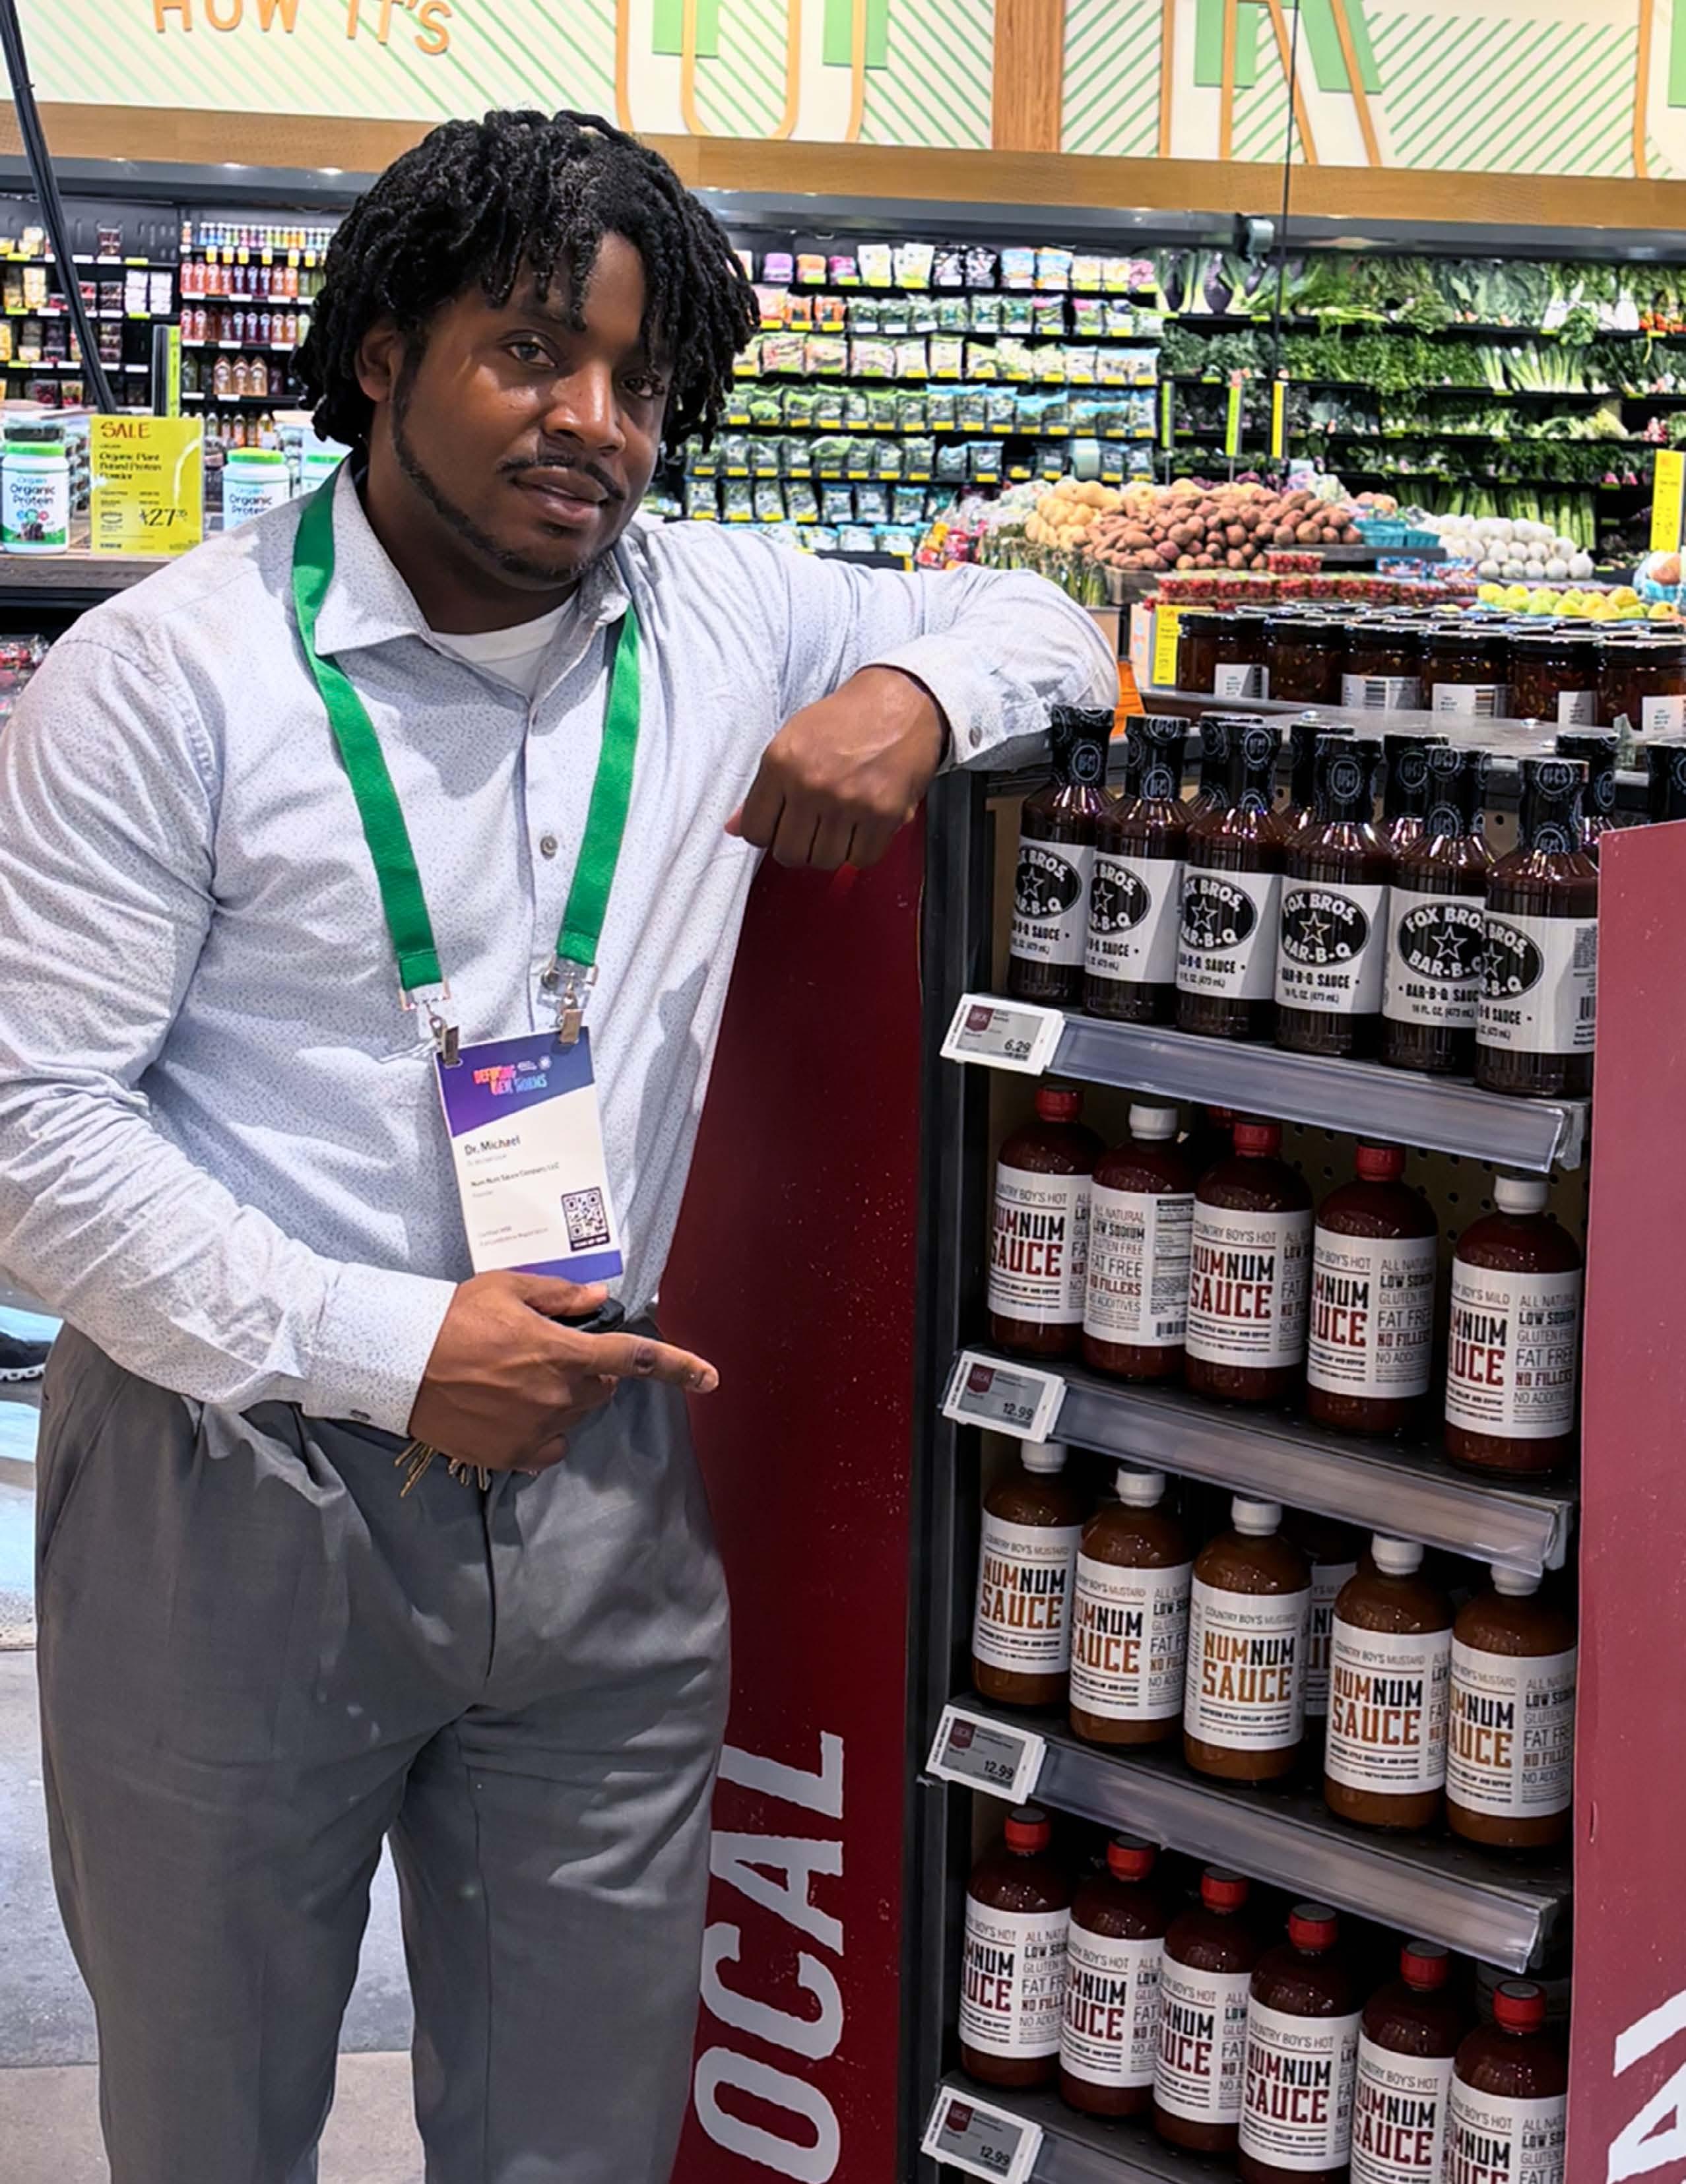
Acres Program:
Building Market Readiness and Business Capacity
This year marked our third year collaborating with the National Minority Supplier Development Council’s Acres Program, which equips underrepresented farmers with tools to manage national contracts and meet rigorous quality standards. The 14-week initiative combined UNFI Foundation financial support with mentorship from our associates in logistics, operations, and compliance.
Photo courtesy of Num Num, an Acres program participant.
Support from the Acres program to navigate certifications and enter the national supply chain has been incredibly helpful. Thanks to the guidance provided, I’m proud to share that Num Num Sauces are now distributed to 50 Whole Foods Market Stores throughout the southern region.
– Dr. Michael Lloyd, CEO, Num Num Sauce
Disaster Relief: Network Activation When Communities Need It Most
Our national network of suppliers, and partnerships with UNFI Foundation nonprofit grantees, help us show up quickly when disaster strikes. This year, when Hurricane Helene hit the Southeastern U.S. and wildfires devastated parts of Southern California, we mobilized our network to provide food, water and financial resources to hard-hit communities.
We delivered 15,000 pounds of essential supplies within 72 hours of Hurricane Helene and partnered with suppliers and customers to raise funds at the 2025 San Diego Selling Show to support UNFI Foundation grantee Food Forward’s Los Angeles Wildfire food relief efforts. With the frequency of large scale natural disasters increasing, UNFI’s ability to activate our network and respond to crises will become even more important.
UNFI Co-Founder, Former CEO and Board Member, Michael Funk and Matt Echols, UNFI Foundation Board Chair and UNFI Chief Corporate Affairs Officer, raise money for wildfire relief efforts at the San Diego Selling Show.
Customer Circle of Excellence Winners
We are proud to partner with retailers who share our vision for a better future. This year, we recognized customers who demonstrated exceptional commitment to their communities through our Circle of Excellence awards.
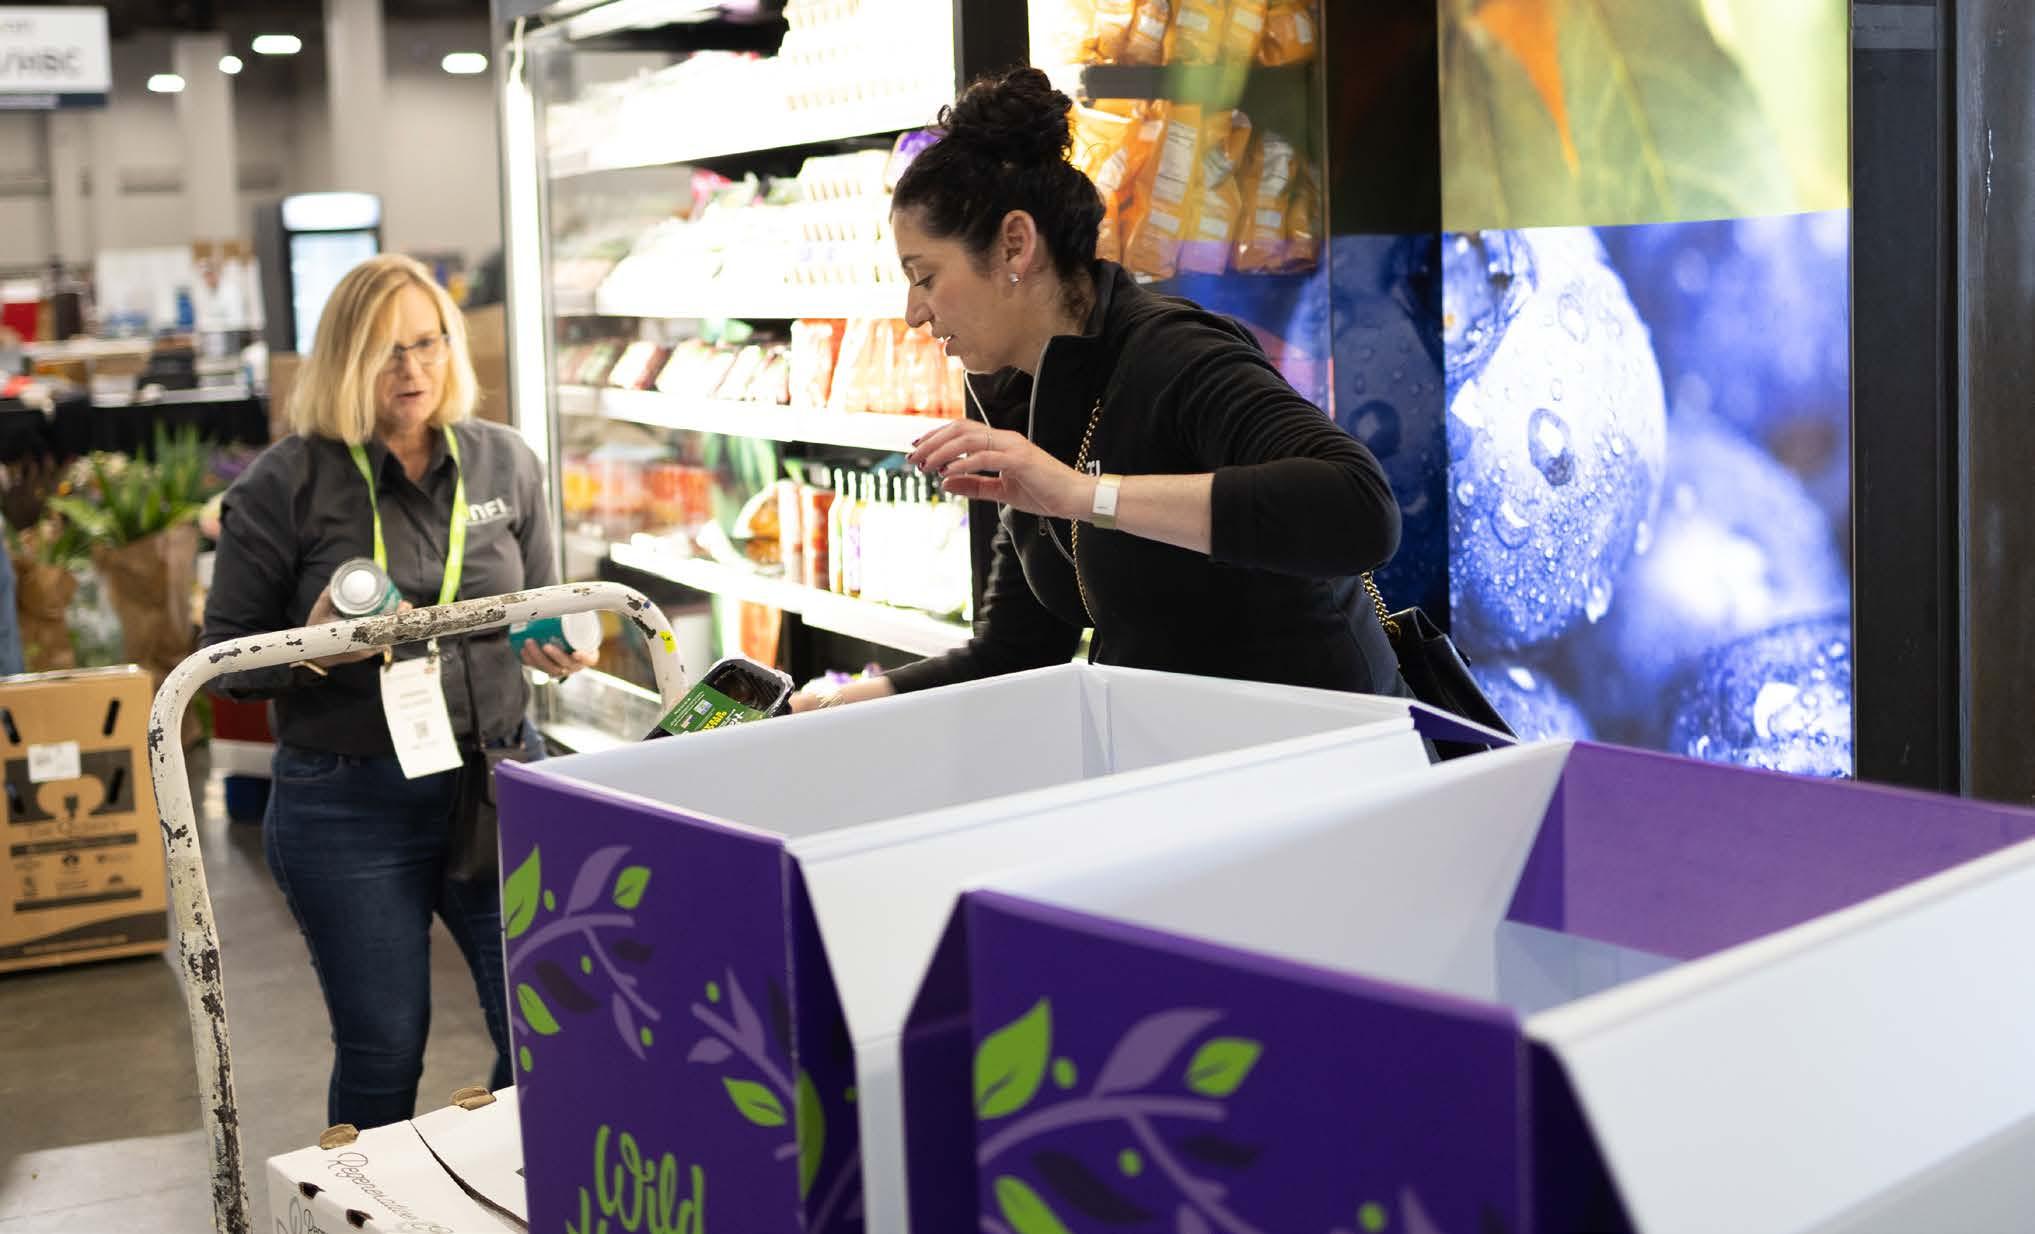
left, ALM Foods receives UNFI's Customer Circle of Excellence award.
99,604 pounds of food recovered and donated from our four selling shows
Pictured
Fiscal Year 2025 Better for All Impact Goals
Resilient Supply Chains
Promote soil health through regenerative and organic practices on one million acres by 2030 Unit of measure: acres
Achieve 100% RSPO-certified palm oil for all UNFI-owned brands products containing palm oil by the end of 2027
Reduce absolute Scope 3 GHG emissions from purchased goods and services by 25% by 2030.
Associates
Efficient & Sustainable Operations
Reduce Scope 1 and 3 heavy freight well-to-wheel GHG emissions from transportation by 38% per tonne-kilometer by the end of Fiscal Year 2030 Unit of measure: gCO2e/tonne-kilometer
Reduce absolute Scope 1 and 2 GHG emissions from all other emission sources by 50% by the end of Fiscal Year 2030 Unit
Communities
Donate 250 million pounds of food (equivalent to approximately 208 million meals) by 2030 Unit of
N/A
Fiscal Year 2025 Key Metrics
As part of our efforts to continuously improve the scope and quality of disclosure and make our impact reporting accessible to all stakeholders, we are continuing to provide year-over-year comparability on key metrics.
Greenhouse Gas (GHG) Emissions
Methodology
UNFI continues to invest in improving our methodologies and increasing the transparency of our reporting. Through our partnership with a new sustainability insights provider, we refined our Scope 3 inventory methodology, enabling the use of more granular and representative emissions factors, which yields a clearer, more actionable understanding of our value chain emissions. This new vendor recalculated our Fiscal Year 2023 Scope 3 GHG emissions to support standardization and more representative comparison year-over-year. As a result, we are restating both our Fiscal Year 2023 Scope 3 GHG emissions and Fiscal Year 2023 Total GHG Emissions.
CDP Corporate Questionnaire
In Fiscal Year 2025, we submitted our third CDP response related to forests (second year scored) and fifth CDP response related to climate change. Through these disclosures we report on the management of our supply chain in relation to forest ecosystems as well as UNFI’s GHG emissions, reflecting our ongoing commitment to transparency and management of forest- and climate- related risks and opportunities. Due to the timing for submitting the CDP Corporate Questionnaire response relative to the end of UNFI's fiscal year, our most recent CDP reporting period (Fiscal Year 2024) continues to be one fiscal year prior the rest of the Impact Report's current reporting period (Fiscal Year 2025). The time needed for CDP to grade our most recent questionnaire response (Fiscal Year 2024) extends beyond our Impact Report publication date and because of this the most recent grade we can report is from Fiscal Year 2023.
Workforce Composition
Methodology
We currently track demographic data, including race, gender, veteran status, and disability, through our Human Resources systems. This allows us to provide resources and opportunities that are best suited to our diverse population. Additional details can be found in our EEO-1 Report available on our Investor Relations website.
How We Measure Up
UNFI scored 100% on the Disability Equality Index application.
UNFI remains the only North American grocery wholesaler to achieve this score and recognition four years in a row.
Waste Reduction
Methodology
Our waste diversion efforts are informed by the Zero Waste International Alliance (ZWIA) and an industry-aligned 90% diversion rate threshold for "zero waste". As of Fiscal Year 2025, this data includes universal waste, including e-waste, and other non-food items. In Fiscal Year 2025, we continued to refine our waste data methodology to better understand waste streams and diversion opportunities.
We enhanced tracking to capture and implement additional diversion programs across our network, now including pallets in our count, which had previously been excluded. While this provides a more accurate representation of our waste streams, it impacts year-over-year comparability.
Secondly, while we continue leveraging waste audit insights to estimate food waste and guide our strategy, we are exploring alternative tracking methods to identify gaps and strengthen data integrity. Non-food waste material data is based on monthly vendor reporting data.
SASB Reference Table
The Sustainability Accounting Standards Board (SASB) is an independent, private-sector standards setting organization dedicated to enhancing the efficiency of the capital markets by fostering high-quality disclosure of material sustainability information that meets investor needs. This table references the issues which SASB has identified as financially and/or operationally material for Food Retailers and Distributors as of Version 2018-10.
Percentage of refrigerants consumed with zero ozone-depleting potential
Average refrigerant emissions rate
Quantitative Percentage (%)
Quantitative Percentage (%)
This is UNFI’s fifth year reporting against the SASB framework. While we cannot yet report on all accounting and activity metrics in this framework, we are using it as a roadmap for future disclosure and continue our efforts to evolve and improve our disclosure. Whenever possible, we have indicated where these gaps are in the “Response and Related Reference” column for context and transparency.
RESPONSE AND RELATED REFERENCE
2,967,672 GJ
UNFI tracks expenses for relevant fuel types, including diesel (clear and dyed), compressed natural gas, and electricity, for fleet vehicles owned or operated by UNFI (or those used for certain dedicated third-party logistics).
Efficient and Sustainable Operations, pg. 59
Unavailable
The company does not currently track whether fuel is renewable, as defined by the U.S. Renewable Fuel Standard (U.S. 40 CFR 80.1401).
59,904 metric tons CO2e
The inputs for Scope 1 emissions from refrigerants stem from many sources and represent the loss of refrigerants directly to the atmosphere from distribution center commercial and industrial systems, retail commercial systems, trailer refrigeration systems, tractor air conditioning systems, and office or other heating, ventilation, and air conditioning (HVAC) systems. In Fiscal Year 2024, UNFI decreased and shifted its use of certain refrigerants, including, where possible, switching to those with lower greenhouse warming potential. This decision was driven, in part, by regulations continuing to drive towards less carbon-intensive options.
Consistent with UNFI’s broader greenhouse gas (GHG) emissions accounting, the above represents Fiscal Year 2024 data. Fiscal Year 2025 emissions data is not yet available for reporting. Certain refrigerants, such as HCFC-22/R-22 are not currently counted in our GHG inventory.
Unavailable
UNFI is unable to provide this information at this time.
Unavailable
UNFI is unable to provide this information at this time.
SASB Reference Table
TOPIC
Energy Management
Energy Management
FB-FR-130a.1 (1) Operational energy consumed Quantitative Gigajoules (GJ)
Energy Management
Energy Management
FB-FR-130a.1
(2) percentage grid electricity
FB-FR-130a.1 (3) percentage renewable
Quantitative Percentage (%)
Food Waste Management
Food Waste Management
FB-FR-150a.1
Amount of food waste generated
Quantitative Percentage (%)
Food Waste Management
FB-FR-150a.1
Percentage diverted from the waste stream
Quantitative Metric tons
Quantitative
Percentage (% of total)
RESPONSE AND RELATED REFERENCE
2,505,845 GJ
Please note that operational energy includes retail and distribution center locations across North America, and excludes energy sources from diesel-stationary, number 2 fuel oil, propane, solar generation, and other green power.
To better serve the needs of our stakeholders, UNFI also reports energy consumption in MWh: 696,073 MWh
75%
Aligned with Fiscal Year 2024 calculations, this metric includes energy consumed by facilities, including retail, corporate offices, and distribution centers based in Canada.
42%
This metric reflects North American retail and distribution center electricity usage only and excludes energy sources from diesel-stationary, number 2 fuel oil, propane, and on-site solar generation.
Our renewable energy consumption comes from our purchase of renewable energy certificates (RECs). We also maintain solar arrays at a few locations; however, that energy generation is not included in this metric.
~48,486 metric tons of food waste generated
This metric is an estimate based on the results of waste audits that occurred at a subset of DCs in Fiscal Year 2025.
~85% of food waste diverted from landfill
SASB Reference Table
Data Security
Data Security
FB-FR-230a.1
ACCOUNTING
(1) Number of data breaches
Data Security
FB-FR-230a.1
(2) percentage that are personal data breaches
Quantitative Number (#)
Data Security
FB-FR-230a.1 (3) number of customers affected
Quantitative Percentage (%)
Data Security
FB-FR-230a.2
Description of approach to identifying and addressing data security risks
Quantitative Number (#)
Discussion and Analysis n/a
RESPONSE AND RELATED REFERENCE
Unavailable.
Unavailable.
Unavailable.
The Cybersecurity team is a standalone team led by a Chief Information Security Officer (CISO), who reports to the Chief Information Officer (CIO). The primary function is to manage risk to acceptable levels against the ongoing and growing threat of cyber-attacks and disruption. The program is based on the NIST framework utilizing developed policies and standards.
Cybersecurity program management utilizes an Information Security Steering Committee that meets quarterly to review the cybersecurity threat landscape, current risks, incidents and program management. The Cyber Security team has developed a set of monthly dashboards that continuously mature to provide a quantitative view of the organization’s cyber risk posture.
The key functional areas under the direction of the CISO include:
• Policy and Standards (provides the foundational guidance for the program based on NIST framework)
• Compliance (controls management with specific focus on PCI (Payment Card Industry) and SOX
• Assessments (continuously monitors risk-based internal and external risk of significant areas)
• Reporting (provides actionable intelligence on areas of risk and remediation progress)
• Governance (oversees cyber security design for IT projects and initiatives, as well as third party reviews and assessments)
• Cyber Response (provides 24-7 monitoring and response for organization cyber security posture)
• Threat Intelligence (monitors actionable techniques, tactics, and procedures of global cyber threats in real-time)
Fiscal Year 2025 Form 10-K -Cybersecurity, pg. 23-24
SASB Reference Table
TOPIC
Food Safety Food Safety
Food Safety
Food Safety
FB-FR-250a.1
High-risk food safety violation rate
FB-FR-250a.2 (1) number of recalls
Quantitative Rate
Food Safety
FB-FR-250a.2 (2) number of units recalled
Quantitative Number (#)
Product Health & Nutrition
FB-FR-250a.2
Product Health & Nutrition
FB-FR-260a.1
(3) percentage of units recalled that are private-label products
Quantitative Number (#)
Revenue from products labeled and/or marketed to promote health and nutrition attributes
Quantitative Percentage (%)
Quantitative Reporting currency (USD)
RESPONSE AND RELATED REFERENCE
Unavailable
UNFI does not publicly provide this information. UNFI’s Food Safety & Quality Assurance leaders in each region are responsible for managing food safety practices and completing internal risk assessments at least once per year to identify and remedy any gaps in compliance.
Unavailable
UNFI is unable to provide information on recalls at this time.
The Company continues to drive a food safety culture within the organization and with its suppliers.
Unavailable
UNFI is unable to provide information on recalls at this time.
The Company continues to drive a food safety culture within the organization and with its suppliers.
Unavailable
UNFI is unable to provide information on recalls at this time.
The Company continues to drive a food safety culture within the organization and with its suppliers.
Unavailable
UNFI does not have a standardized way of reporting this activity at this time.
SASB Reference Table
Product Health & Nutrition
FB-FR-260a.2
Product Labeling & Marketing
Product Labeling & Marketing
FB-FR-270a.1
Discussion of the process to identify and manage products and ingredients related to nutritional and health concerns among consumers
Discussion and Analysis n/a
Product Labeling & Marketing
FB-FR-270a.2
Number of incidents of non-compliance with industry or regulatory labeling and/ or marketing codes
Total amount of monetary losses as a result of legal proceedings associated with marketing and/or labeling practices
Quantitative
Number (#)
Quantitative
Product Labeling & Marketing
FB-FR-270a.3
Product Labeling & Marketing
FB-FR-270a.3
Revenue from products labeled as (1) containing genetically modified organisms (GMOs)
Revenue from products labeled as (2) non-GMO
Quantitative
Reporting currency (USD)
Quantitative
Reporting currency (USD)
Reporting currency (USD)
RESPONSE AND RELATED REFERENCE
UNFI follows the standards of the Codex Alimentarius (CODEX), Federal Food, Drug & Cosmetic Act (FFDCA), and other relevant agencies in the development of its products and labels.
Across UNFI’s Brands+ portfolio, suppliers are Global Food Safety Initiative (GFSI) certified with packaging that bears several types of certification, including: USDA Organic, Non-GMO Project Verified, Gluten Free Certified, Certified Vegan, and Kosher. Additionally, in Fiscal Year 2025, we began reformulation efforts to meet federal and state level ingredient bans. This included our completion of fully transitioning away from brominated vegetable oil, and starting Red 3 alternative efforts. We are carefully monitoring state prohibition lists and proposed legislation and will continue to interface with our co-manufacturers on readiness and costs of implementation.
Unavailable
UNFI does not publicly provide this information.
Unavailable
UNFI does not publicly provide this information.
Unavailable
UNFI does not have information on products labeled as GMO.
$8,680,927,818.78
This number includes both products labeled as NON-GMO and products that are third-party certified to standards for which non-GMO is inherent to the certification (e.g., U.S. Department of Agriculture Organic certification). Additionally, UNFI continues to verify its owned brands through the Non-GMO Project, and in Fiscal Year 2025 10% of Brands+ SKUs are verified.
SASB Reference Table
Labor Practices
Labor Practices
ACCOUNTING / ACTIVITY METRIC
FB-FR-310a.1 (1) Average hourly wage
Labor Practices
FB-FR-310a.1
Labor Practices
FB-FT-310a.2
(2) percentage of in-store and distribution center employees earning minimum wage, by region
Percentage of active workforce covered under collective bargaining agreements
Labor Practices
Labor Practices
Labor Practices
FB-FR-310.3 (1) Number of work stoppages
Quantitative Reporting currency (USD)
FB-FR-310a.4
Quantitative Percentage (%)
Quantitative Percentage (%)
Quantitative Number (#)
Quantitative Reporting currency (USD) TOPIC
FB-FR-310.3 (2) total days idle Quantitative Number (#)
Total amount of monetary losses as a result of legal proceedings associated with: (1) labor law violations and (2) employment discrimination
RESPONSE AND RELATED REFERENCE
UNFI does not publicly disclose this information.
As disclosed in UNFI’s proxy, UNFI’s median employee total compensation was $63,555 in Fiscal Year 2025.
UNFI does not publicly disclose this information.
Approximately 42% of associates were covered by collective bargaining agreements as of August 2, 2025.
UNFI monetary losses as a result of legal proceedings associated with labor law violations and employment discrimination were not material in Fiscal Year 2025.
SASB Reference Table
Management of Environmental & Social Impacts in the Supply Chain
Management of Environmental & Social Impacts in the Supply Chain
Management of Environmental & Social Impacts in the Supply Chain
FB-FR-430a.1
Management of Environmental & Social Impacts in the Supply Chain
FB-FR-430a.2
Revenue from products thirdparty certified to environmental or social sustainability sourcing standard
FB-FR-430a.2
Percentage of revenue from (1) eggs that originated from a cage-free environment
Quantitative
Reporting currency (USD)
Percentage of revenue from (2) pork produced without the use of gestation crates
Quantitative Percentage (%)
Quantitative Percentage (%)
RESPONSE AND RELATED REFERENCE
Unavailable in aggregate.
UNFI relies on supplier-provided information and third-party certifications to evaluate its environmental and social sourcing standards. UNFI tracks revenue by individual certifications, but as many products may contain one or more environmental or social sustainability certification, total revenue of certified products with at least one standard cannot be provided at this time without risk of double counting.
~76% of revenue from the sale of eggs was generated from eggs that originated from a cage-free environment or better. Cage-free includes eggs originating from cage-free and free range production systems per USDA shell egg labeling guideline definitions, as well as pasture-raised environments. Aligned with our animal welfare position statement, we continued our efforts to better promote and meet the market demand for cage-free eggs, resulting in an increase compared to prior year.
23% of revenue from the sale of pork was generated from pork produced without the use of gestation crates
The above figure was derived based on sales (USD) not weight (lbs). Aligned with our animal welfare position statement, we continued efforts to better promote and meet the market demand for gestation crate free pork. We saw a reduction in both absolute sales as well as a percent of total sales compared to prior year, however, in part due to inflationary pressures on consumer purchasing power and a move towards lower priced protein options.
SASB Reference Table
TOPIC
ACCOUNTING
CODE
Management of Environmental & Social Impacts in the Supply Chain
FB-FR-430a.3
Discussion of strategy to manage environmental and social risks within the supply chain, including animal welfare
Discussion and Analysis n/a
RESPONSE AND RELATED REFERENCE
Environmental Compliance
UNFI complies with local, state, and federal regulations regarding social and environmental protection. It meets standards and invites independent audits of its systems, when appropriate. UNFI recognizes that if its systems are mismanaged, such as those for safe labor, waste and stormwater management, and food quality, it could pose significant risk to stakeholders.
Supplier & Vendor Code of Conduct
UNFI distributes a Supplier and Vendor Code of Conduct to its supply chain partners, which includes labor and worker rights, safety and security, and environmental protection, and processes for conducting business with integrity. Each year we re-evaluate the Code to see what updates are necessary to best align with our corporate impact strategy. Additionally, UNFI maintained its CDP Supplier Engagement score of B for Fiscal Year 2023. Due to the timing of CDP disclosure submissions and grading relative to the end of UNFI’s Fiscal Year, the score for our most recent CDP reporting period (Fiscal Year 2024) was not yet available and continues to be one fiscal year prior the rest of the Impact Report’s current reporting period (Fiscal Year 2025).
Animal Welfare
Aligned with our animal welfare position statement, UNFI continues to enhance its tracking of products sold in accordance with higher welfare standards and implement initiatives designed to support customer engagement to better feature higher welfare products.
No Deforestation
UNFI is working to mitigate deforestation in our supply chains for beef and palm. In Fiscal Year 2025, we expanded our engagement with beef and palm suppliers to better understand their compliance with UNFI’s deforestation policy. These efforts enabled us to establish baseline compliance rates of 64% by sales volume for fresh or frozen beef, muscle cuts and ground beef and 58% by sales for products containing palm oil and select derivatives. To continue advancing towards full compliance across our broader assortment, UNFI plans to deepen supplier engagement to support adoption of deforestation-free practices, align with customers to amplify our shared expectations and market demand for deforestation-free products, and coordinate with sales teams to better spotlight compliant suppliers. Considering these learnings, we plan to update our policy to reflect these developments and the need for continuous improvement. We also received our first grade of a C for our Fiscal Year 2023 CDP Forests Disclosure. We aim to maintain or improve this score based on actions subsequently taken and disclosed in our Fiscal Year 2024 CDP submission. Due to the timing of CDP disclosure submissions and grading relative to the end of UNFI’s Fiscal Year, the score for our most recent CDP reporting period (Fiscal Year 2024) was not yet available and continues to be one fiscal year prior the rest of the Impact Report’s current reporting period (Fiscal Year 2025).
In Fiscal Year 2025, we increased the share of our owned brands portfolio that sources RSPO-certified palm oil from 92% to nearly 96% of owned brand SKUs that use palm oil, reached through partnerships with suppliers to understand their current usage and through investing in the reformulation of previously non-certified recipes. Certifying our remaining brands will require greater collaboration and increased investment in supply chain transformation. Despite these anticipated hurdles, we continue to look for opportunities to close the gap.
Organic & Regenerative
In Fiscal Year 2025, UNFI continued its strategy for promoting soil health, biodiversity, ecosystem services, and farmer livelihoods through targeted UNFI Foundation grants and impact investments, as well as our core business activity of organic product procurement. In partnership with a new sustainability insights provider, UNFI gained a better understanding of its impact through procurement using an enhanced methodology of estimating aggregate commodity volumes from the ingredients of certified organic products across our entire product portfolio, enabling us to estimate how much land supports our procurement of the certified organic SKUs we distribute. This procurement calculation was conducted using Fiscal Year 2024 spend data, in line with our process for calculating our Scope 3 category 1 GHG emissions. Accordingly, this impact is reported as a restatement of our Fiscal Year 2024 acres.
SASB Reference Table
TOPIC CODE
Management of Environmental & Social Impacts in the Supply Chain
FB-FR-430a.4
ACCOUNTING / ACTIVITY METRIC CATEGORY UNIT OF MEASURE
Discussion of strategies to reduce the environmental impact of packaging
Discussion and Analysis n/a
TABLE 2. ACTIVITY METRICS
TOPIC CODE
Activity
Activity
FB-FR-000.A
FB-FR-000.A
ACCOUNTING / ACTIVITY METRIC
NUMBER OF (1) RETAIL LOCATIONS
NUMBER OF (2) DISTRIBUTION CENTERS
CATEGORY UNIT OF MEASURE
Quantitative Number (#)
Quantitative Number (#)
Activity
Activity
Activity
Activity
FB-FR-000.B
TOTAL AREA OF (1) RETAIL SPACE
Quantitative
Square meters (m2)
FB-FR-000.B
TOTAL AREA OF (2) DISTRIBUTION CENTERS
Quantitative
Square meters (m2)
FB-FR-000.C
NUMBER OF VEHICLES IN COMMERCIAL FLEET
FB-FR-000.D TON MILES TRAVELED
Quantitative Number (#)
Quantitative Ton miles
RESPONSE AND RELATED REFERENCE
UNFI’s effort to manage and increase our understanding of supplier packaging continues to be an area of focus, utilizing the data we do have to inform a baseline understanding of our usage. Additionally, all suppliers, both new and existing, are required to update their packaging, including both secondary and tertiary packaging, in our system dashboard. By gaining a better understanding of the recyclability of packaging substrates, we can better tailor our strategies for intervention.
The Company’s procurement team works directly with packaging suppliers to communicate and remedy quality issues at the source. Additionally, an enhanced calculation methodology of Scope 3 GHG inventory in Fiscal Year 2022 captured packaging- and processing-related emissions, offering increased visibility and data-driven insights, which we continue to use to inform strategy.
RESPONSE AND RELATED REFERENCE
101 Corporate and Franchised Retail Locations. We operated 75 grocery stores, including 54 Cub Foods stores and 21 Shoppers stores, as of August 2, 2025. In addition, we supplied another 26 Cub Foods stores operated by our wholesale customers through franchise and minority equity ownership arrangements.
52
Fiscal Year 2025 Form 10-K -pg. 25-26
~4,881,000 sq. meters
Please note that this covers Cub Foods stores in which we have a controlling ownership interest and 7 Cub Foods stores securing our Team Loan Facility. This number excludes 32 franchised Cub Foods full-line and separate liquor stores in which we have no ownership interest or a minority interest.
Fiscal Year 2025 Form 10-K -pg. 25-26
~29,664,000 sq. meters
Fiscal Year 2025 Form 10-K -pg. 25-26
2,119
781,069,197 ton miles
To better serve the needs of our stakeholders, UNFI also currently reports tonne kilometers as the intensity metric for its fleet Climate Action goal and validated science-based target.
Guidance on Climate-Related Risk Management & Integration
Governance: Disclose the organization’s governance around climate-related risks and opportunities.
a) Describe the board’s oversight of climate-related risks and opportunities.
b) Describe management’s role in assessing and managing climate-related risks and opportunities.
Strategy: Disclose the actual and potential impacts of climate-related risks and opportunities on the organization’s businesses, strategy, and financial planning where such information is material.
a) Describe the climate-related risks and opportunities the organization has identified over the short, medium, and long term.
b) Describe the impact of climate-related risks and opportunities on the organization’s businesses, strategy, and financial planning.
c) Describe the resilience of the organization’s strategy, taking into consideration different climate-related scenarios, including a 2°C or lower scenario.
As part of our ongoing path to increased transparency, more robust environmental stewardship, and deeper integration of both financial and climate-related risk, we seek to more closely apply the recommendations of the Task Force on Climate-related Financial Disclosures (TCFD). This is our fourth year of reporting more explicitly with TCFD recommendations. We recognize the ongoing importance of providing a clear portrayal of our climate-related financial information and will continue to align our responses as our emissions reduction strategy and initiatives progress. This response reflects information that can be found in our 2025 CDP climate change questionnaire response, which includes Fiscal Year 2024 data.
LOCATION
Fiscal Year 2025 Schedule 14A, pg. 8,10
2025 CDP Corporate Questionnaire, 4.1.1, 4.1.2
Fiscal Year 2025 Impact Report - Our Approach to Governance, pg. 12 Sustainability Policy, available on our website
2025 CDP Corporate Questionnaire, 4.3, 4.3.1
Fiscal Year 2025 Schedule 14A, pg. 10
Fiscal Year 2025 Impact Report - Our Approach to Governance, pg. 12
Guidance on Climate-Related Risk Management & Integration
Risk Management: Disclose how the organization identifies, assesses, and manages climate-related risks.
a) Describe the organization’s processes for identifying and assessing climate-related risks
b) Describe the organization’s processes for managing climate-related risks.
c) Describe how processes for identifying, assessing, and managing climate-related risks are integrated into the organization’s overall risk management.
Metrics and Targets: Disclose the metrics and targets used to assess and manage relevant climate-related risks and opportunities where such information is material.
a) Disclose the metrics used by the organization to assess climate-related risks and opportunities in line with its strategy and risk management process.
b) Disclose Scope 1, Scope 2, and, if appropriate, Scope 3 greenhouse gas (GHG) emissions, and the related risks.
c) Describe the targets used by the organization to manage climate-related risks and opportunities and performance against targets.
Fiscal Year 2025 Impact Report - Efficient and Sustainable Operations, pg. 59-61, 66
Taskforce on Nature-related Financial Disclosures
Governance: Disclose the organization’s governance of nature-related dependencies, impacts, risks and opportunities.
a) Describe the board’s oversight of nature-related dependencies, impacts, risks and opportunities.
b) Describe management’s role in assessing and managing nature-related dependencies, impacts, risks and opportunities.
c) Describe the organization’s human rights policies and engagement activities, and oversight by the board and management, with respect to Indigenous Peoples, Local Communities, affected and other stakeholders, in the organization’s assessment of, and response to, nature-related dependencies, impacts, risks and opportunities.
Strategy: Disclose the effects of nature-related dependencies, impacts, risks and opportunities on the organization’s business model, strategy and financial planning where such information is material.
a) Describe the nature-related dependencies, impacts, risks and opportunities the organization has identified over the short, medium and long term.
b) Describe the effect nature-related dependencies, impacts, risks and opportunities have had on the organization’s business model, value chain, strategy and financial planning, as well as any transition plans or analysis in place.
This year is our first year aligning responses to the Taskforce on Nature-related Financial Disclosures (TNFD), acknowledging the critical role nature plays in sustaining ecosystems, communities, and economies. Through this process, we aim to better understand and communicate our dependencies and impacts on nature across our value chain. By aligning with TNFD's framework, we are enhancing our approach to identifying nature-related risks and opportunities, and integrating these considerations into our broader sustainability strategy.
This response reflects information that can be found in our 2025 CDP Corporate Questionnaire response, which includes Fiscal Year 2024 data.
LOCATION
2025 CDP Corporate Questionnaire, Forests 4.1.1.1
2025 CDP Corporate Questionnaire, Forests 4.1.2
Fiscal Year 2025 Impact Report - Our Approach to Governance, pg. 12
2025 CDP Corporate Questionnaire, Forests 4.3
2025 CDP Corporate Questionnaire, Forests 4.3.1
Fiscal Year 2025 Impact Report - Our Approach to Governance, pg. 12
c) Describe the resilience of the organization’s strategy to nature-related risks and opportunities, taking into consideration different scenarios.
d) Disclose the locations of assets and/or activities in the organization’s direct operations and, where possible, upstream and downstream value chain(s) that meet the criteria for priority locations.
Risk and Impact Management: Describe the process used by the organization to identify, assess, prioritize and monitor nature-related dependencies, impacts, risk and opportunities.
a) Describe the organization’s processes for identifying, assessing and prioritizing nature-related dependencies, impacts, risks and opportunities in its direct operations.
b) Describe the organization’s processes for identifying, assessing and prioritizing nature-related dependencies, impacts, risks and opportunities in its upstream and downstream value chain(s).
c) Describe the organization’s processes for monitoring nature-related dependencies, impacts, risks and opportunities.
d) Describe how processes for identifying, assessing, prioritizing and monitoring nature-related risks are integrated into and inform the organization’s overall risk management processes.
Metrics and Targets: Disclose the metrics and targets used to assess and manage material nature-related dependencies, impacts, risks and opportunities.
a) Disclose the metrics used by the organization to assess and manage material nature-related risks and opportunities in line with its strategy and risk management process.
b) Disclose the metrics used by the organization to assess and manage dependencies and impacts on nature.
c) Describe the targets and goals used by the organization to manage nature-related dependencies, impacts, risks and opportunities and its performance against these.
UNFI has reported the information cited in this GRI content index for the 2025 fiscal year, which ran from August 4, 2024 to August 2, 2025, with reference to the GRI Standards.
GRI 1: Used GRI 1: Foundation 2021
DISCLOSURE
DISCLOSURE
GRI 2: General Disclosures 2021
LOCATION / COMMENT
LOCATION/COMMENT
UNITED NATURAL FOODS, INC.
15 Park Row West, Suite 302, Providence, RI 02903
About UNFI, pg. 6-9
2-1 Organizational details
2-2 Entities included in the organization’s sustainability reporting
Fiscal Year 2025 Form 10-K - Business, pg. 1
Fiscal Year 2025 Form 10-K - Market Information, Holders and Dividends, pg. 27
UNFI’s social and environmental impact reporting and disclosures account for the company’s total owned/leased operations, including distribution centers, retail locations, and fleet, as well as customer services and supplier agreements. Relevant boundaries herein are explicitly stated where relevant.
Fiscal Year 2025 Form 10-K - Properties, pg. 25-26
Fiscal Year 2025 Form 10-K - Item 15. Exhibit and Financial Statement Schedules, pg. 105, Exhibit 21
2-3 Reporting period, frequency and contact point
Unless we say otherwise, the information provided in this Impact Report, published November 13, 2025, covers Fiscal Year 2025, which ran from August 4, 2025 - August 2, 2025.
Because of the timeline associated with collection process for emissions data, all climate-related disclosures cover Fiscal Year 2024 data.
For additional information, contact impact@unfi.com.
DISCLOSURE
LOCATION / COMMENT
Regenerative Agriculture & Organic Practices
UNFI has enhanced its calculation methodology for the number of acres we impact by promoting soil health through regenerative and organic practices. For this reason, Fiscal Year 2024 progress has been restated to 923,749 acres, which includes the procurement of organic commodities. Given the importance of regenerative and organic practices to long-term food system sustainability, we’re exploring a next-generation goal that captures this impact within the broader context of nature and ecosystem health. This evolution will be informed by relevant frameworks, stakeholder input and initiatives with aligned partners. See Fiscal Year 2025 Impact Report - Resilient Supply Chains, pg. 34-35.
Scope 3 Inventory
UNFI is restating its Fiscal Year 2023 Scope 3 emissions based on a change in its Scope 3 calculation vendor, who brings enhanced capabilities to estimate our category 1 emissions in particular, the most material source of UNFI’s Scope 3 emissions and focus area for our strategic initiatives. This new vendor recalculated our Fiscal Year 2023 Scope 3 emissions to support standardization and more representative comparison year-over-year, including our Fiscal Year 2024 inventory included in this report. See Fiscal Year 2025 Impact ReportResilient Supply Chains, pg. 26-27
FLAG Emissions
2-4 Restatements of information
In our Fiscal Year 2024 report, we reported that Fiscal Year 2023 FLAG emissions represented 52% of Scope 3, Category 1: Purchased Goods and Services. However, that figure actually reflected FLAG emissions as a percentage of total emissions. This year, we’ve corrected the approach and are reporting Fiscal Year 2024 FLAG emissions specifically as a share of Scope 3, Category 1. Note, emissions calculations are one year behind the Impact Report’s temporal boundaries. See Fiscal Year 2025 Impact Report - Resilient Supply Chains, pg. 27.
Fleet Emissions
In Fiscal Year 2024 we stated that fleet emissions accounted for nearly 80% of Fiscal Year 2023 Scope 1 and 2 operational emissions. We had intended for this to compare Scope 1 fleet emissions to total Scope 1 emissions. In this year’s report, we compare Scope 1 fleet emissions to total Scope 1 and market-based Scope 2 emissions, which is a more relevant measure because fleet emissions have been shifting from Scope 1 to Scope 2 recently due to fleet electrification. See Fiscal Year 2025 Impact Report - Efficient and Sustainable Operations, pg. 59.
Waste
UNFI is restating the quantity of food that was sent to landfill in Fiscal Year 2024 due to improved methodology. We estimate 8,677 metric tons of food waste was sent to landfill in Fiscal Year 2024. This number is an estimate based off the findings from our Waste Audits. We will continue to improve our methodology in this area. See Fiscal Year 2025 Impact Report - Efficient and Sustainable Operations, pg. 66
GRI Content Index
DISCLOSURE
2-5 External assurance
LOCATION / COMMENT
UNFI seeks external verification of Scope 1 and 2 emissions (both market-based and location-based) to a limited level of assurance and is assessing what verification options are best moving forward. The Company continues to proactively enhance its internal verification processes in coordination with UNFI’s Internal Audit team.
About UNFI, pg. 6-9
2-6 Activities, value chain and other business relationships
2-7 Employees
2-9 Governance structure and composition
Resilient Supply Chains, pg. 19-21, 24-29, 34-37
Nourished Communities, pg. 75-78, 80-83
Fiscal Year 2025 Form 10-K - Business, pg. 1-10
About UNFI, pg. 6-9
Thriving Associates, pg. 39, 42-45, 50
Key Metrics, pg. 89
Fiscal Year 2025 Form 10-K - Human Capital Management, pg. 8-9
Fiscal Year 2025 Schedule 14A – Committees of the Board of Directors, pg. 9-10
Our Approach to Governance, pg. 12
2-10 Nomination and selection of the highest governance body
2-11 Chair of the highest governance body
2-12 Role of the highest governance body in overseeing the management of impacts
Fiscal Year 2025 Schedule 14A – Director Independence, pg. 6
Fiscal Year 2025 Schedule 14A - Nomination of Directors, pg. 22-23
Fiscal Year 2025 Schedule 14A – Summary of Board Skills, Experiences and Qualifications, pg. 14
Fiscal Year 2025 Schedule 14A - Independent Chair, pg. 7
Our Approach to Governance, pg. 12
Fiscal Year 2025 Schedule 14A - Governance Highlights, pg. 5
Fiscal Year 2025 Schedule 14A - Risk Oversight, pg. 8
Fiscal Year 2025 Schedule 14A - Sustainability and Impact, pg. 12
2-13 Delegation of responsibility for managing impacts
Our Approach to Governance, pg. 12
Fiscal Year 2025 Schedule 14A - Sustainability and Impact, pg. 12
DISCLOSURE
2-14 Role of the highest governance body in sustainability reporting
2-15 Conflicts of interest
LOCATION / COMMENT
Our Approach to Governance, pg. 12
Fiscal Year 2025 Schedule 14A - Governance Highlights, pg. 5
Fiscal Year 2025 Schedule 14A - Sustainability and Impact, pg. 12
Fiscal Year 2025 Schedule 14A, Good Governance Practices, pg. 5
Business Code of Conduct available on our website
Our Approach to Governance, pg. 12
2-17 Collective knowledge of the highest governance body
2-19 Remuneration policies
2-20 Process to determine remuneration
2-21 Annual total compensation ratio
2-22 Statement on sustainable development strategy
Fiscal Year 2025 Schedule 14A – Summary of Board Skills, Experiences and Qualifications, pg. 12
Fiscal Year 2025 Schedule 14A – Proposal 1—Election of Directors, pg. 17-22
Fiscal Year 2025 Schedule 14A – Director Compensation, pg. 25-26
Fiscal Year 2025 Schedule 14A – Compensation Discussion and Analysis, pg. 30-47
Fiscal Year 2025 Schedule 14A – Director Compensation, pg. 25-26
Fiscal Year 2025 Schedule 14A – Compensation Discussion and Analysis, pg. 30-47
Fiscal Year 2025 Schedule 14A - CEO Pay Ratio, pg. 52
A Letter From Leadership, pg. 4-5
2-23 Policy commitments
UNFI takes a precautionary approach to support business continuity and resilience, through which it does not postpone cost-effective measures to prevent threats of serious or irreversible damage or environmental degradation, injury or illness to associates, customers, or community members, and more. UNFI’s Business Continuity team continues to focus its efforts on improving the organization’s business continuity function and management systems.
Our Approach to Governance, pg. 12
Fiscal Year 2025 Form 10-K - Human Capital Management, pg. 8-9
Sustainability Policy, available on our website
No Deforestation Policy, available on our website Business Code of Conduct, available on our website
Supplier & Vendor Code of Conduct, available on our website
GRI Content Index
DISCLOSURE
2-24 Embedding policy commitments
LOCATION / COMMENT
A Letter from Leadership, pg. 4-5
Our Approach to Governance, pg. 12-15
Resilient Supply Chains, pg. 30-33
Thriving Associates, pg. 50-51
2-25 Processes to remediate negative impacts
Our Approach to Governance, pg. 12
Thriving Associates, pg. 50-51
2-26 Mechanisms for seeking advice and raising concerns
Our Approach to Governance, pg. 12
Thriving Associates, pg. 50-51
2-27 Compliance with laws and regulations
2-29 Approach to stakeholder engagement
Fiscal Year 2025 Form 10-K - Government Regulation, pg. 7
2-30 Collective bargaining agreements
GRI 3: Material Topics 2021
3-1 Process to determine material topics
Our Approach to Governance, pg. 12-16
Fiscal Year 2025 Form 10-K - Our Strategic Priorities, pg. 1-6
Fiscal Year 2025 Schedule 14A – Stockholder Engagement, pg. 10
Approximately 42% of associates were covered by collective bargaining agreements as of August 2, 2025
Fiscal Year 2025 Form 10-K - Human Capital Management, pg. 8-9
UNFI evaluates impacts along our value chain, including upstream, operational, and downstream impacts, in order to present a complete, balanced portrayal. In Fiscal Year 2025 we conducted a materiality assessment in line with principles of double materiality, the findings of which helped us refine our impact strategy to include twelve material topics within four impact pillars. Our method of defining report content and report quality continues to be informed by GRI’s Reporting Principles.
Our Approach to Governance, pg. 12, 16-17
DISCLOSURE
LOCATION / COMMENT
In Fiscal Year 2025 the Company conducted a materiality assessment to refine its impact strategy. On page 16-17 of the Fiscal Year 2025 Impact Report, the company lists its impact pillars, consolidated from Fiscal Year 2024, and which are the higher level grouping of material topics. The materiality assessment identified twelve topics material to the Company.
G4-FP1 Percentage of purchased volume from suppliers compliant with company’s sourcing policy
G4-FP2 Percentage of purchased volume which is verified as being in accordance with credible, internationally recognized responsible production standards, broken down by standard
UNFI does not currently report on percentage of purchased volume from suppliers compliant with the company’s sourcing policy. However, clear expectations are set with suppliers through our Supplier & Vendor Code of Conduct.
UNFI does not currently report on percentage of purchased volume, which is verified as being in accordance with credible, internationally recognized responsible production standards. However, we do report on certifications for some responsibly sourced products within our owned brands. UNFI verifies its owned brands through the Non-GMO Project, and in Fiscal Year 2025 10% of Brands+ SKUs were verified.
GRI Content Index
DISCLOSURE
LOCATION / COMMENT
Climate Mitigation and Adaptation (in our Supply Chain)
3-3 Management of material topics
Our Approach to Governance, pg. 12 Climate Mitigation and Adaptation (in Our Supply Chain), pg. 26-29
305-3 Other indirect (Scope 3) GHG emissions
In Fiscal Year 2025, UNFI changed Scope 3 calculation vendors, including a change in methodology. This vendor brought enhanced capabilities to estimate our Category 1 emissions in particular, the most material source of UNFI’s Scope 3 emissions and focus area for our strategic initiatives. The vendor also recalculated our Fiscal Year 2023 Scope 3 emissions to support standardization and more representative comparison year-overyear. The net change from our previously disclosed Fiscal Year 2023 Scope 3 inventory and the restated inventory included in this report was an increase of 4.8%, falling below our significance threshold of 5%.
UNFI experienced an increase in Scope 3 emissions when compared to the restated prior year inventory. This increase largely corresponded with an overall increase in business volume, given that the products we buy and sell comprise our greatest indirect climate impact. With the enhanced capabilities of our new Scope 3 calculation vendor, we’re working with suppliers to better recognize their reduction efforts while providing tailored insights that help transform climate challenges into competitive advantages.
305-5 Reduction of GHG emissions
Nature & Ecosystem Health
Year-over-year methodological changes and other causes for reductions to Scope 1 and Scope 2 are described in UNFI’s 2025 CDP Corporate Questionnaire, section 7.10.1.
G4-FP9 Percentage and total of animals raised and/or processed, by species and breed type
We have not yet undertaken the exercise of collecting this information from our suppliers. However, UNFI published an official position statement on animal welfare in Fiscal Year 2023, and is working closely with suppliers to adapt to changing regulations and higher animal welfare expectations. In Fiscal Year 2025, we continued our enhanced tracking of products sold in accordance with higher animal welfare standards, and reported the percent of sales from eggs from cage-free, free range, and pasture raised environments as well as gestation crate-free pork.
DISCLOSURE
G4-FP10 Policies and practices, by species and breed type, related to physical alterations and the use of anesthetic
LOCATION / COMMENT
We have not yet undertaken the exercise of collecting this information from our suppliers.
Impact Pillar: Thriving Associates
Health & Safety
3-3 Management of material topics
GRI 401: Employment 2016
401-2 Benefits provided to full-time employees that are not provided to temporary or part-time employees
Our Approach to Governance, pg. 12
Thriving Associates, pg. 39-41
Inclusion & Well-being, pg. 21-22
Fiscal Year 2025 Form 10-K - Compensation and Benefits, pg. 9
GRI 403: Occupational Health and Safety 2018
403-1 Occupational health and safety management system
403-2 Hazard identification, risk assessment, and incident investigation
403-5 Worker training on occupational health and safety
Thriving Associates, pg. 40-41
403-8 Workers covered by an occupational health and safety management system
Thriving Associates, pg. 40-41
Thriving Associates, pg. 40-41
UNFI is not currently able to report on the exact number of workers covered by these systems, though they are in place in all distribution centers.
GRI Content Index
Engagement & Well-being
/ COMMENT
3-3 Management of material topics
Thriving Associates, pg. 42-49
Key Metrics, pg. 89
While much of the reporting we provide includes information from retail associates, demographic data provided does not.
Equal Opportunities
3-3 Management of material topics
Thriving Associates, pg. 50-51
GRI 405: Diversity and Equal Opportunity 2016
405-1 Diversity of governance bodies and employees
GRI 404: Training and Education 2016
We disclose this information annually in our EEO-1 report.
404-1 Average hours of training per year per employee
UNFI currently tracks the number training hours for associates that are able to access the Company’s platforms (this includes associates with a UNFI email address, excluding most distribution center associates and retail associates).
UNFI also administers live trainings in distribution centers, records trainings for wider distribution, and offers other development resources for associates without email addresses.
Thriving Associates, pg. 44-45, 49
DISCLOSURE
LOCATION / COMMENT
Eligible associates have access to our dynamic BetterU career development platform, which leverages best practices in adult-learning science and the latest research to ensure our programs deliver timely and relevant tools and skills. The platform houses our learning content on inclusion, safety, harassment, and more, and facilitates quarterly performance check-ins with a place to document and review development goals.
404-2 Programs for upgrading employee skills and transition assistance programs
We also deliver in-person trainings across our distribution center network, including trainings in Mental Health First Aid, de-escalation and mitigating workplace violence. We also provide opportunity for growth and mentorship through programs such as the Operations Leadership Program, Mentor Marketplace, and Circle Mentoring, and through our Belonging & Innovation Groups (BIGs). In Fiscal Year 2025, we focused on growing membership of our BIGs by warehouse associates, resulting in a significant increase in group membership. UNFI also provides education assistance.
Thriving Associates, pg. 42-45, 48-52
Impact Pillar: Efficient and Sustainable Operations
Climate Mitigation and Adaptation (in Our Operations)
3-3 Management of material topics
GRI 305: Emissions 2016
305-1 Direct (Scope 1) GHG emissions
305-2 Energy indirect (Scope 2) GHG emissions
Energy Use
3-3 Management of material topics
Efficient and Sustainable Operations, pg. 55-56
Key Metrics, pg. 88
Key Metrics, pg. 88
UNFI continues to report emissions data one fiscal year behind the current reporting period – all reported emissions cover Fiscal Year 2024 or Reporting Year 2024 activities. UNFI has recently pursued external verification of Scopes 1 and 2 (both market-based and location-based) to a limited level of assurance and is assessing what verification options are best moving forward.
Efficient and Sustainable Operations, pg. 55, 60-61
Key Metrics, pg. 88
GRI Content Index
DISCLOSURE
GRI 302: Energy 2016
LOCATION / COMMENT
UNFI’s operational energy disclosures currently reflect purchased electricity and natural gas. Additional energy sources are currently excluded while the company assesses its ability to consistently measure them.
302-1 Energy consumption within the organization
302-3 Energy intensity
302-4 Reduction of energy consumption
As of Fiscal Year 2025, operational energy disclosures are inclusive of our entire operations in both the U.S. and Canada.
Efficient and Sustainable Operations, pg. 55, 60-63
In Fiscal Year 2023, UNFI phased out its official energy intensity target, reported against since 2020, in favor of our approved facilities-focused science-based emissions reduction target. The company will continue to monitor energy intensity internally.
Efficient and Sustainable Operations, pg. 60
Efficient and Sustainable Operations, pg. 55, 60-63
3-3 Management of material topics
Efficient and Sustainable Operations, pg. 55, 66-67
In Fiscal Year 2025, UNFI enhanced our internal system for routing excess food and minimizing waste. We implemented trainings across our distribution center network to skill up associates on the system, empowering them to make data-driven decisions. We also engaged a new waste management vendor, helping streamline waste data across DCs, and are creating tailored processes for routing waste at each DC.
306-1 Waste generation and significant waste-related impacts
306-2 Management of significant waste-related impacts
Efficient and Sustainable Operations, pg. 66-67
Efficient and Sustainable Operations, pg. 66-67
Waste Generation & Diversion
GRI 306: Waste 2020
DISCLOSURE
306-3 Waste generated
306-4 Waste diverted from disposal
306-5 Waste directed to disposal
LOCATION / COMMENT
Efficient and Sustainable Operations, pg. 66-67 Key Metrics, pg. 90
Efficient and Sustainable Operations, pg. 66-67 Key Metrics, pg. 90
Efficient and Sustainable Operations, pg. 66-67 Key Metrics, pg. 90
Impact Pillar: Nourishing Communities
Community Health & Safety
3-3 Management of material topics
Nourished Communities, pg. 69-70
GRI 416: Customer Health and Safety 2016
416-1 Assessment of the health and safety impacts of product and service categories
Nourished Communities, pg. 70-75
UNFI does not currently report its assessment of the health and safety impacts of product and service categories, though its comprehensive safety program encompasses Food Safety and Quality Assurance (FSQA), along with a number of other safety teams.
G4-FP5 Percentage of production volume manufactured in sites certified by an independent third party according to internationally recognized food safety management system standards
Nourished Communities, pg. 73-74
GRI Content Index
DISCLOSURE
Community Livelihood
3-3 Management of material topics
GRI 201: Economic Performance 2016
LOCATION / COMMENT
Thriving Associates, pg. 46
Nourished Communities, pg. 69, 80
201-1 Direct economic value generated and distributed
201-2 Financial implications and other risks and opportunities due to climate change
UNFI does not currently publicly report total economic value generated and distributed, though we do report on community investments, which are related to this value.
Statements in this report that are not historical facts are "forward-looking statements" that involve risks and uncertainties and are based on current expectations and management estimates; actual results may differ materially. Examples of these statements include, but are not limited to, statements regarding our long-term goals and plans for various impact initiatives. In some cases, you can identify these statements by forward-looking words such as "anticipate," "believe," "could," "estimate," "expect," "intend," "may," "plan," "seek," "should," "will," and "would," or similar words. The risks and uncertainties which could impact these statements are described in the Company's filings under the Securities Exchange Act of 1934, as amended, including its annual report on Form 10-K for the year ended August 2, 2025 filed with the Securities and Exchange Commission (the "SEC") on October 1, 2025 and other filings the Company makes with the SEC, and include, but are not limited to, our dependence on principal customers; the relatively low margins of our business, which are sensitive to inflationary and deflationary pressures and intense competition, including as a result of the continuing consolidation of retailers and the growth of consumer choices for grocery and consumable purchases; our ability to realize the anticipated benefits of our strategic initiatives; changes in relationships with our suppliers; our ability to develop, implement, operate and maintain, and rely on third parties to operate and maintain, reliable and secure technology systems, and the effectiveness of our business continuity plans in response to an incident impacting our technology systems, such as the unauthorized incident on our technology systems; labor and other workforce shortages and challenges; the addition or loss of significant customers or material changes to our relationships with these customers; our ability to realize anticipated benefits of our strategic transactions; our ability to continue to grow sales, including of our higher margin natural and organic foods and non-food products; our ability to maintain sufficient volume in our Natural and Conventional businesses to support our operating infrastructure; our ability to access additional capital; increases in healthcare, pension and other costs under our single employer benefit plan and multi-employer benefit plans; the potential for additional asset impairment charges; our sensitivity to general economic conditions including inflation, tariff policy and changes in disposable income levels and consumer purchasing habits; our ability to timely and successfully deploy our warehouse management system throughout our DCs and our transportation management system across the Company and to achieve efficiencies and cost savings from these efforts; the potential for disruptions in our supply chain or our distribution capabilities from circumstances beyond our control, including due to lack of long-term contracts, severe weather, labor shortages or work stoppages or otherwise; the effect of adverse decisions in, or settlement of, litigation or other proceedings to which we are subject; moderated supplier promotional activity, including decreased forward buying opportunities; union-organizing activities that could cause labor relations difficulties and increased costs; changes in tax laws and regulations, and actions by federal, state and local taxing authorities related to the interpretation and application of such tax laws and regulations; our ability to maintain food quality and safety; and volatility in fuel costs. Any forward-looking statements are made pursuant to the Private Securities Litigation Reform Act of 1995 and, as such, speak only as of the date made. You should not place undue reliance on any forward-looking statements.
Thank You
We are grateful for the dedication and commitment of more than 100 UNFI associates who contributed to this report, and even more who make this work possible every day. They generously shared their time, energy, and knowledge to document progress, celebrate achievements, and ensure we remain on track to our purpose of Better Food. Better Future. Thank you!