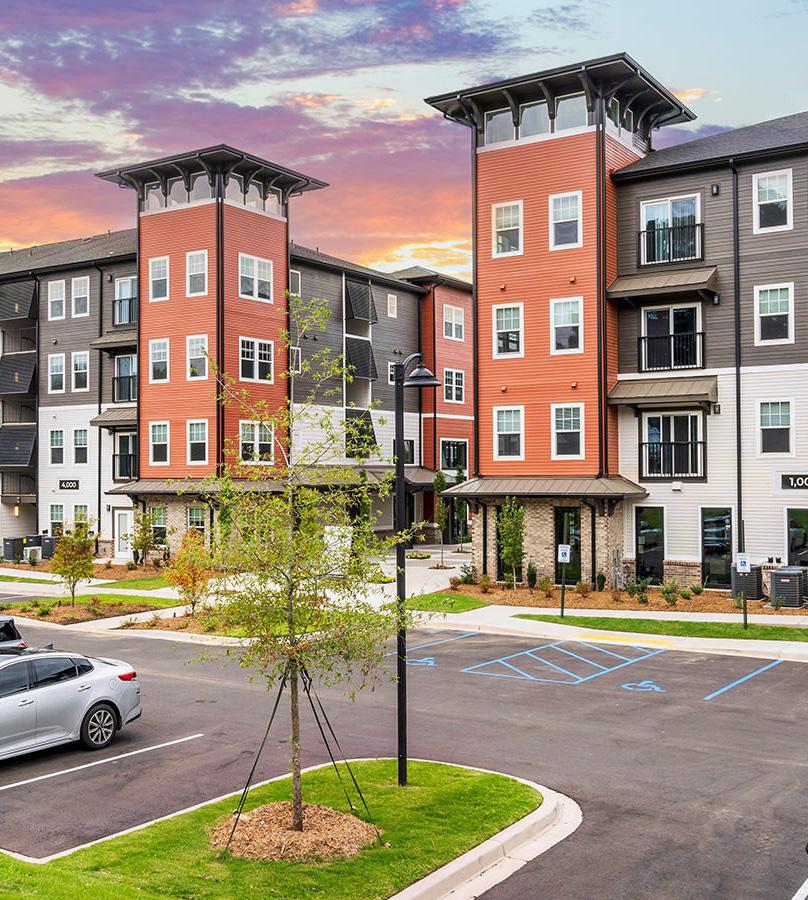
BERKSHIRE HATHAWAY AND JEFFERIES FINANCIAL GROUP COMPANY CLASS A+ OPPORTUNITY 250 VICTOR AVENUE • GREER, SOUTH CAROLINA
A


CAROLINAS MULTIFAMILY INVESTMENT SALES TEAM
CAROLINAS SALES TEAM $3,563,136,027 TOTAL SALES 28,256 TOTAL UNITS 210 TOTAL COMMUNITIES CURRENT SALES ACTIVITY
BURLINGTON DURHAM ROCKY MOUNT WILSON RALEIGH MORGANTON NORTH CAROLINA SOUTH CAROLINA COASTAL GEORGIA CHARLOTTE SPARTANBURG GREENVILLE ANDERSON GREENWOOD FLORENCE COLUMBIA MYRTLE BEACH AUGUSTA CHARLESTON SAVANNAH BRUNSWICK FAYETEVILLE JACKSONVILLE WILMINGTON ASHEVILLE GREENBORO $27B 2021 INVESTMENT SALES TRANSACTION VOLUME #1 COMBINED FREDDIE MAC, FANNIE MAE AND FH ORIGINATION VOLUME $337B SERVICING PORTFOLIO UPB *Map reflected sales as of 2015 to current. COMPANY-WIDE STATS
MARK BOYCE Managing Director 843.628.376 5 mark.boyce@berkadia.com BLAKE COFFEY Director 843.628.3766 blake.coffey@berkadia.com
CALEB TROOP Managing Director 314.607.3481 caleb.troop@berkadia.com
INVESTMENT SALES CALEB TROOP MANAGING DIRECTOR 314.607.3481 caleb.troop@berkadia.com MARK BOYCE MANAGING DIRECTOR 843.628.3765 mark.boyce@berkadia.com BLAKE COFFEY DIRECTOR 843.628.3766 blake.coffey@berkadia.com MORTGAGE BANKING JOSH FINLEY SENIOR DIRECTOR 404.654.259 josh.finley@berkadia.com RICHARD LEVINE SENIOR MANAGING DIRECTOR 404.654.2590 richard.levine@berkadia.com JOHN BRAY SENIOR MANAGING DIRECTOR 404.654.2595 john.bray@berkadia.com BERKADIA ATLANTA, GA | Three Alliance Center | 3550 Lenox Road, Suite 2600 | Atlanta, GA 30326 CHARLOTTE, NC | 6000 Fairview Road | Suite 1200 | Charlotte, NC 28210 CHARLESTON, SC | 207 East Bay Street | Suite 301 & 312 | Charleston, SC 29401
CONTENTS THE PROPERTY 05 FINANCIALS 29 MARKET POSITIONING 14 MARKET OVERVIEW 35
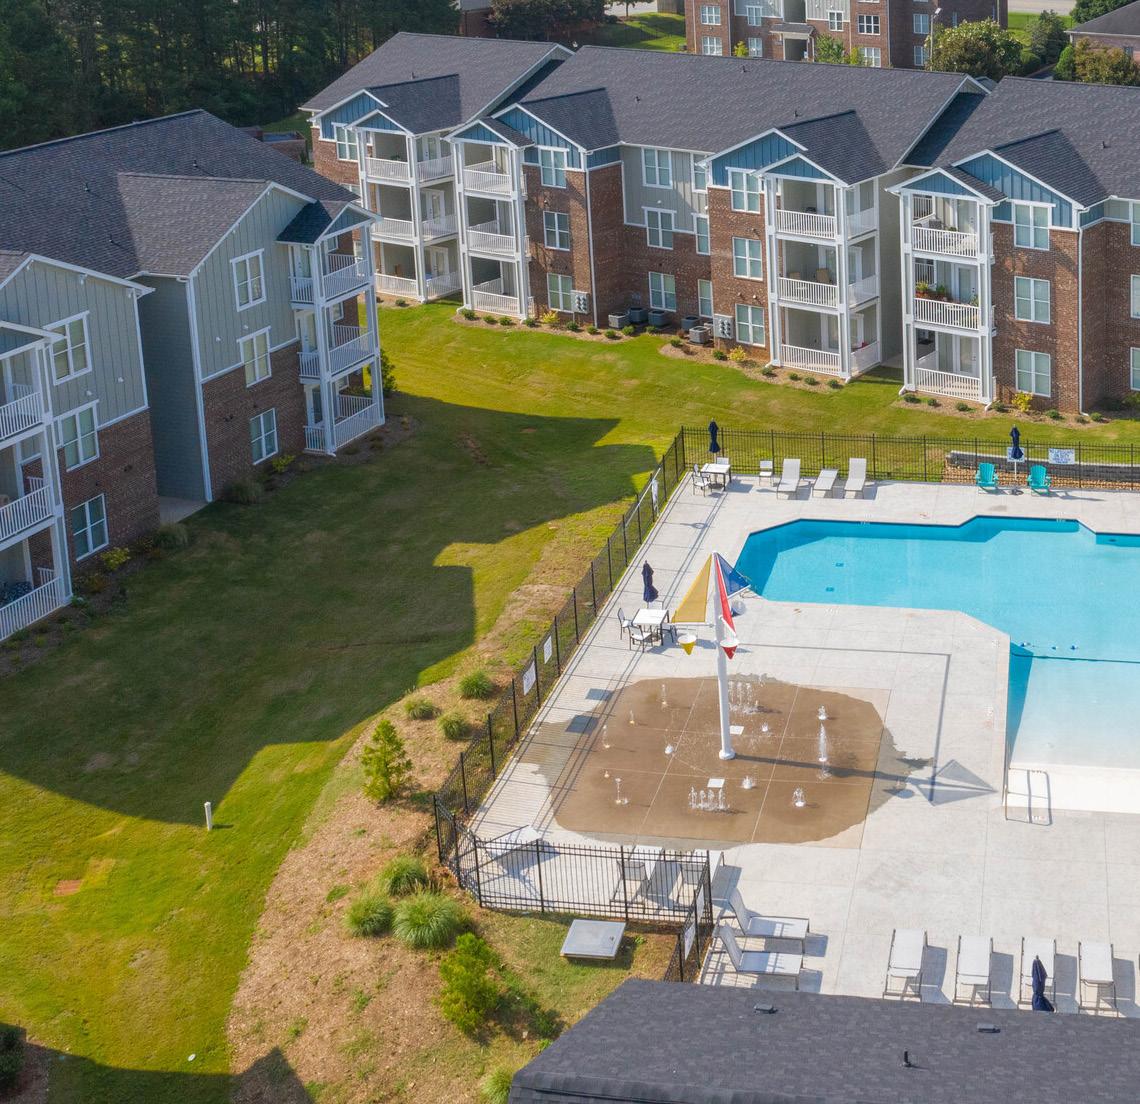
THE PROPERTY
PROPERTY SUMMARY
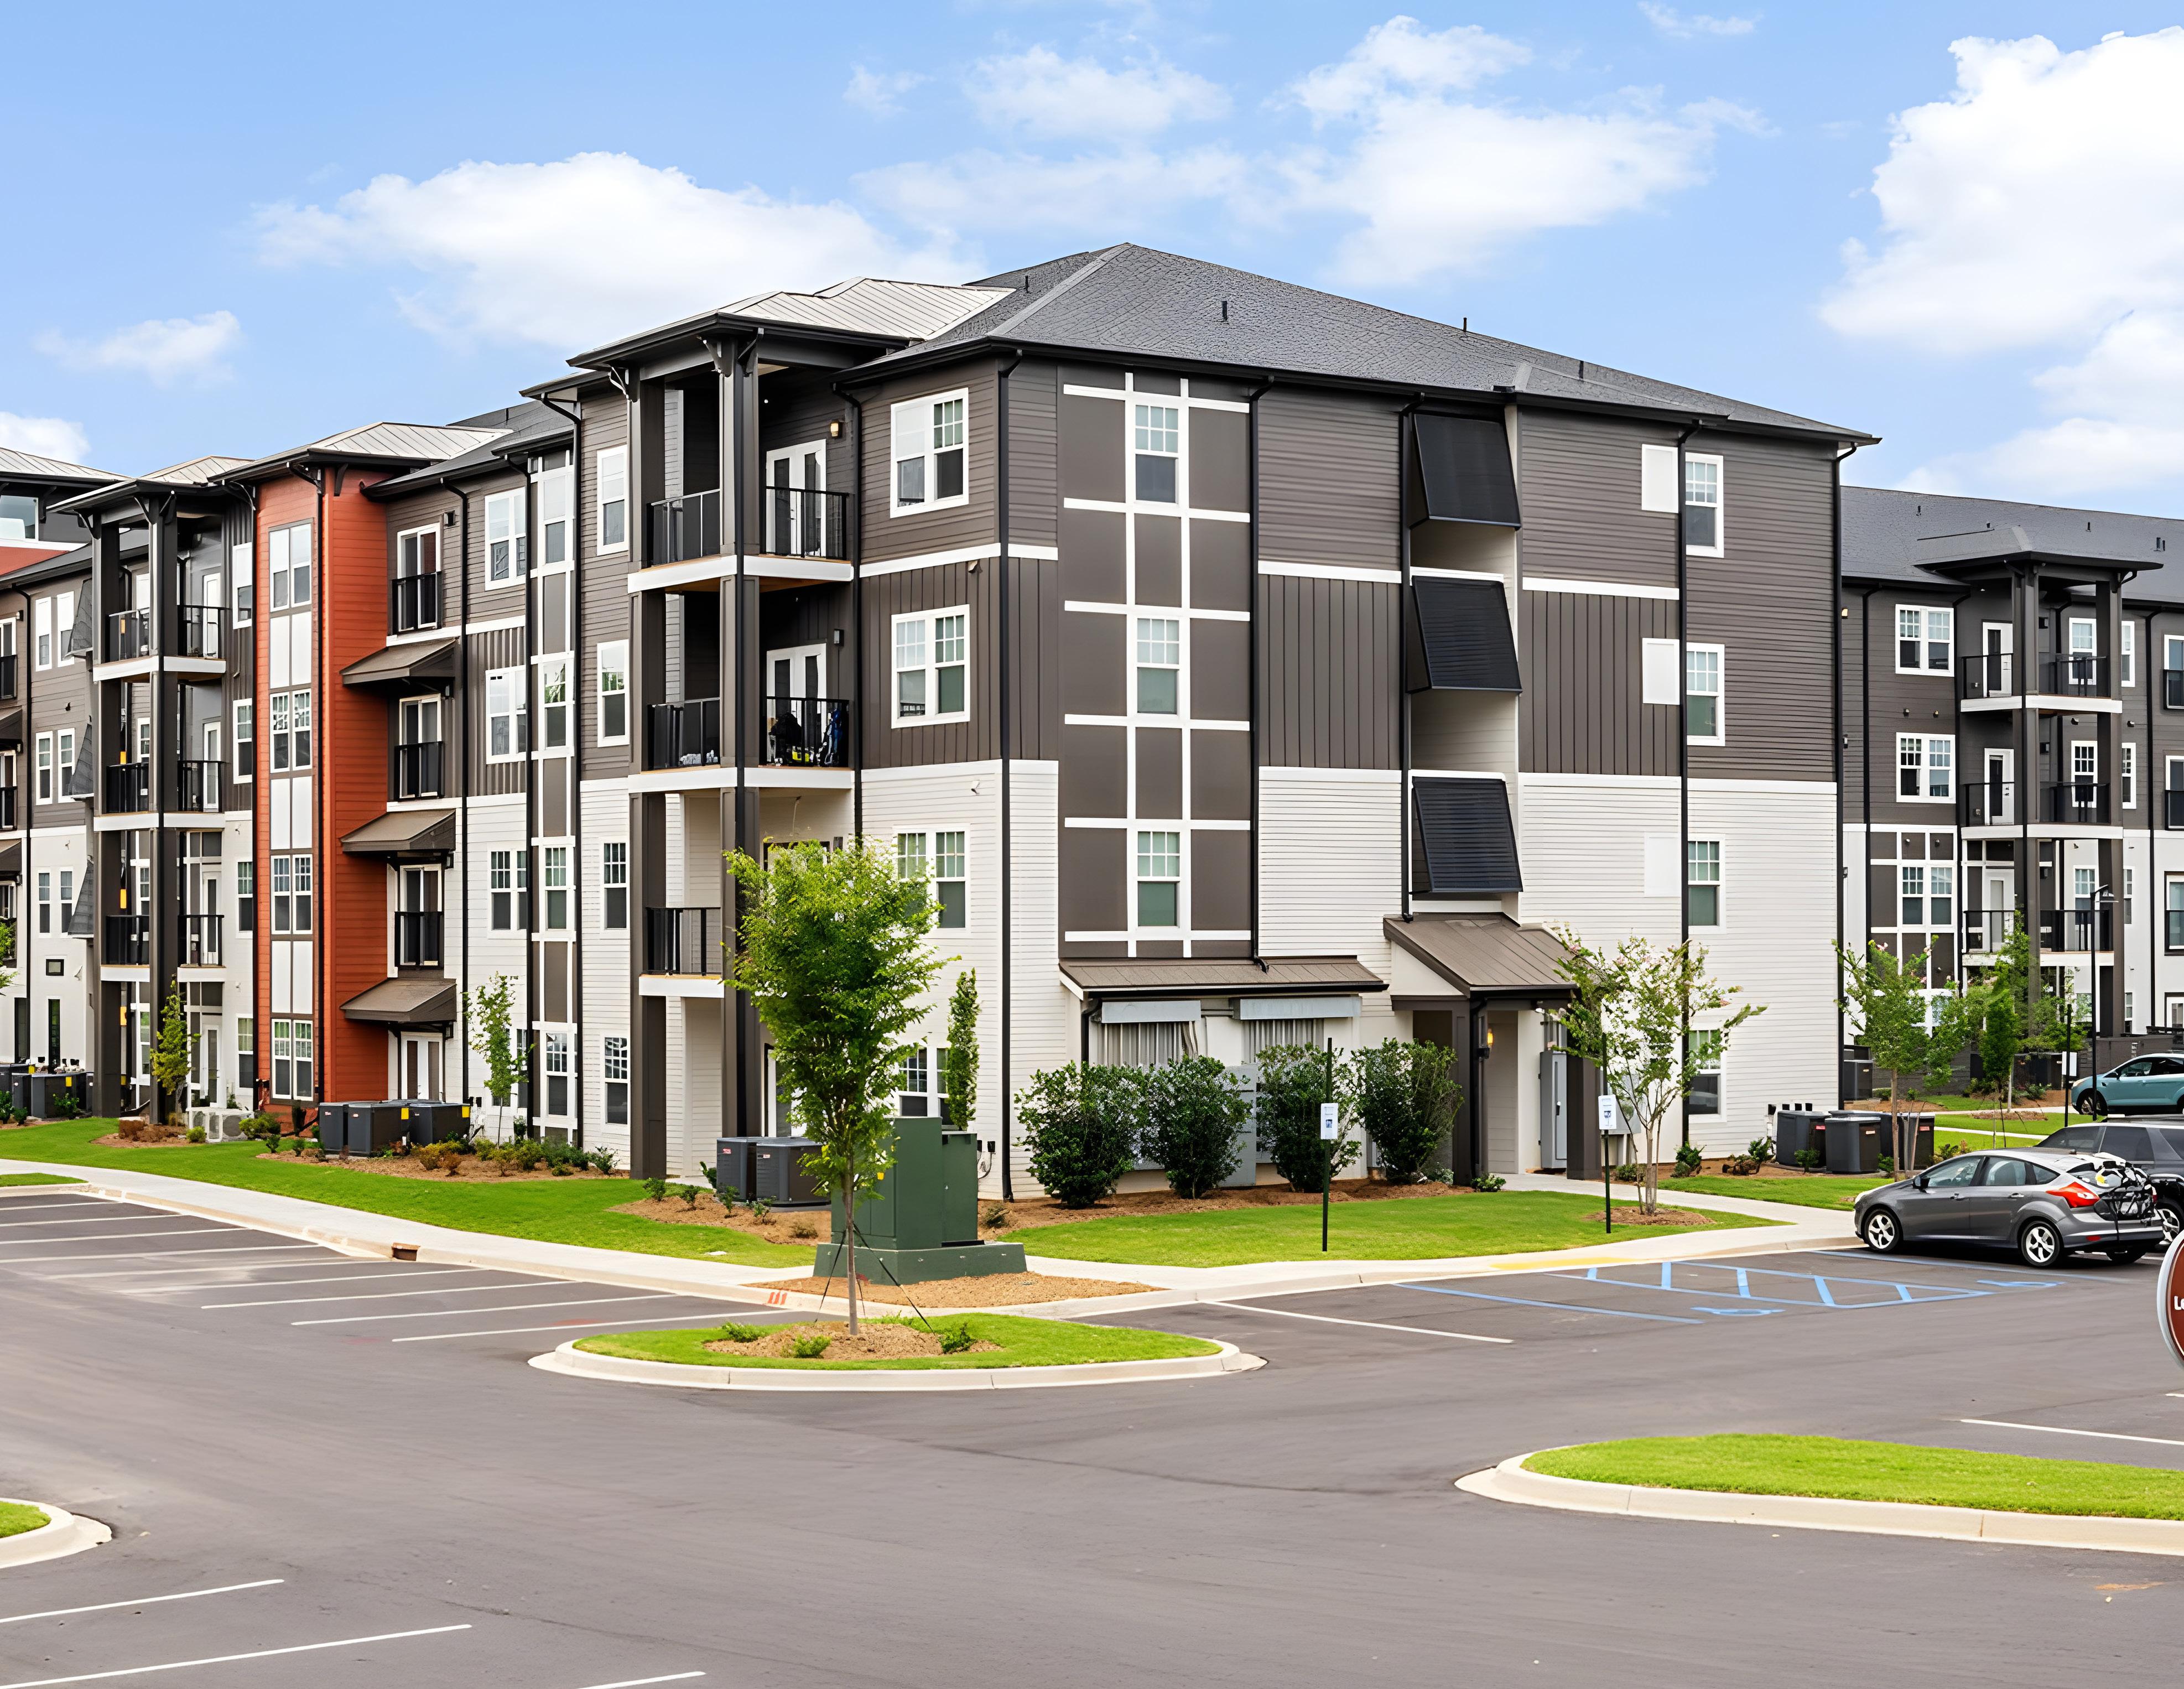
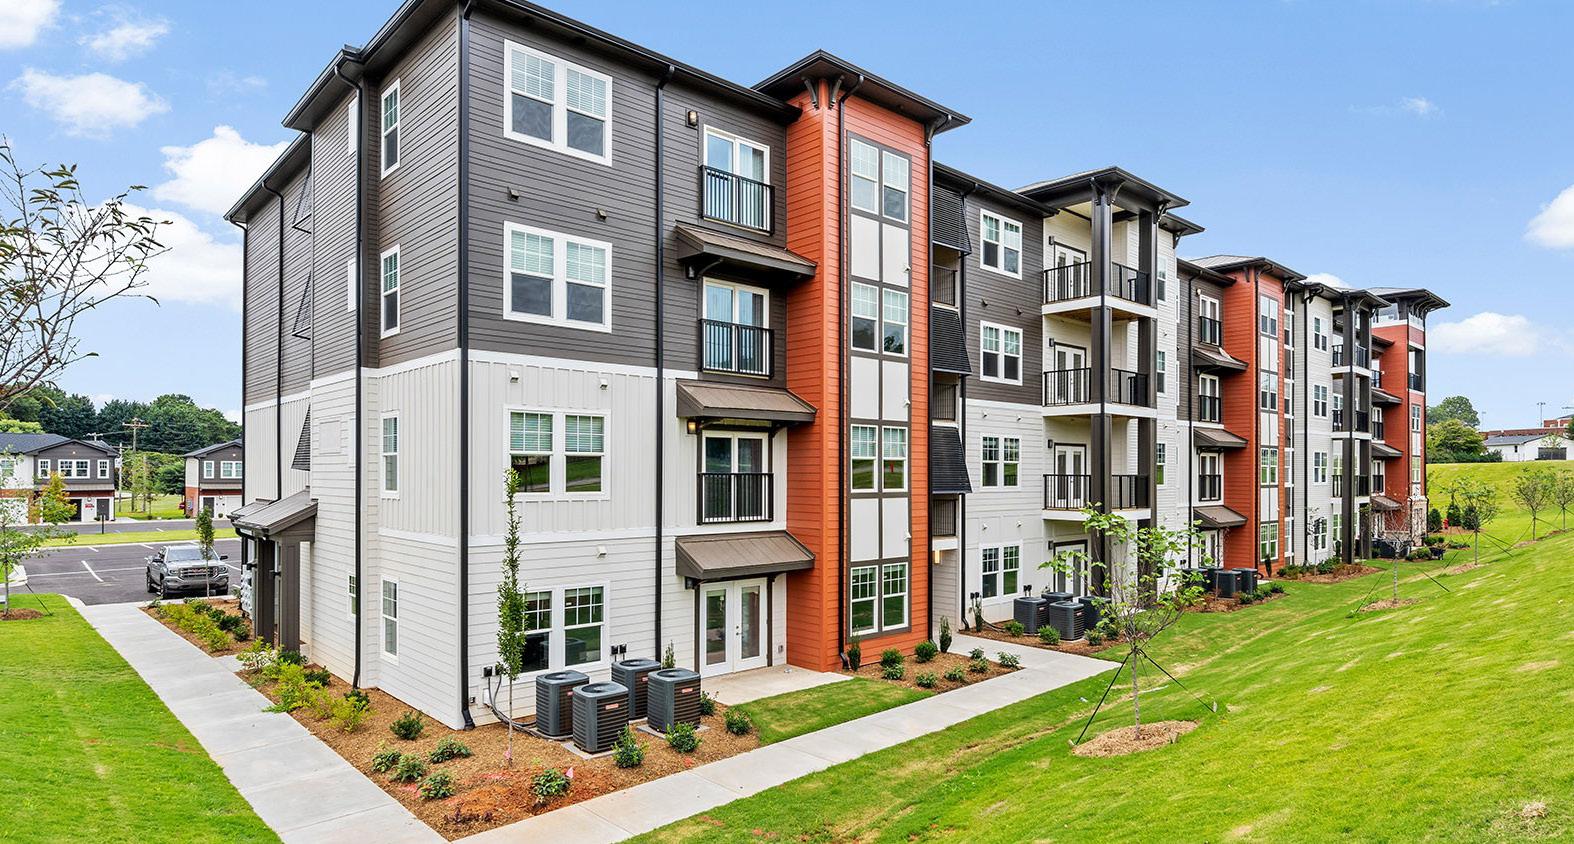
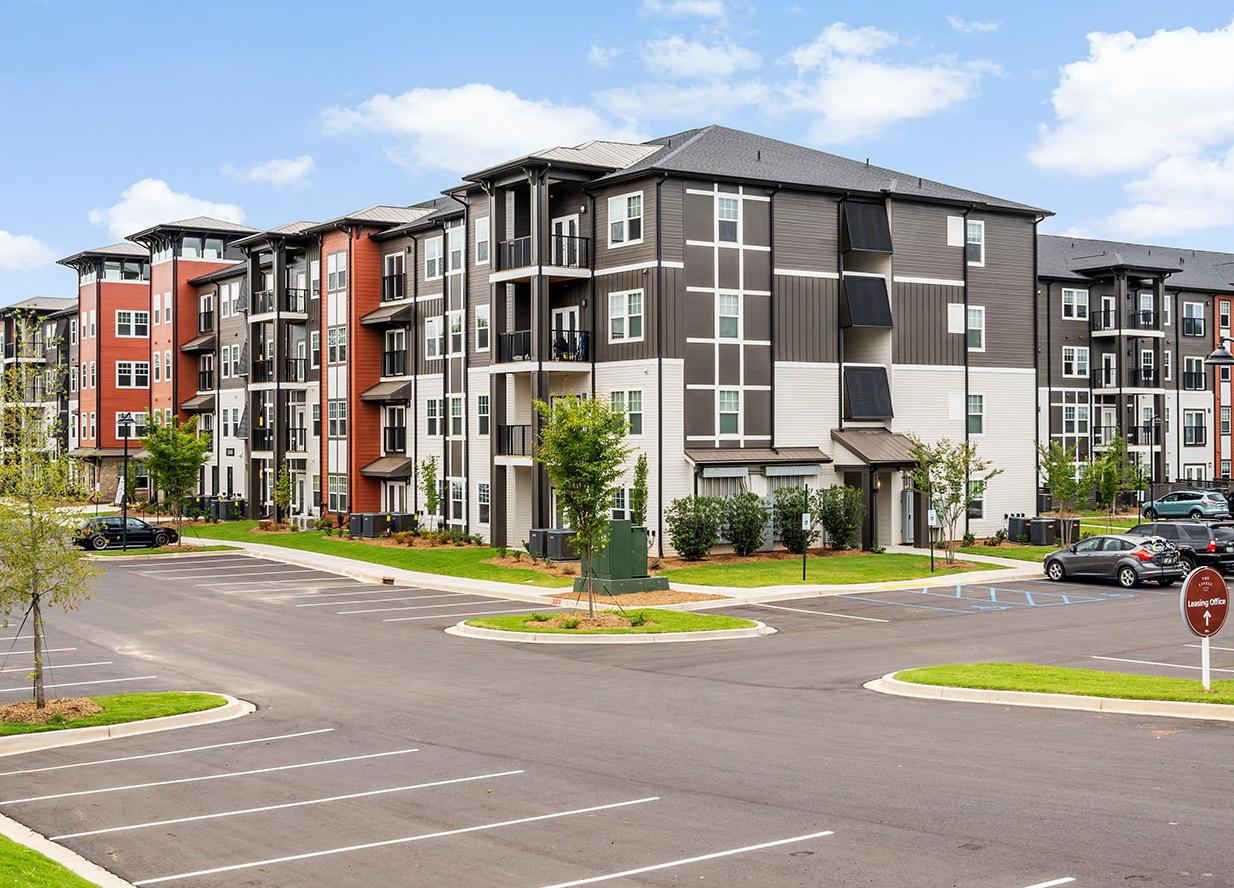
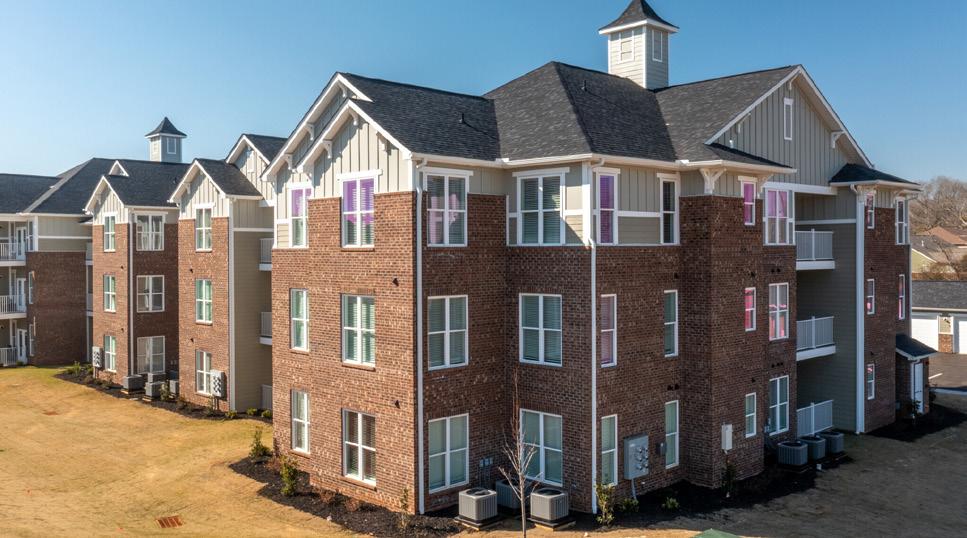
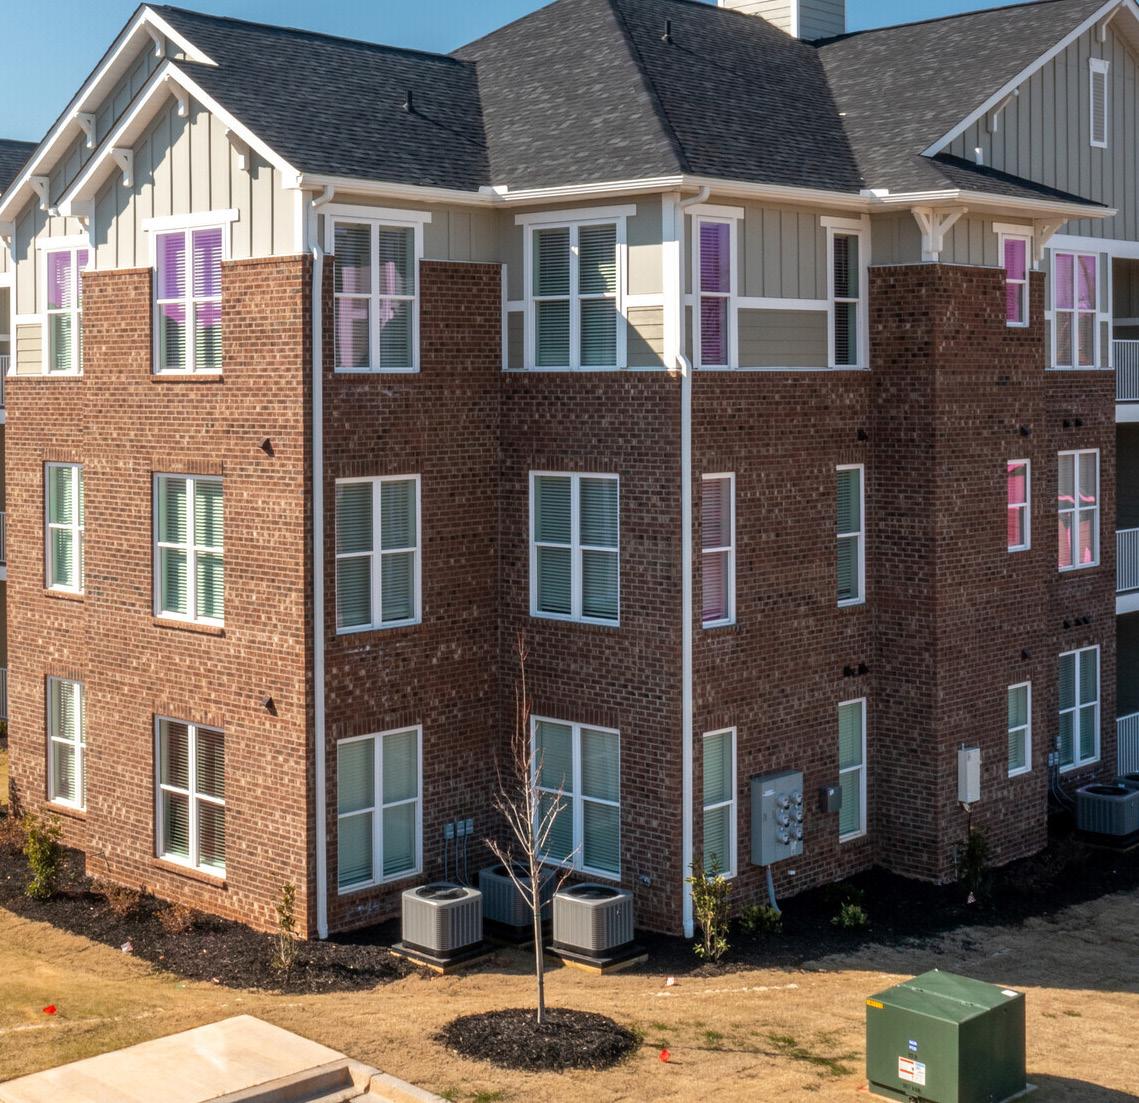
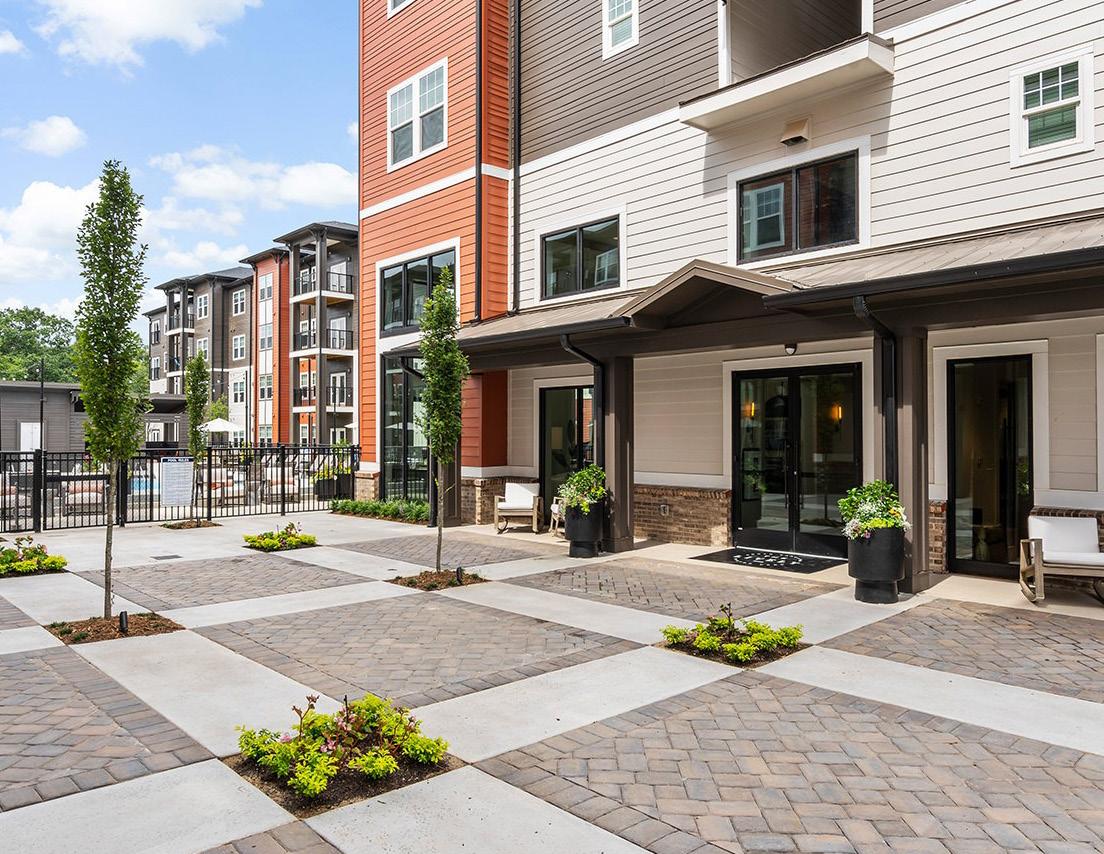
PROPERTY DESCRIPTION
# of total units 318 Style Low-rise Type Multifamily
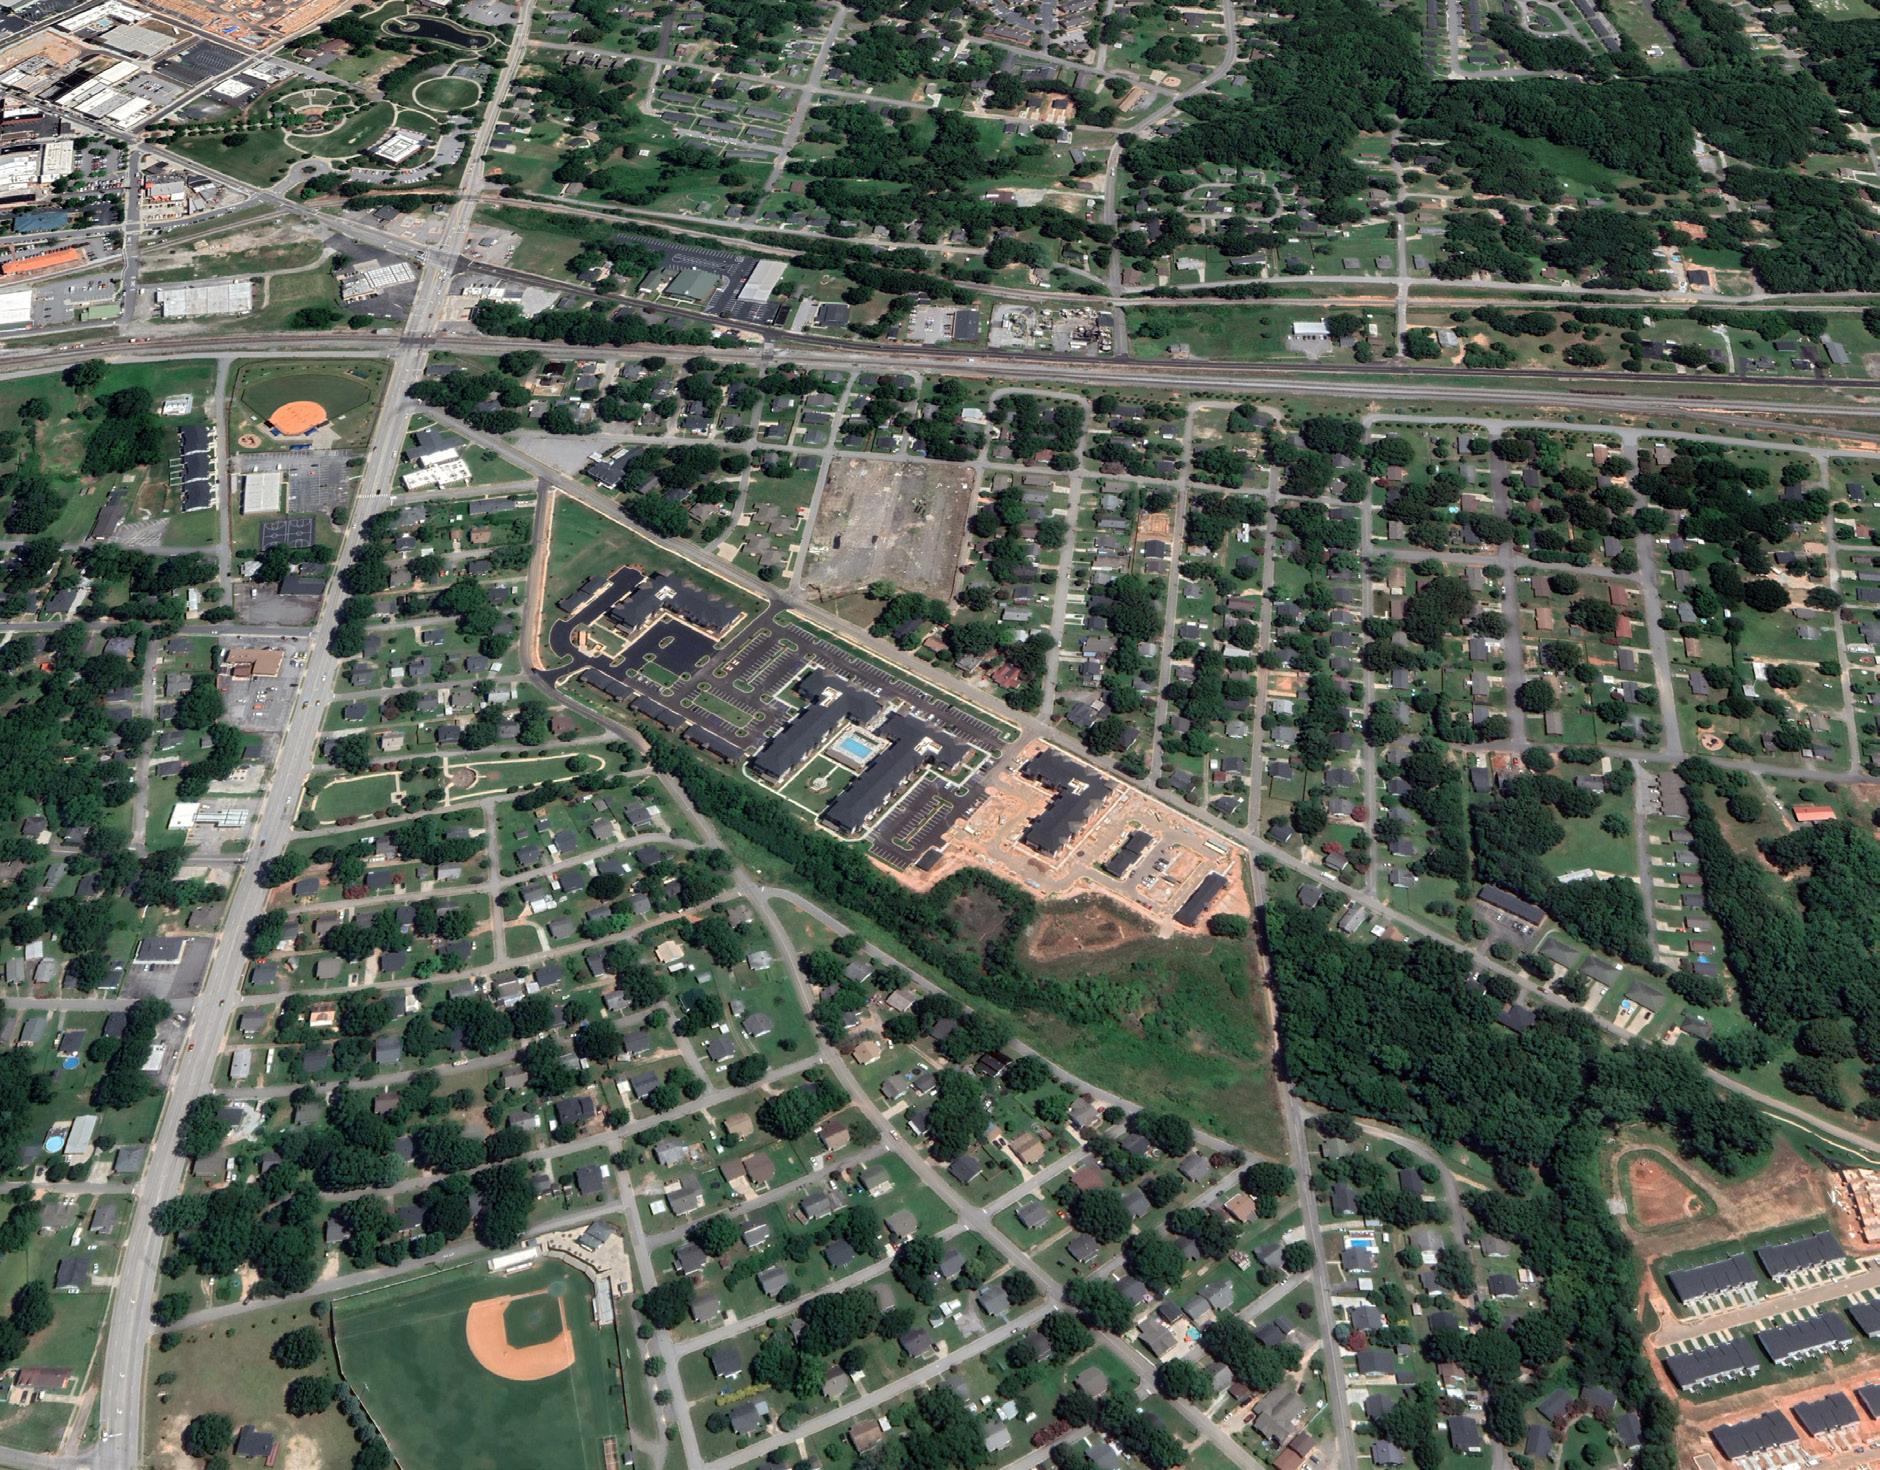
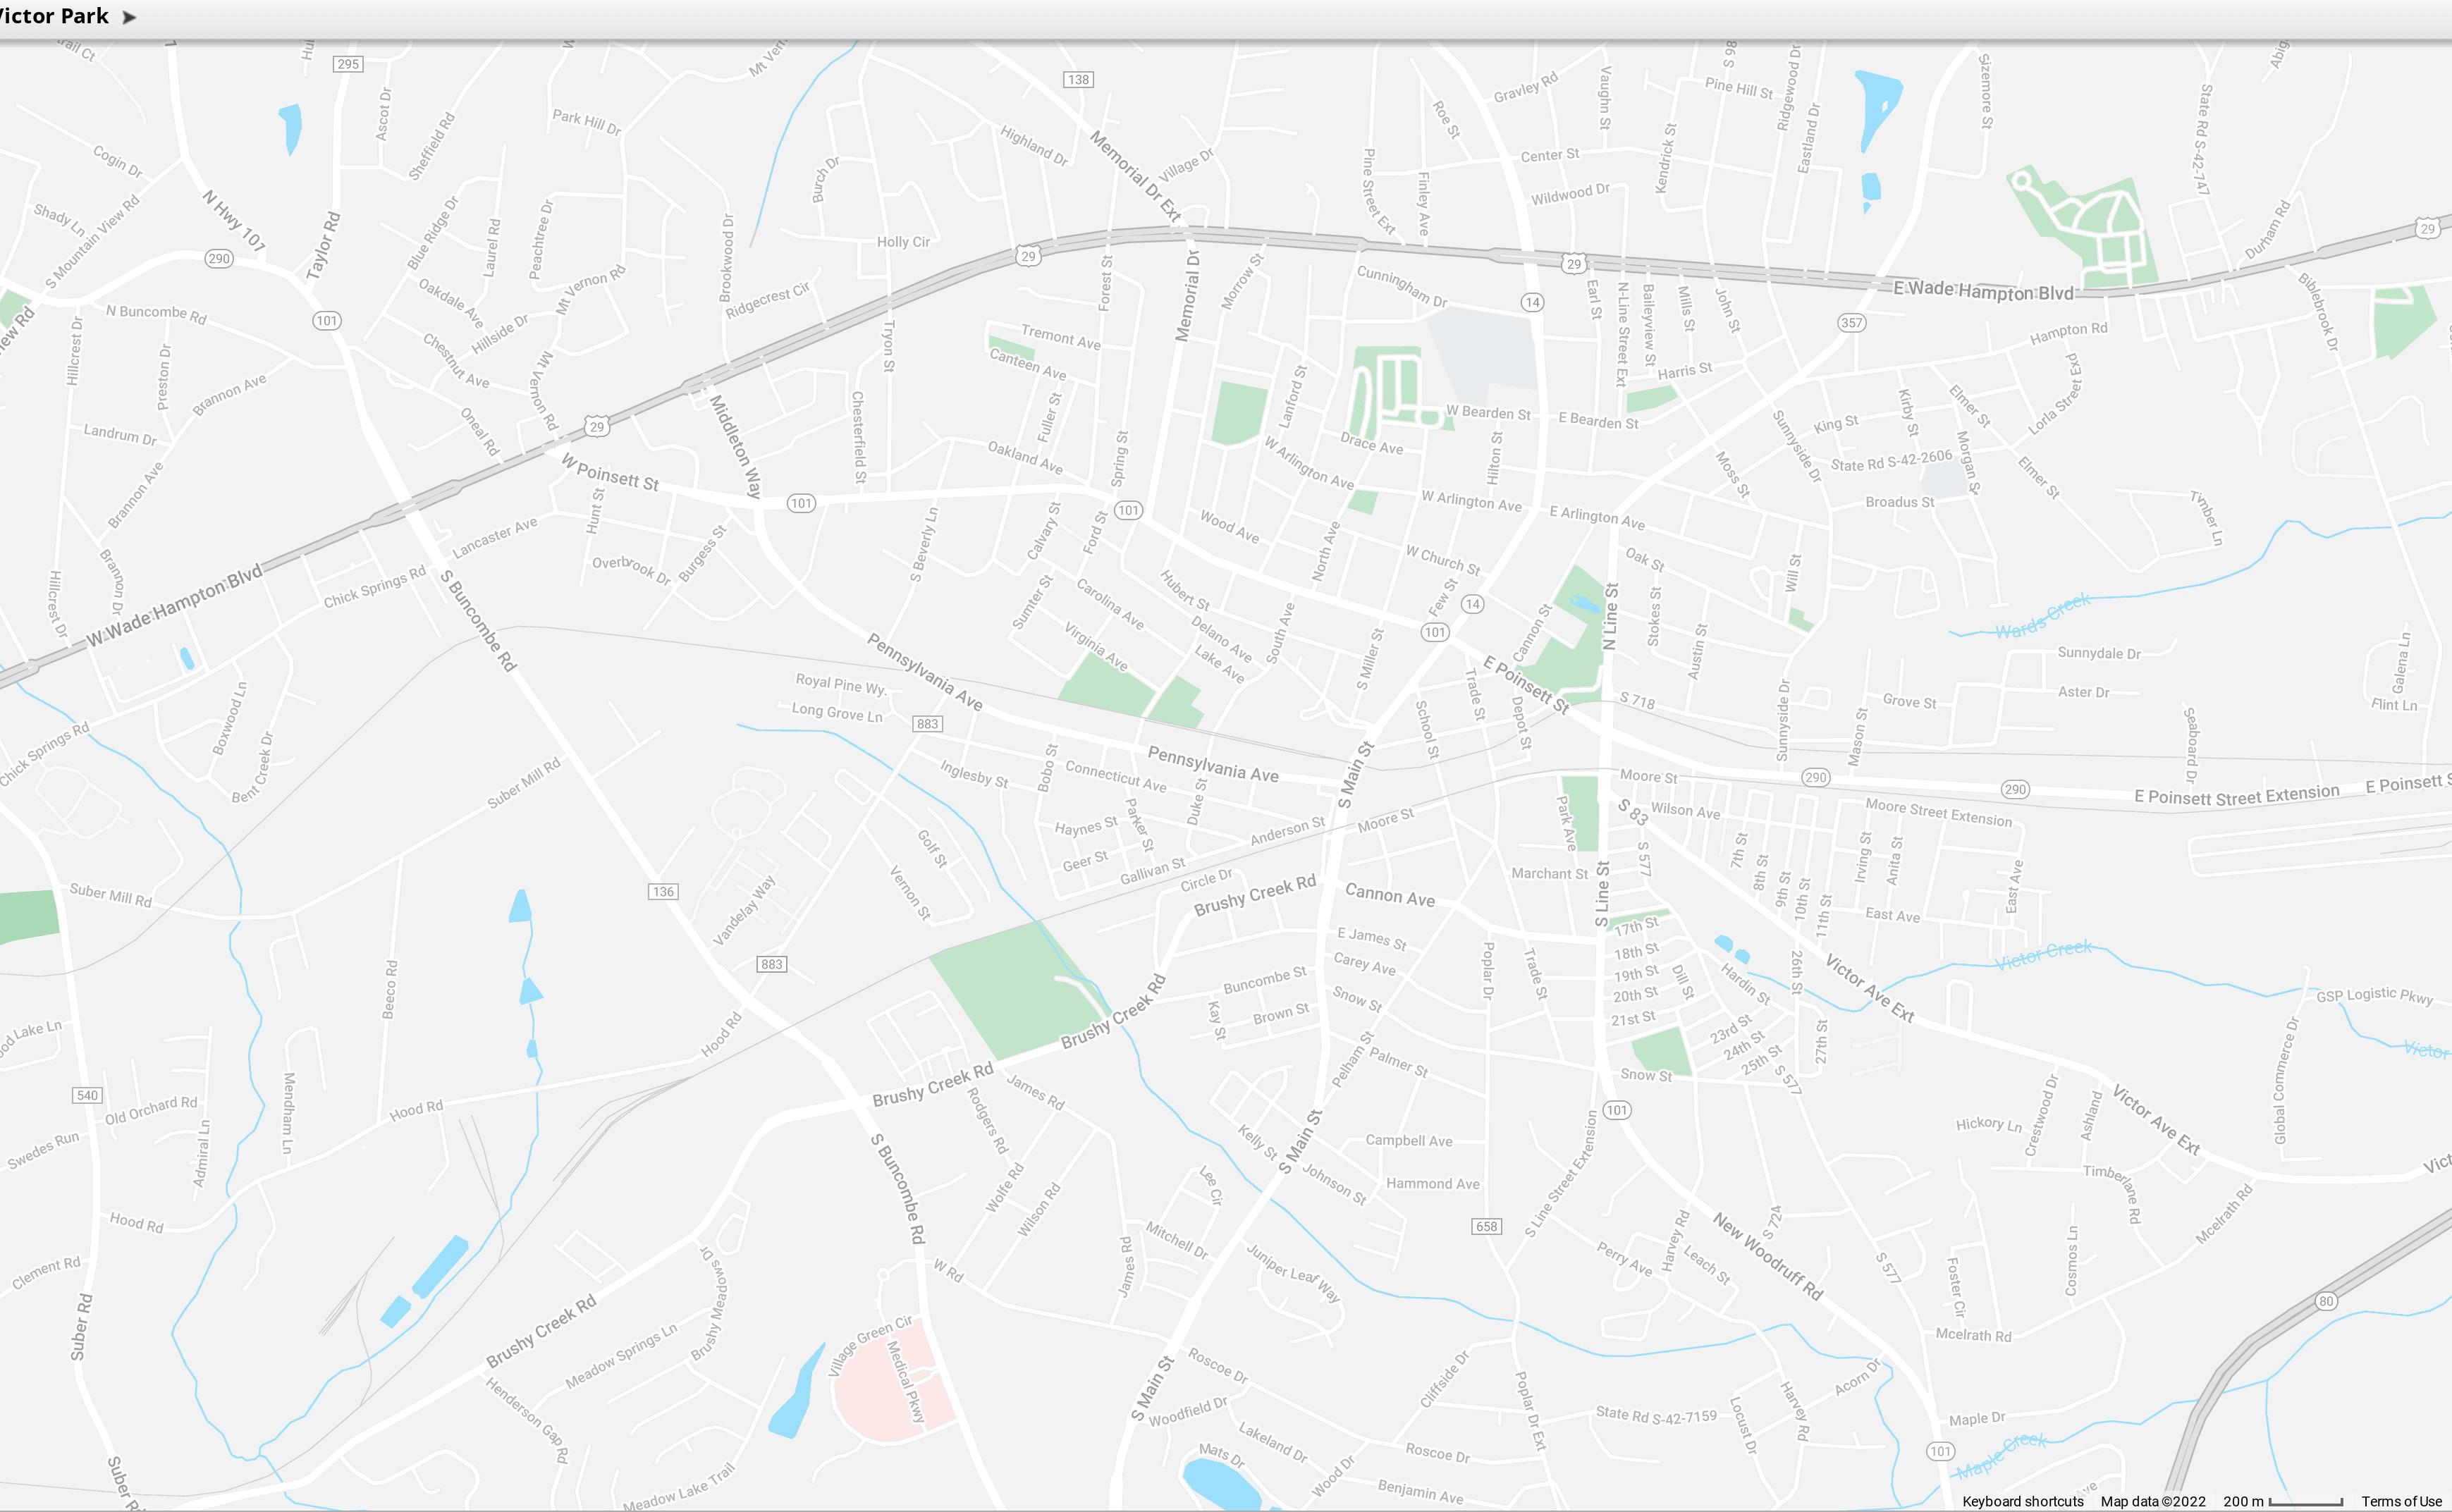
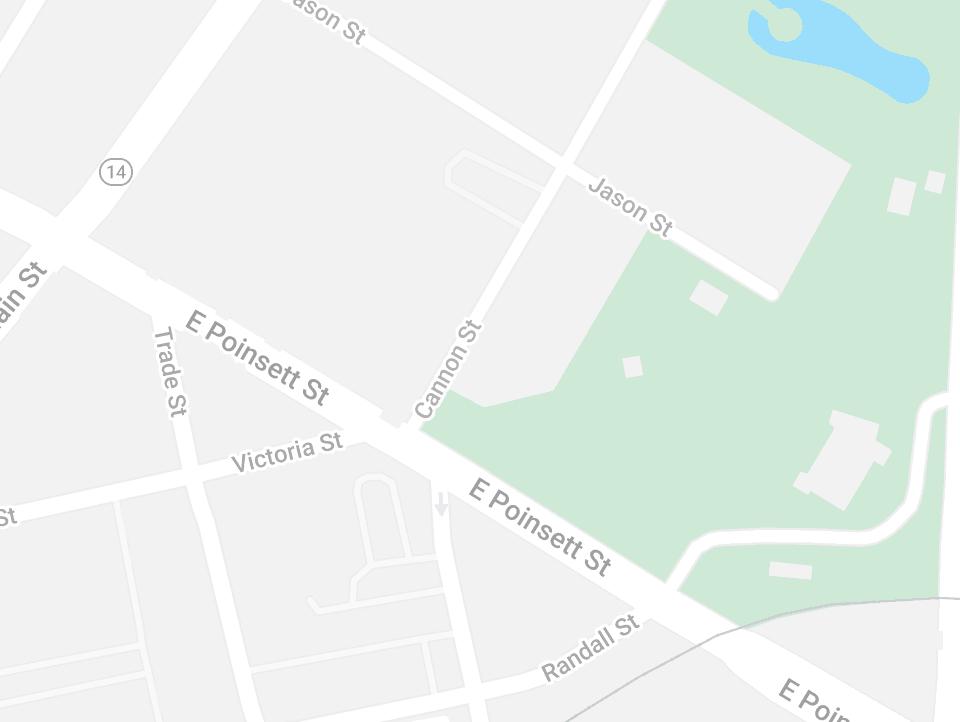
Distance from Downtown 0.7 Miles SE of the city’s center and 15 miles NE of Downtown Greenville
Location Along Victor Ave., between S. Line St. and 26th St.
Year built 2022 – slated to complete in november 2022
# of total buildings 11 (Including leasing office / clubhouse)
# of stories/floors in each building Four story
Exterior building materials Brick and siding
Roof type Pitched roofs with shingles
Acres of land 20.93 acres
Density 15.19 units per acre
Pets allowed Yes
Major street exposure U.S. Route 29 / Wade Hampton Blvd.
Views Man-made lake
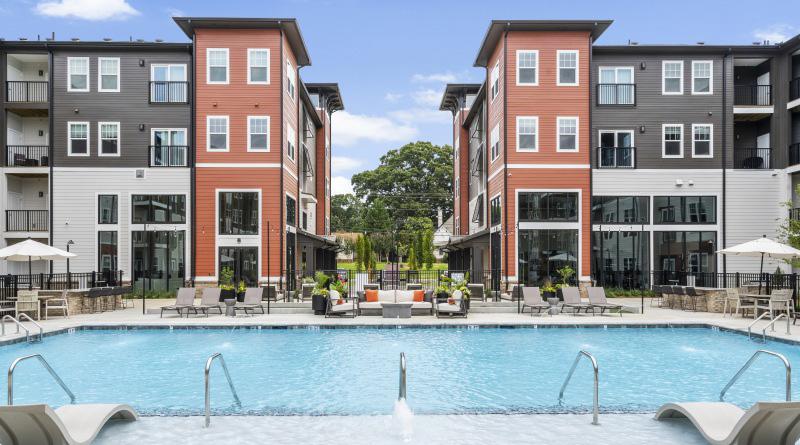
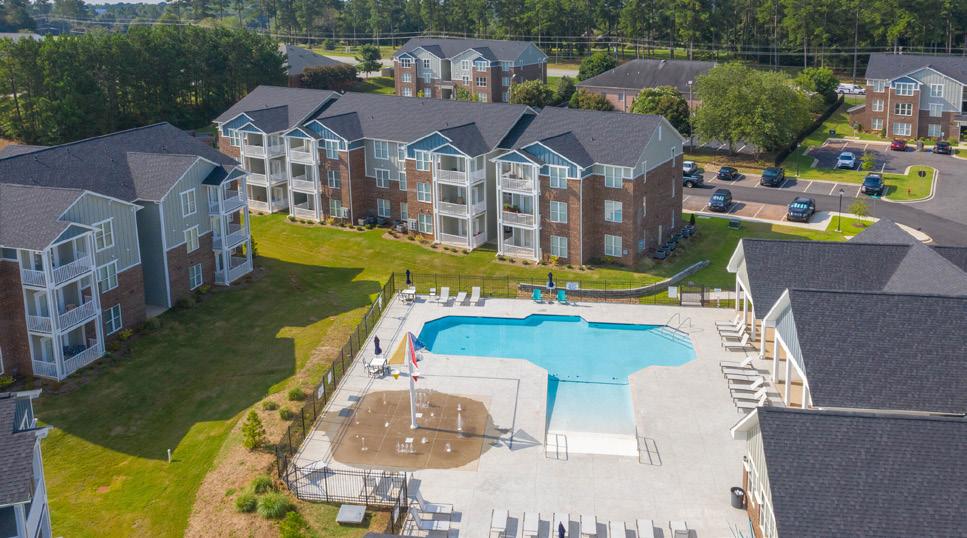
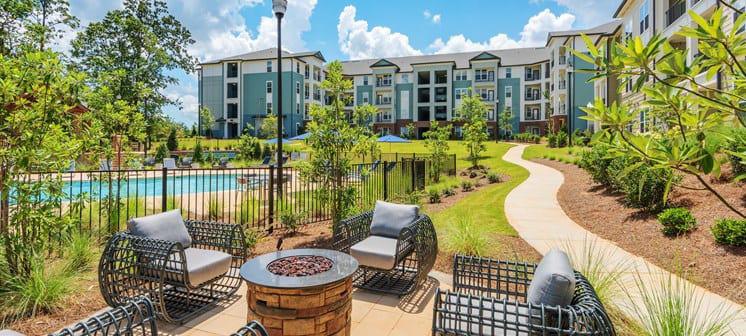
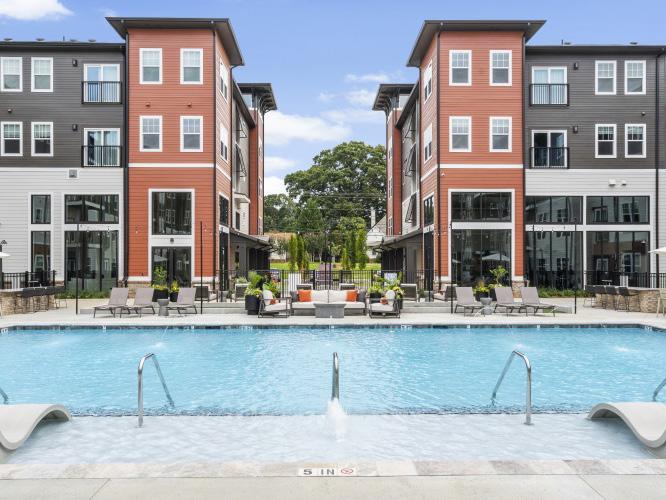
THE LIVELY The Pro P er T y 6

THE LIVELY The Pro P er T y 7 S Line St VictorAve NORTH 290 UNIT MIX 18 STUDIO UNITS 478 – 670 SF 146 TWO-BEDROOM UNITS 865 – 1,205 SF 108 ONE-BEDROOM UNITS 579 – 1,048 SF 46 THREE-BEDROOM UNITS 1,206 SF
COMMUNITY AMENITIES
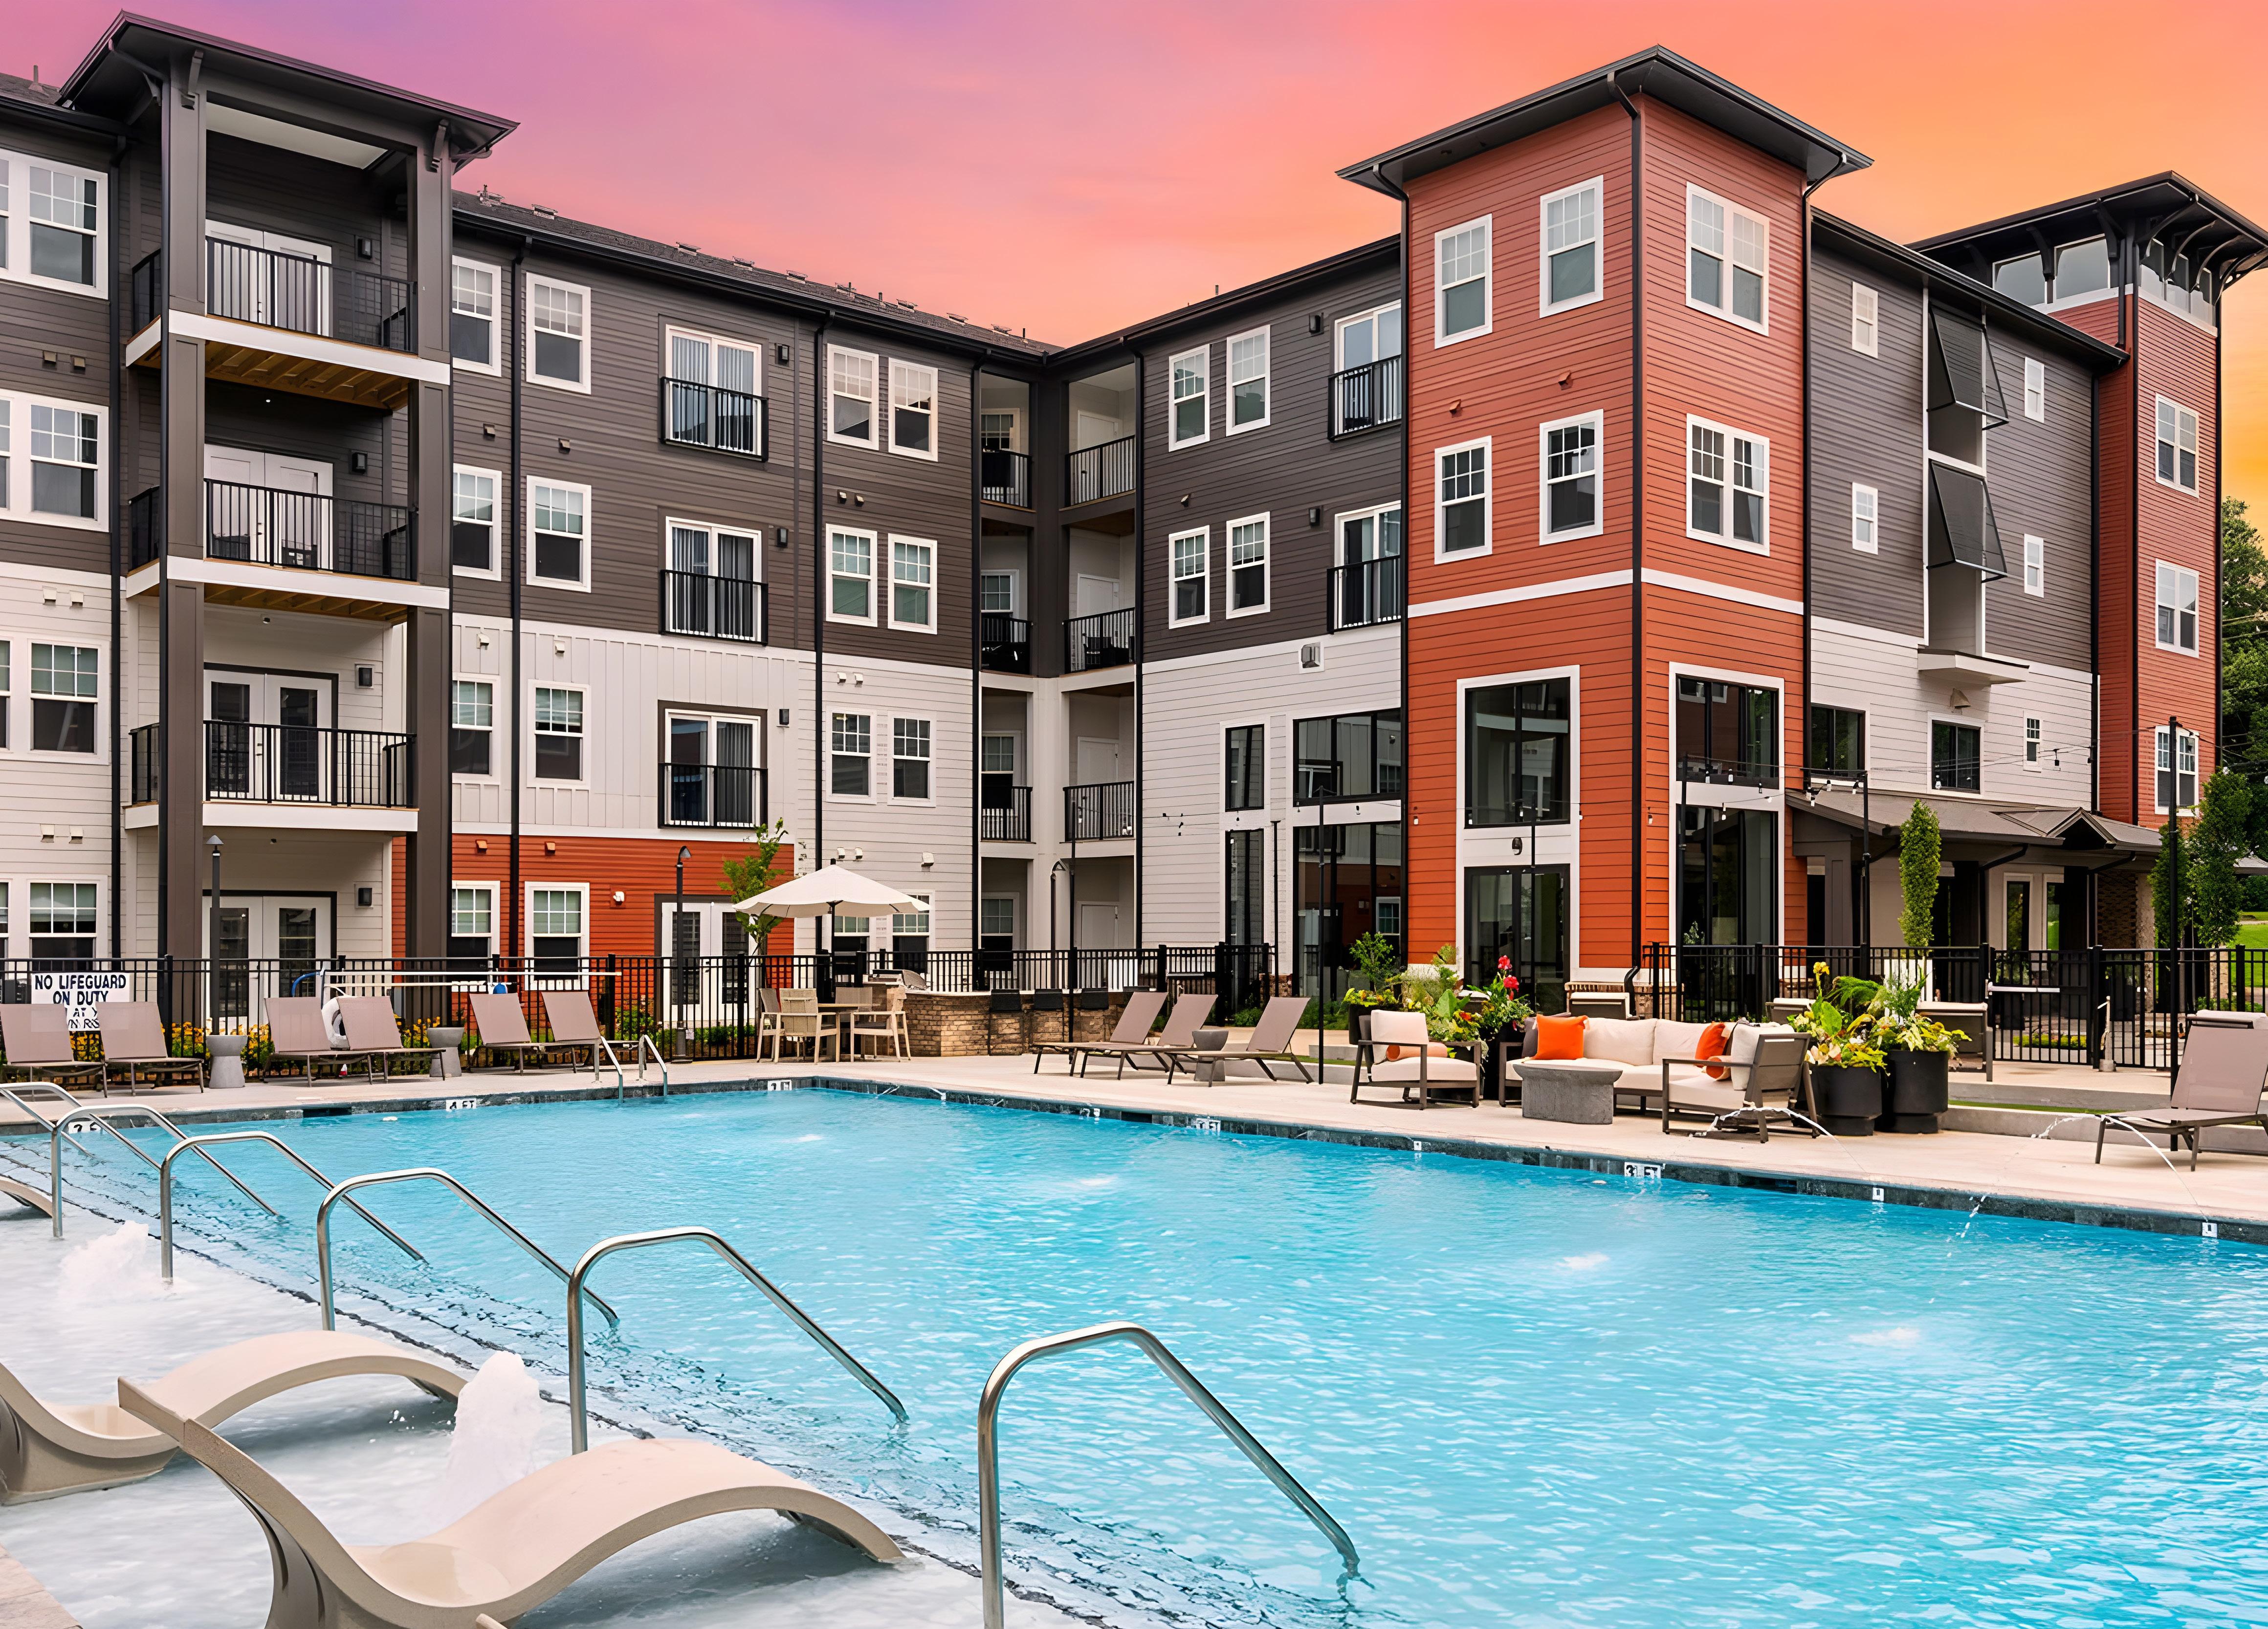
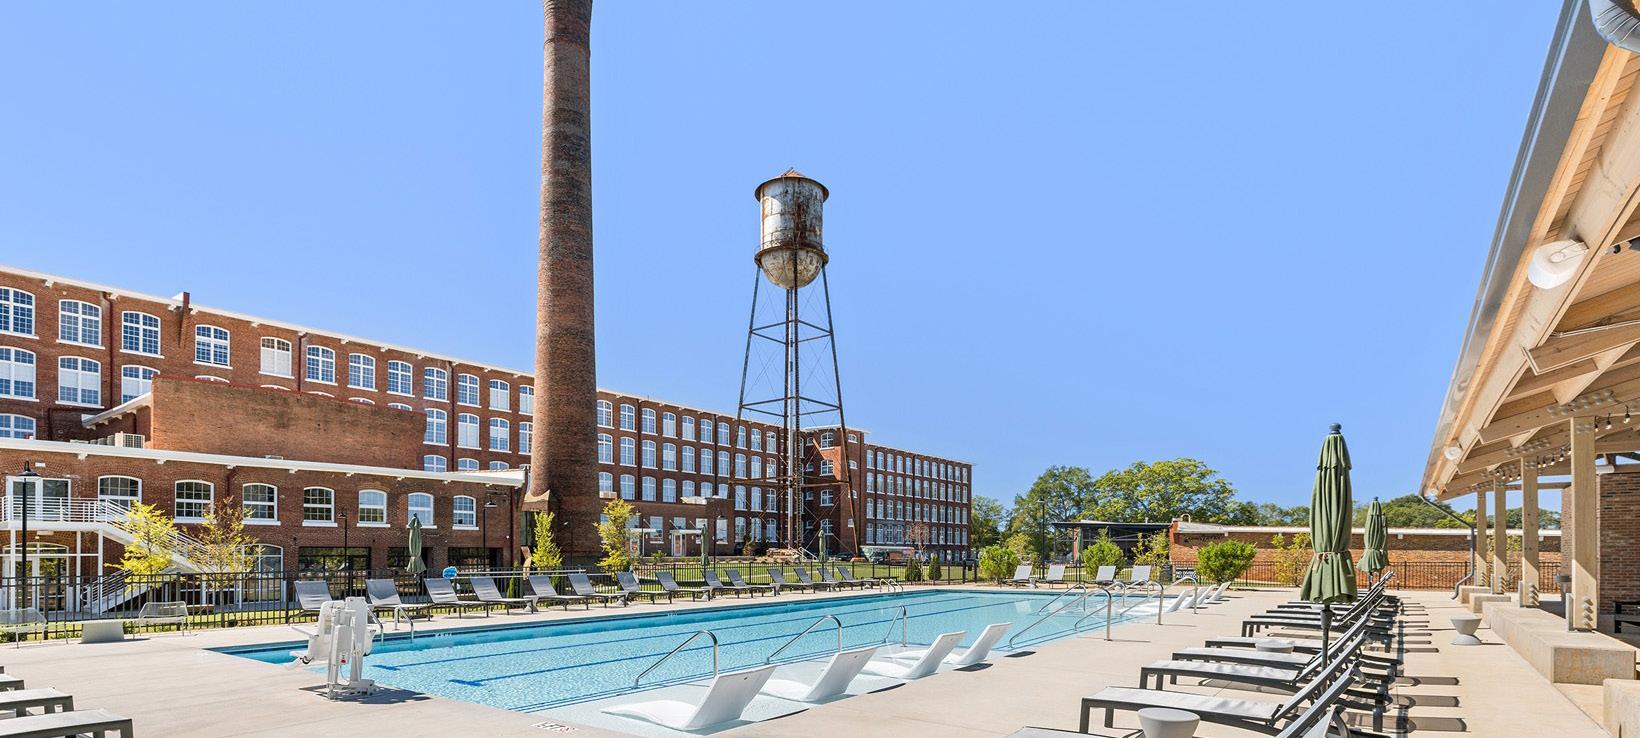
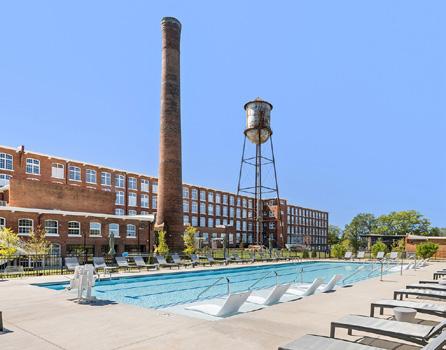
Located in the Heart of Downtown Greer on the Former Victor Mill Site
Professionally Landscaped with Manicured Grass, Plants, Young Trees, Brick-Paved Courtyard, and Man-Made Lake
Near the 12-Acre Greer City Park Featuring an Amphitheater for Public Concerts and Ceremonies, Large Water Fountain, Pond, Playground, Green Space, and Walking Track
Convenient Access to Interstate 85, State Route 80, U.S. Highway 29, Public Transportation (Greenlink Bus Line), and GSP International Airport
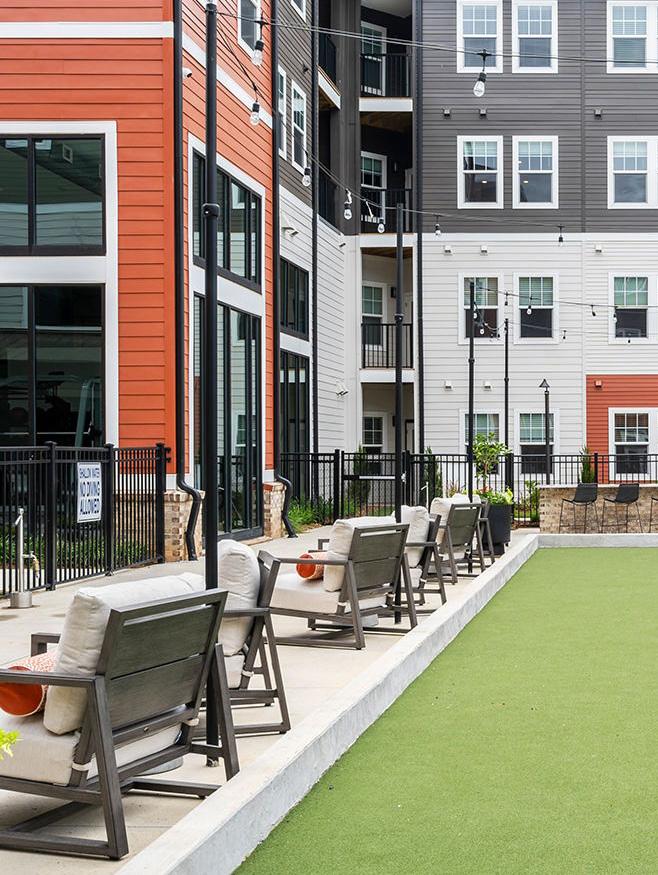
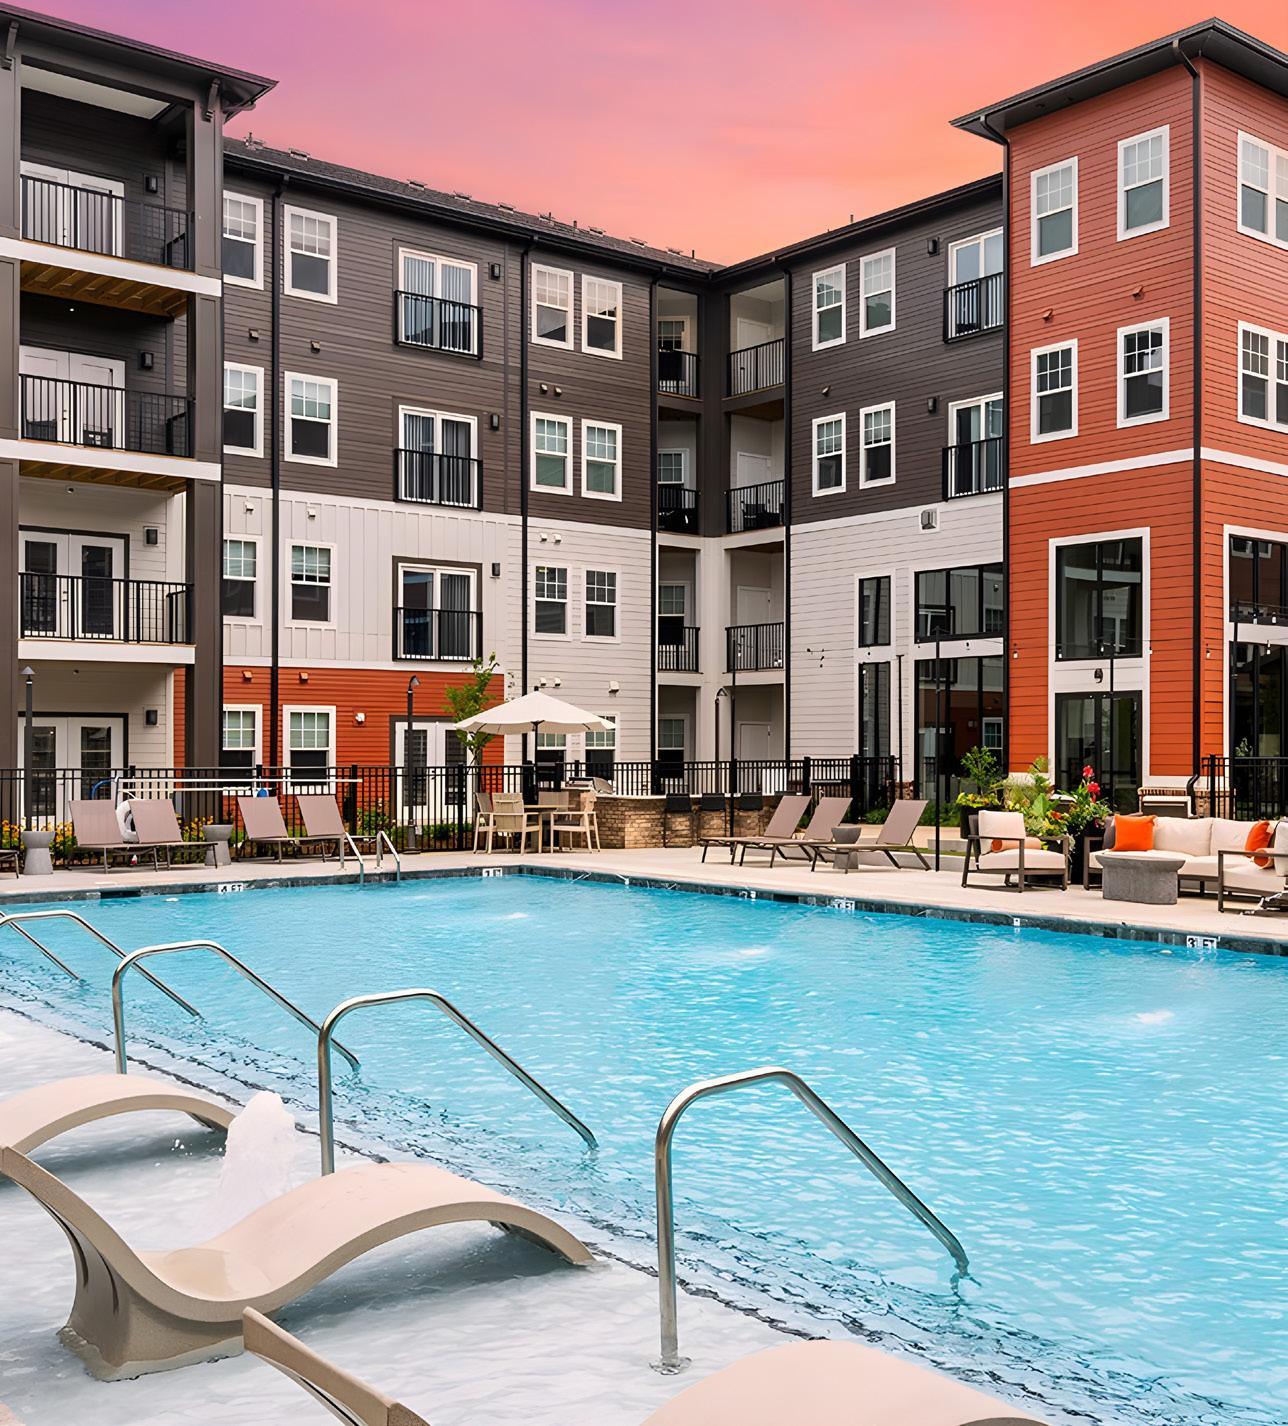
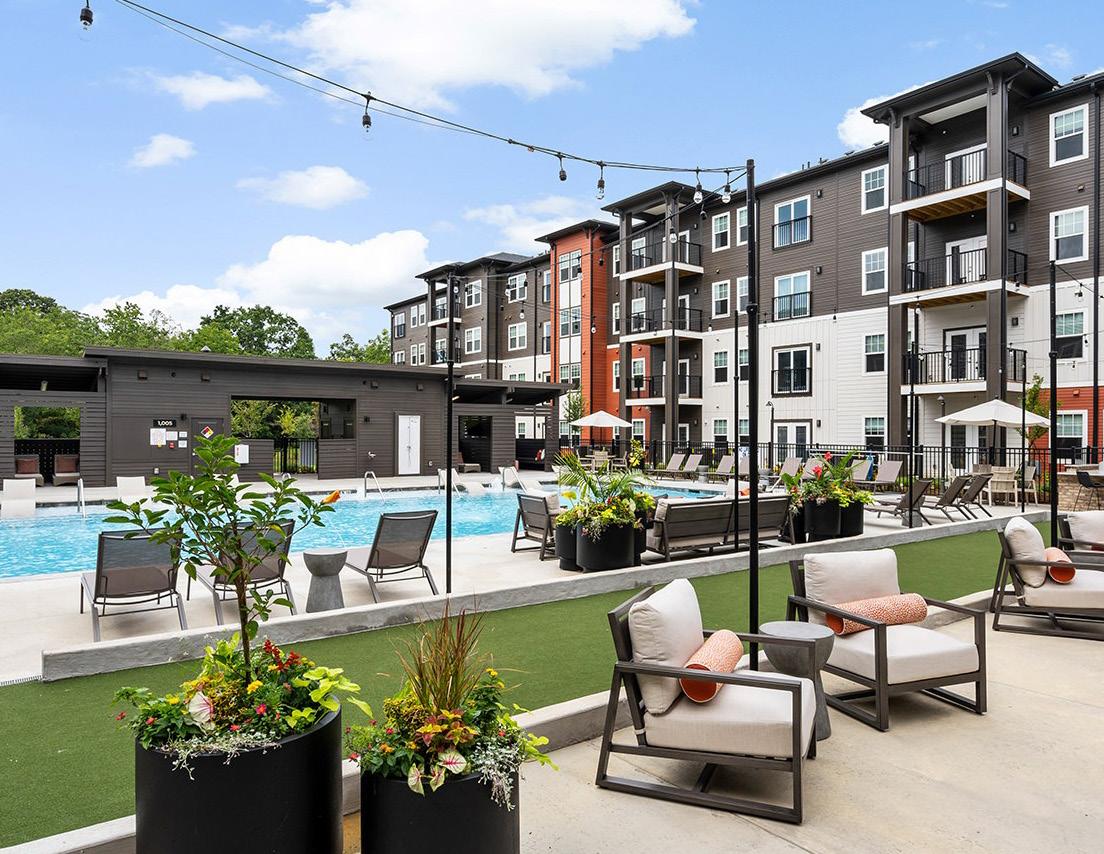
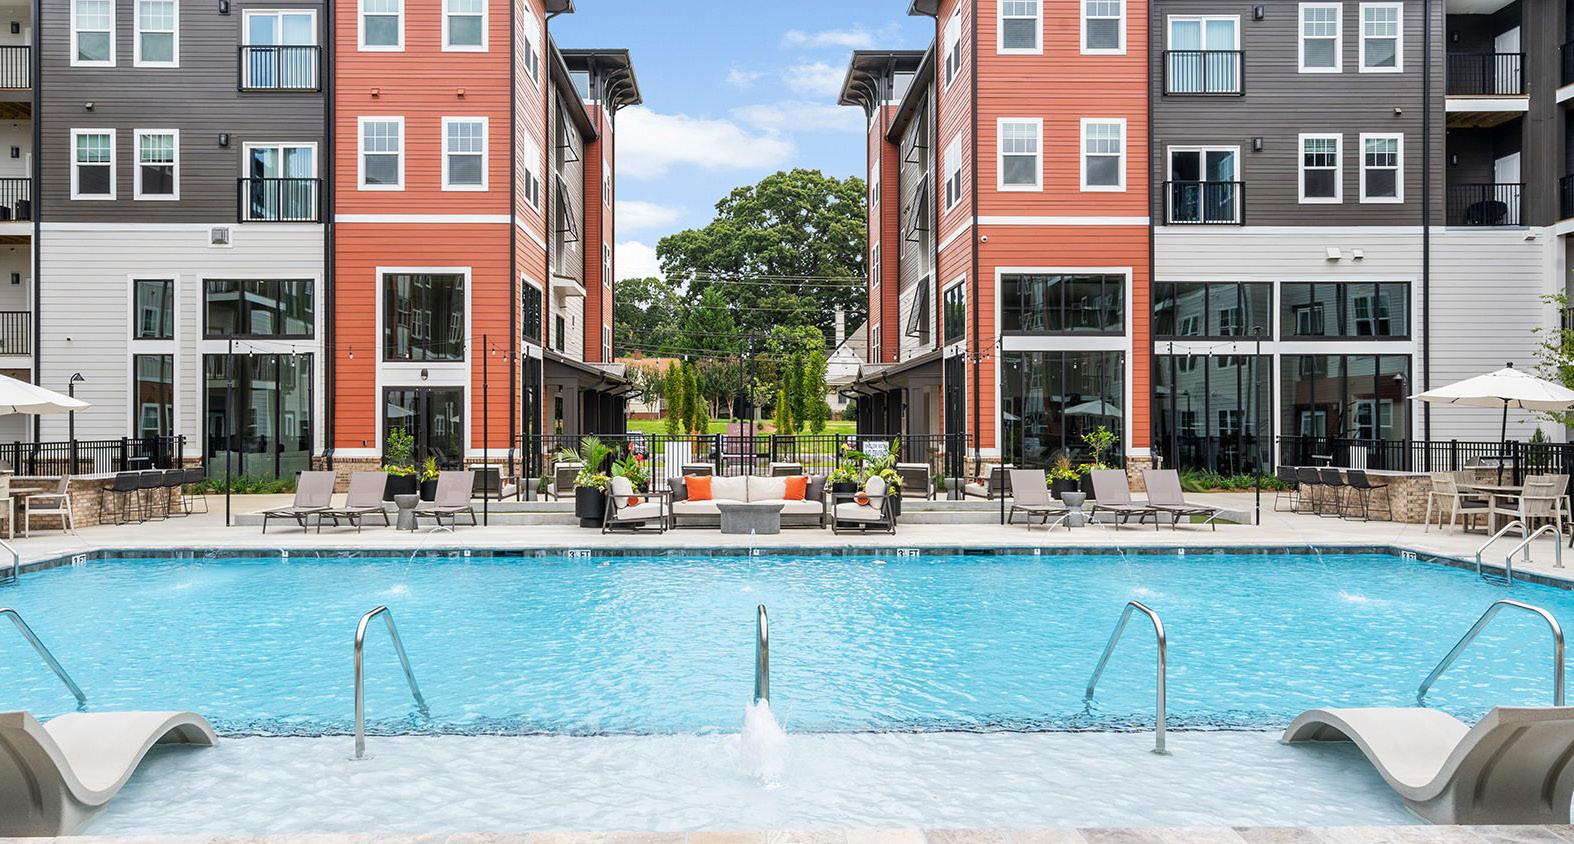
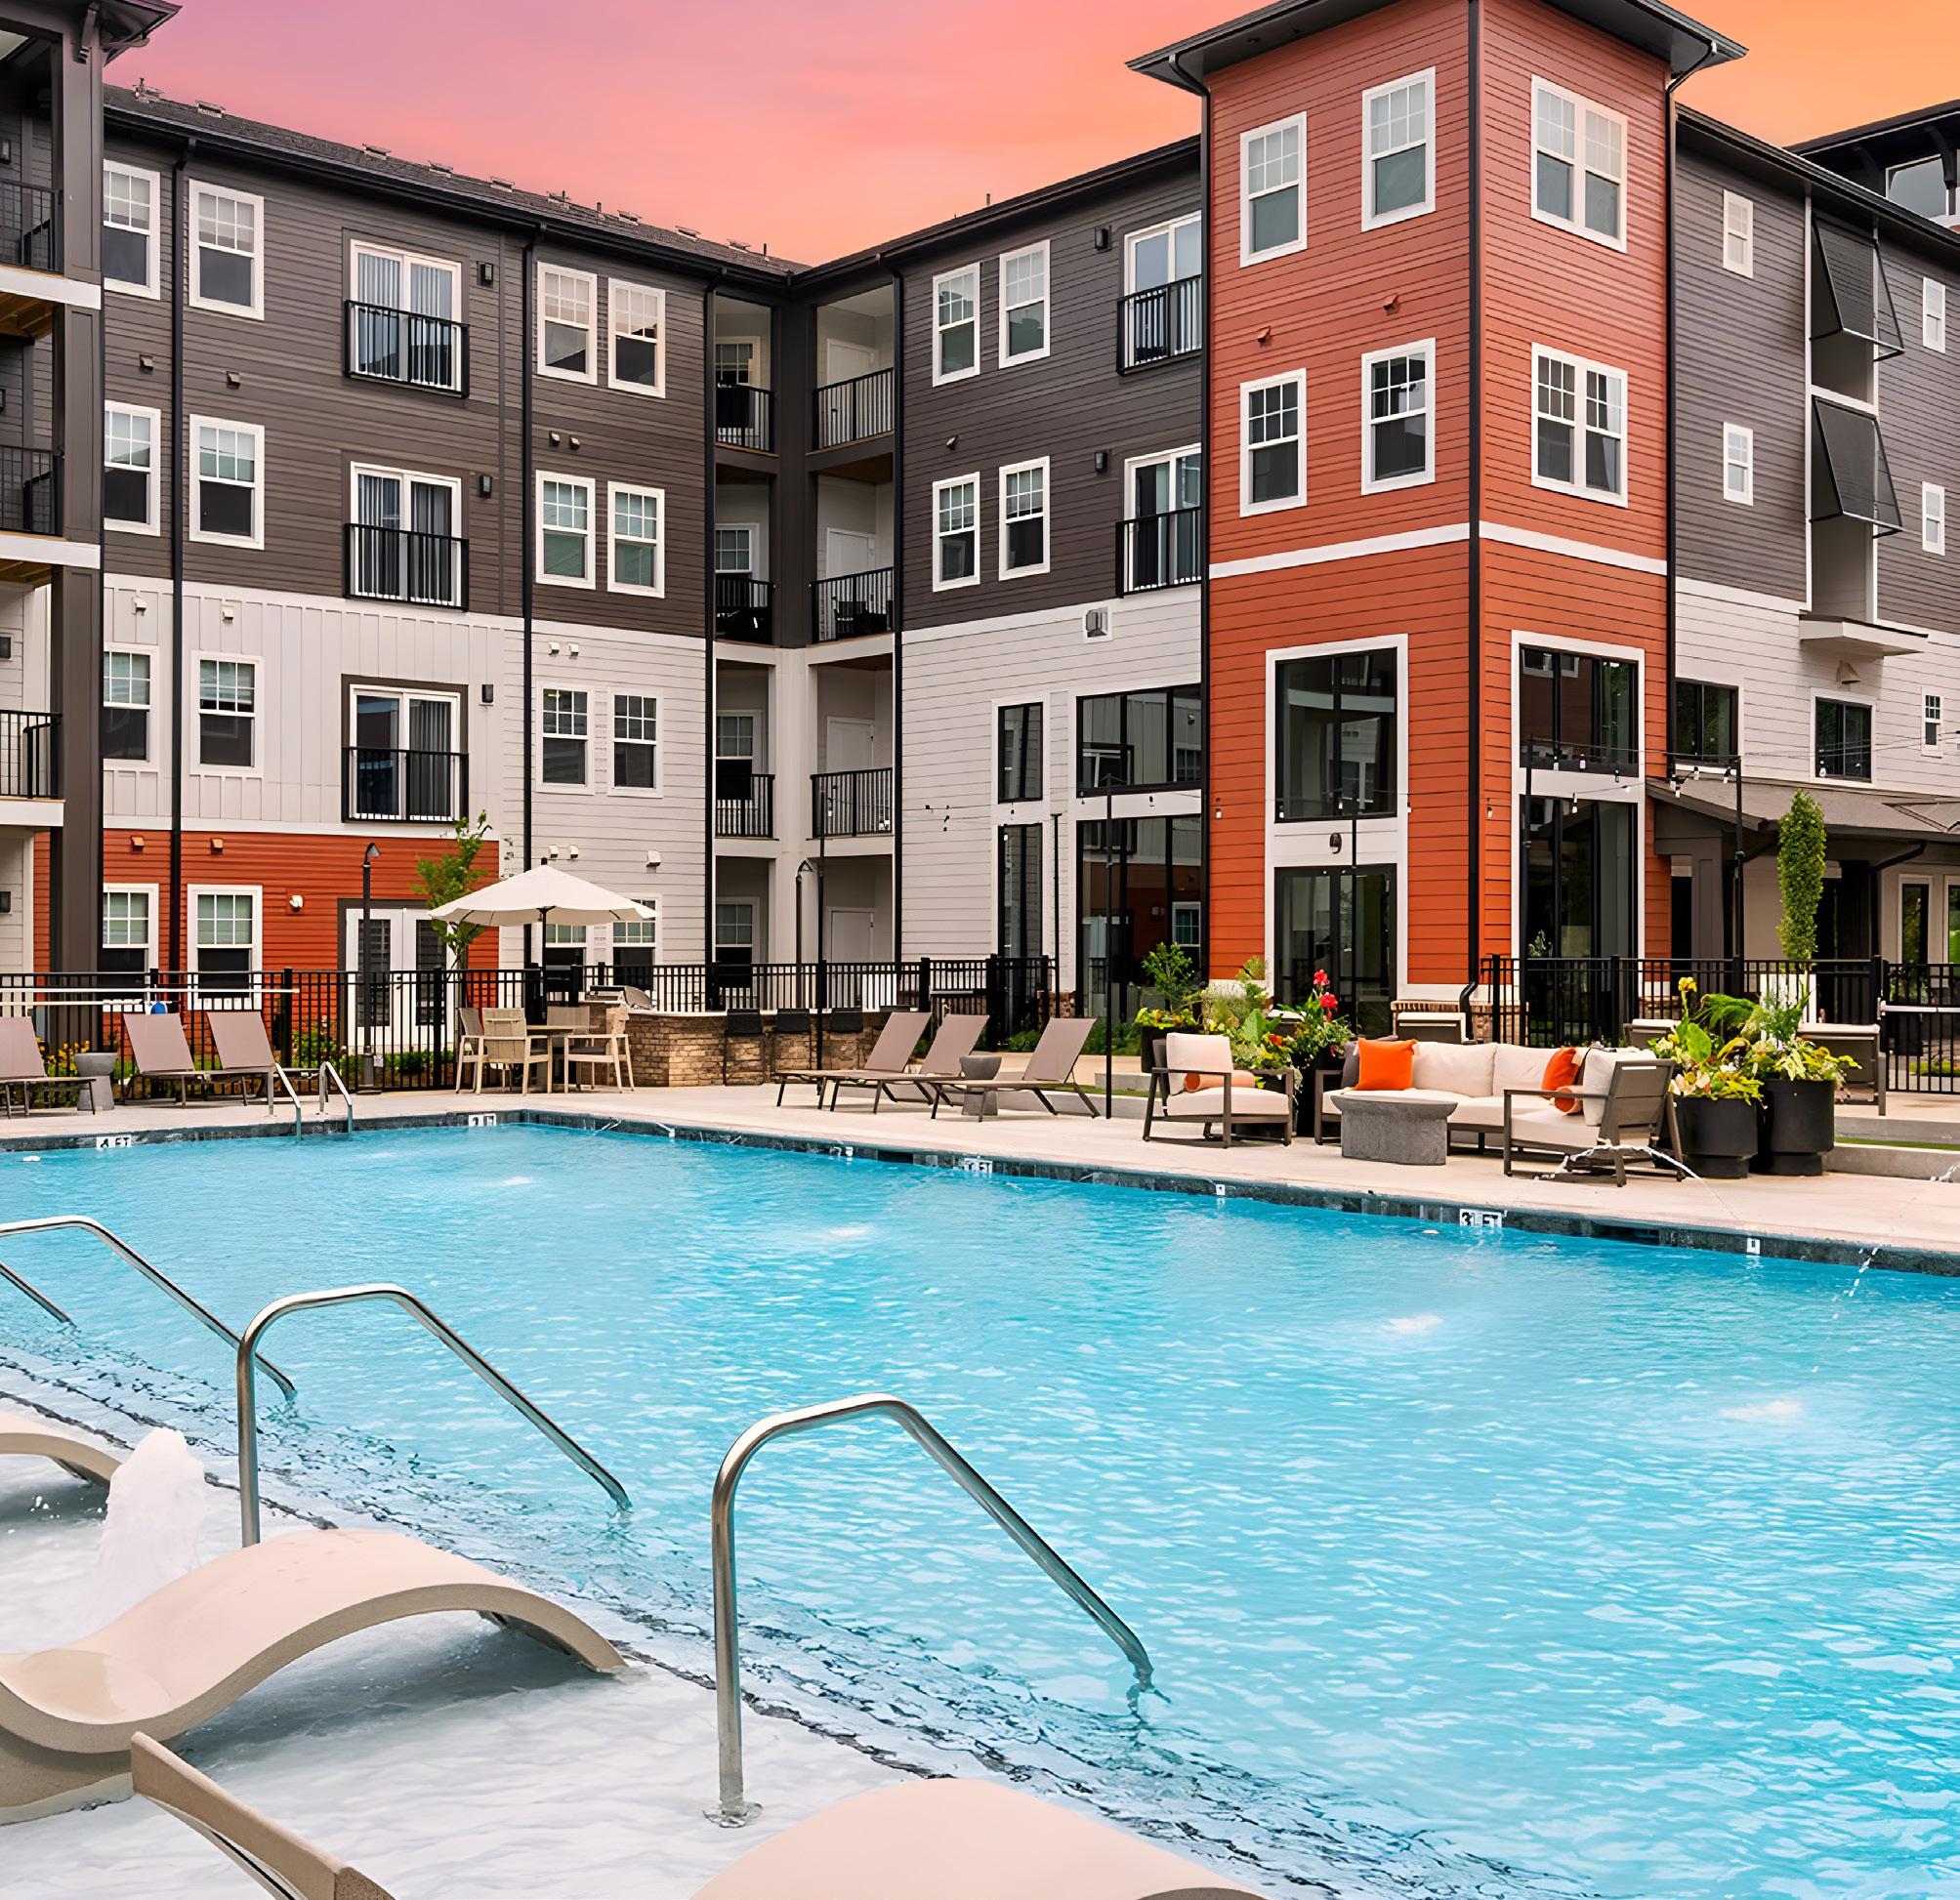
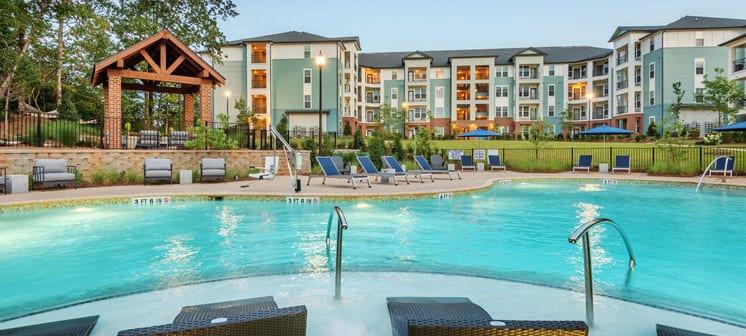
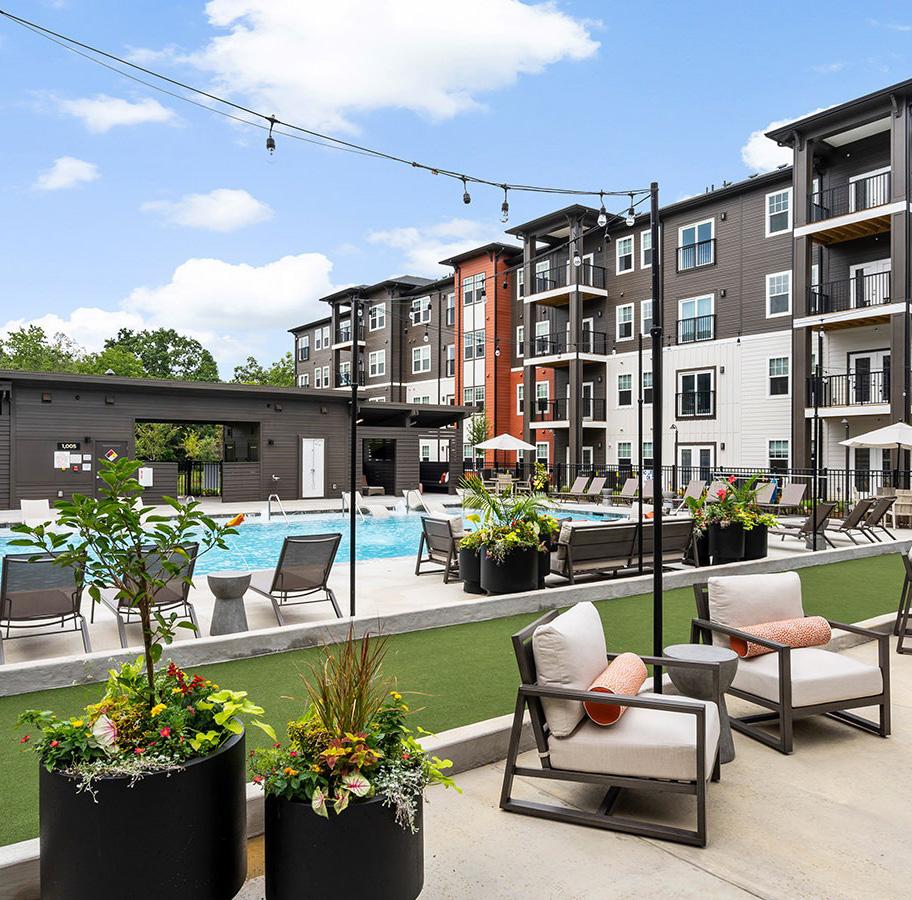
Resort-Style, Saltwater Swimming Pool with In-Pool Loungers, Large Sundeck, Cabanas, Fire Pit, Poolside Grilling Area, and Bocce Court
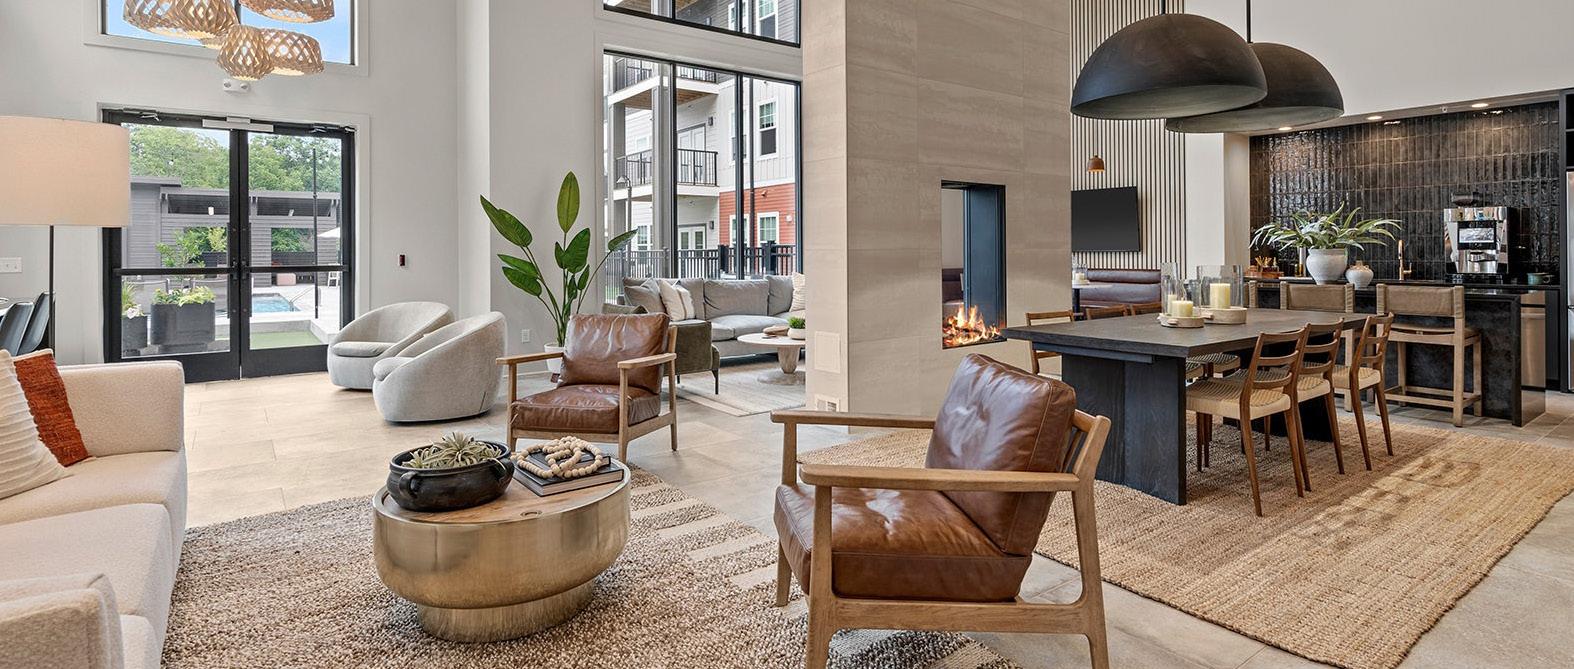
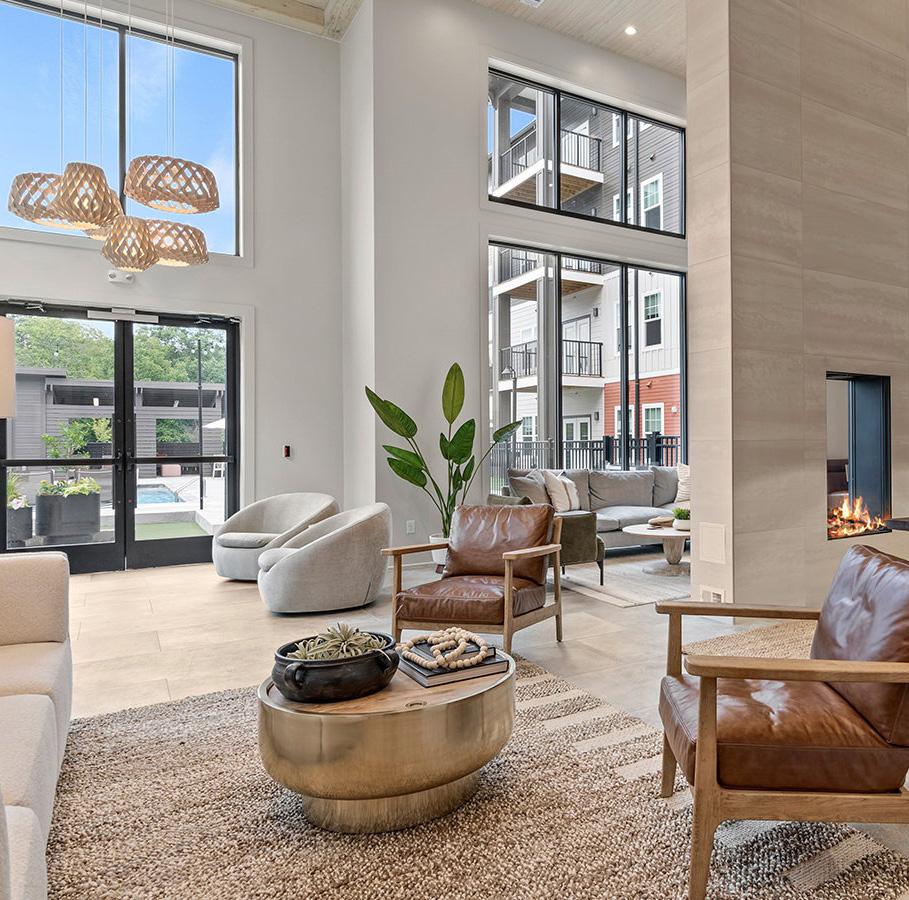
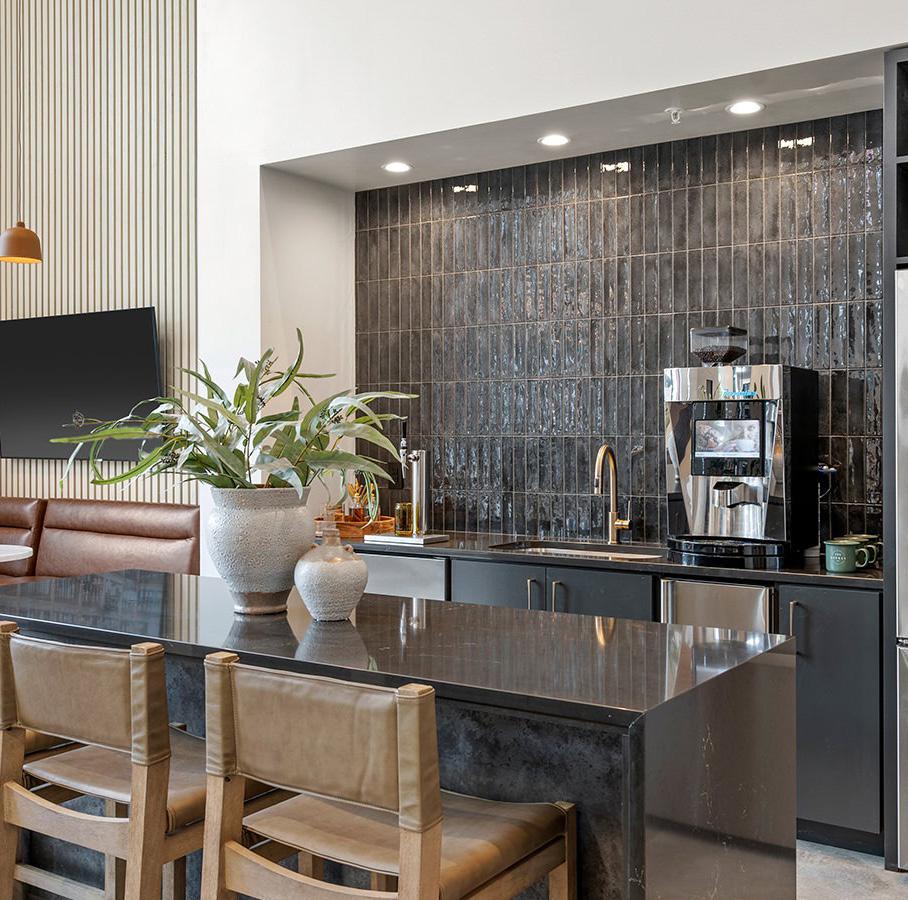
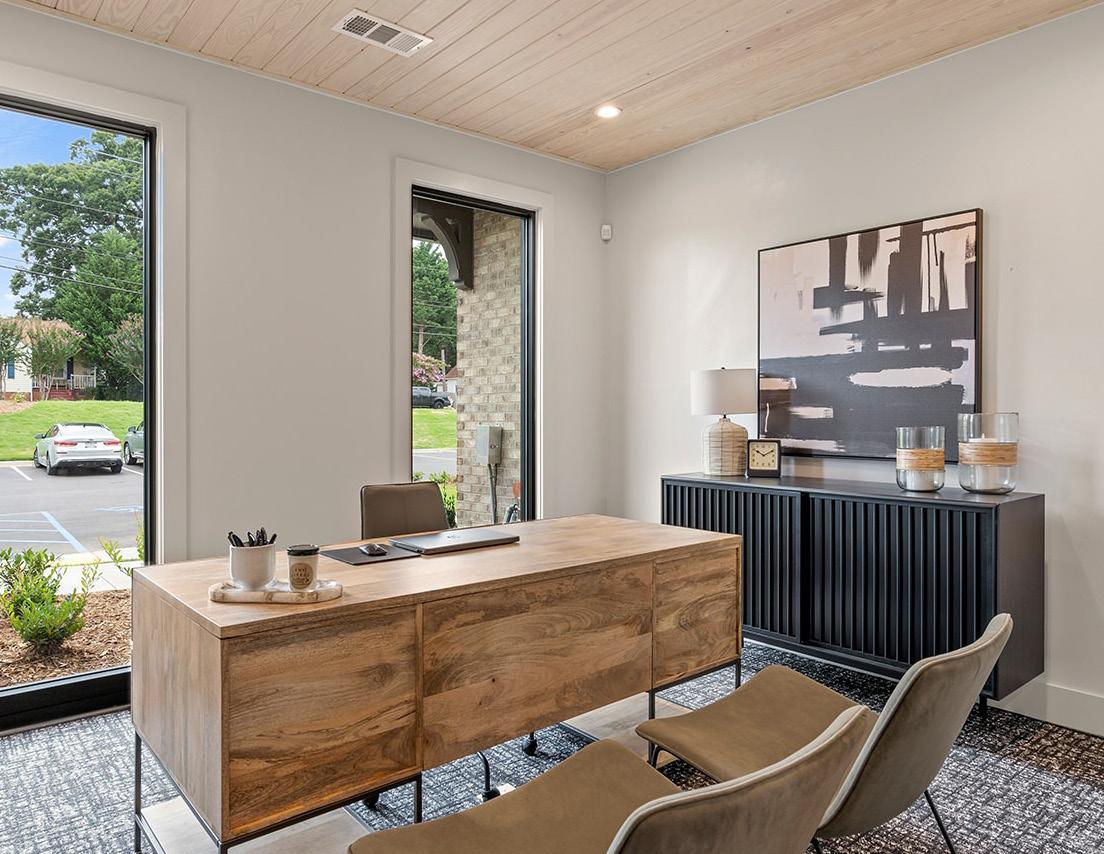
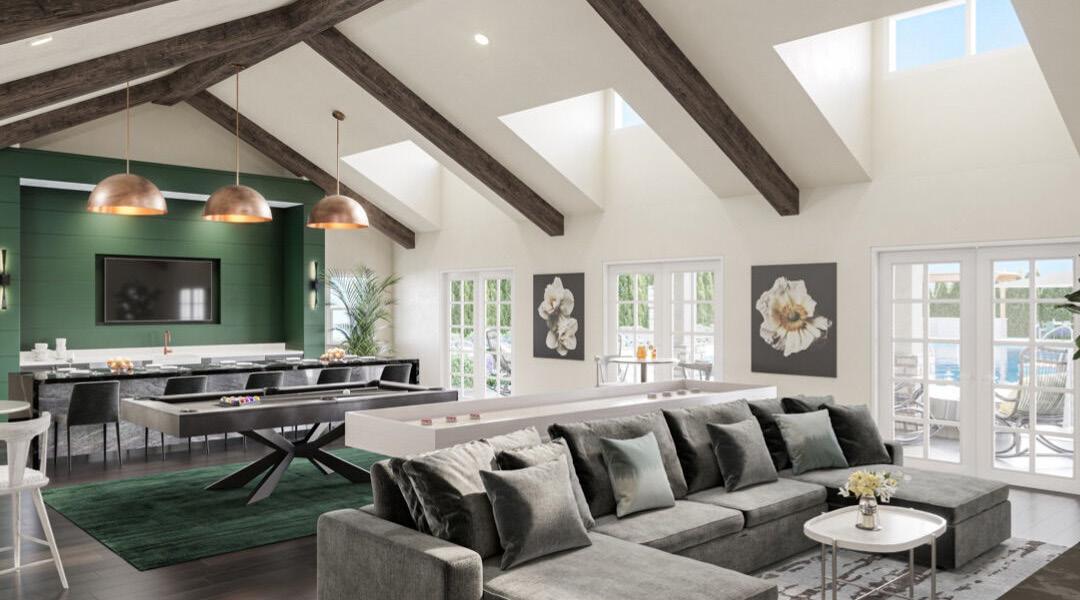
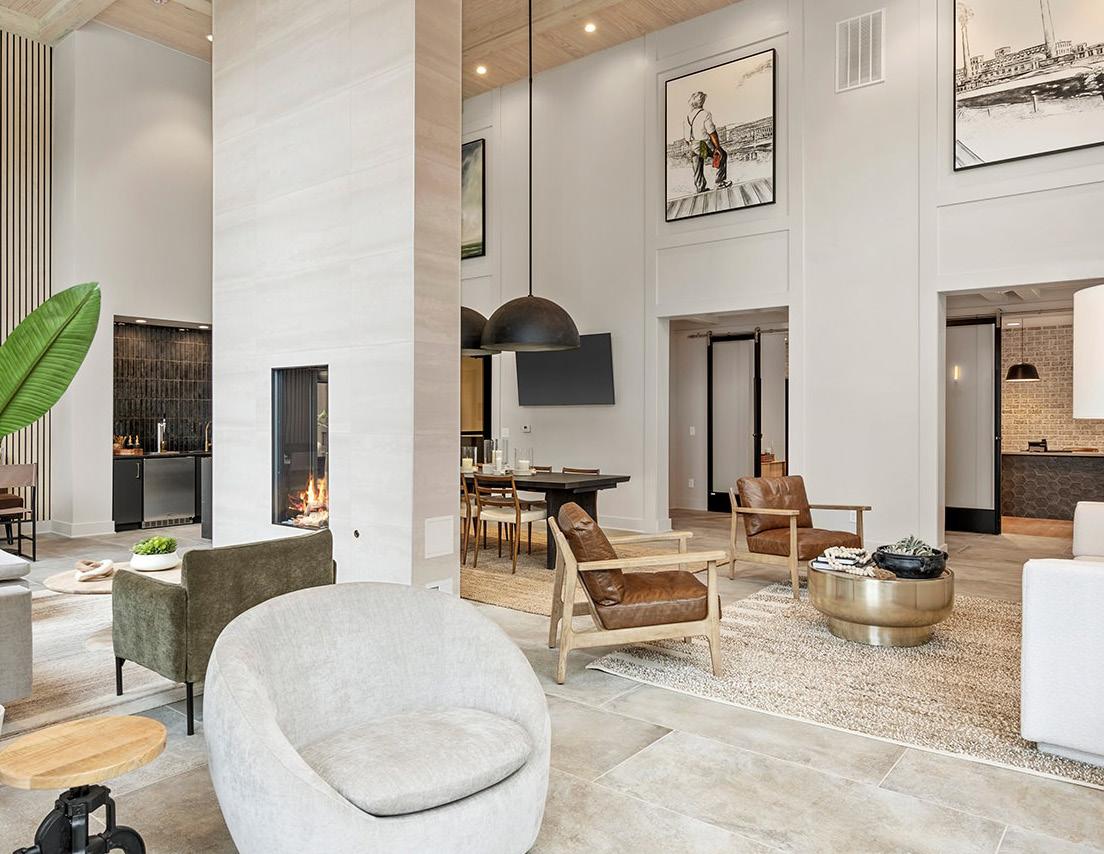
Clubhouse with Entertainment Space, TV Lounge, Two-Sided Fireplace, Flexible Work and Lounge Space with Cold Brew Tap, and Kitchen
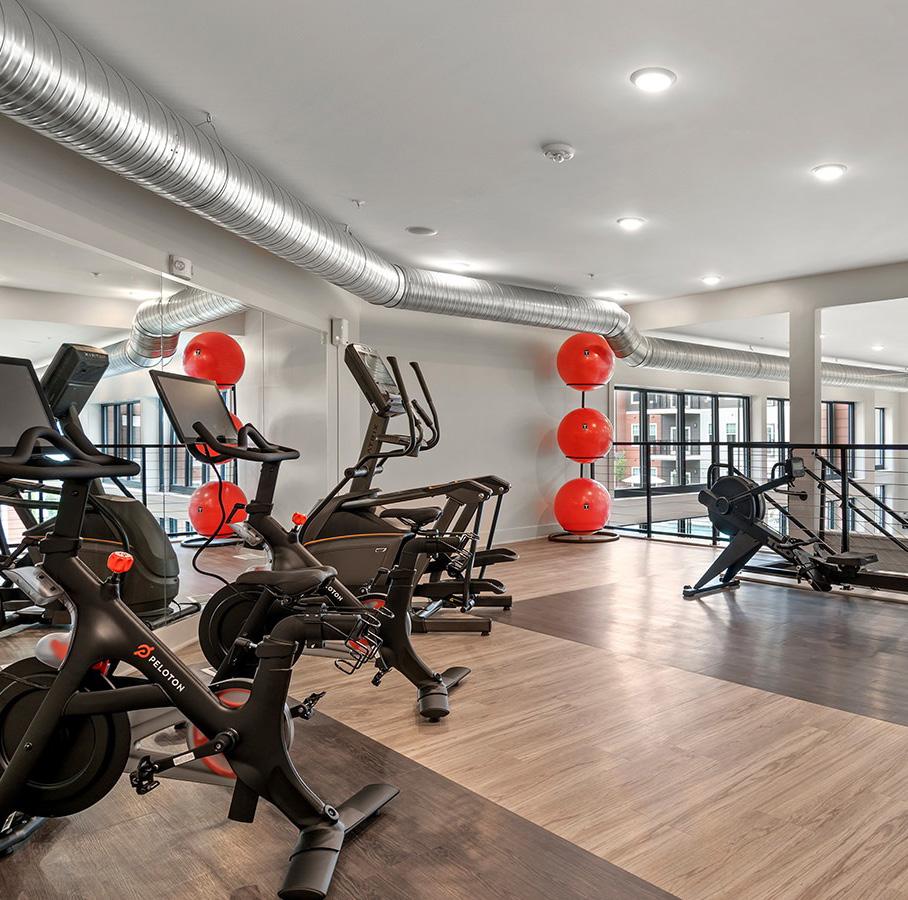
24 / 7, Two-Story Fitness Center with Cardio and Weightlifting Equipment, Free Weights, and Rock-Climbing Wall
Sky Lounge
Dog Park with Pet Spa
Lobby with Lounge Area, Leasing Office, and Elevators
Valet Trash Service and Recycling Center
Online Resident Portal
Plenty of Convenient, On-Site Parking and Car Care Center with Complimentary Vacuum
Close to Parks, Lakes, Schools, Stores, Restaurants, and Entertainment Options
UNIT AMENITIES
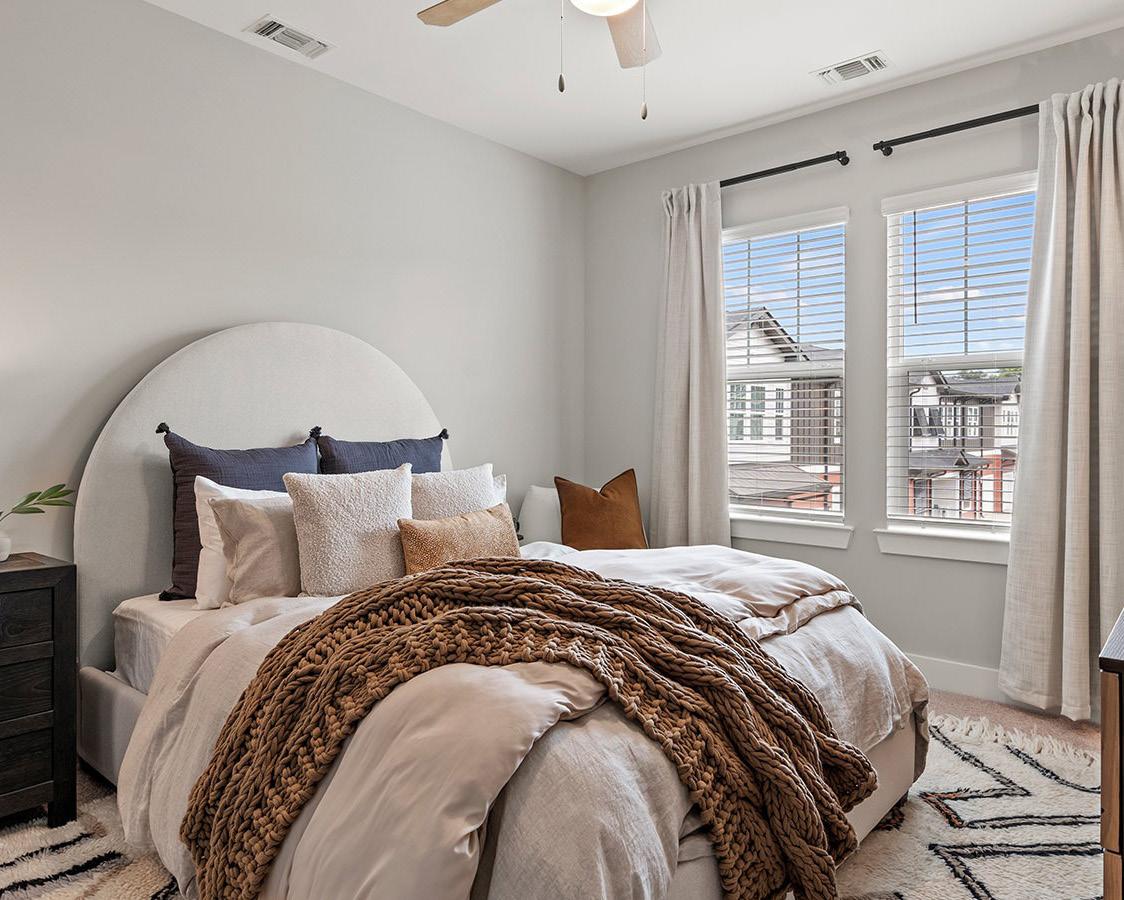
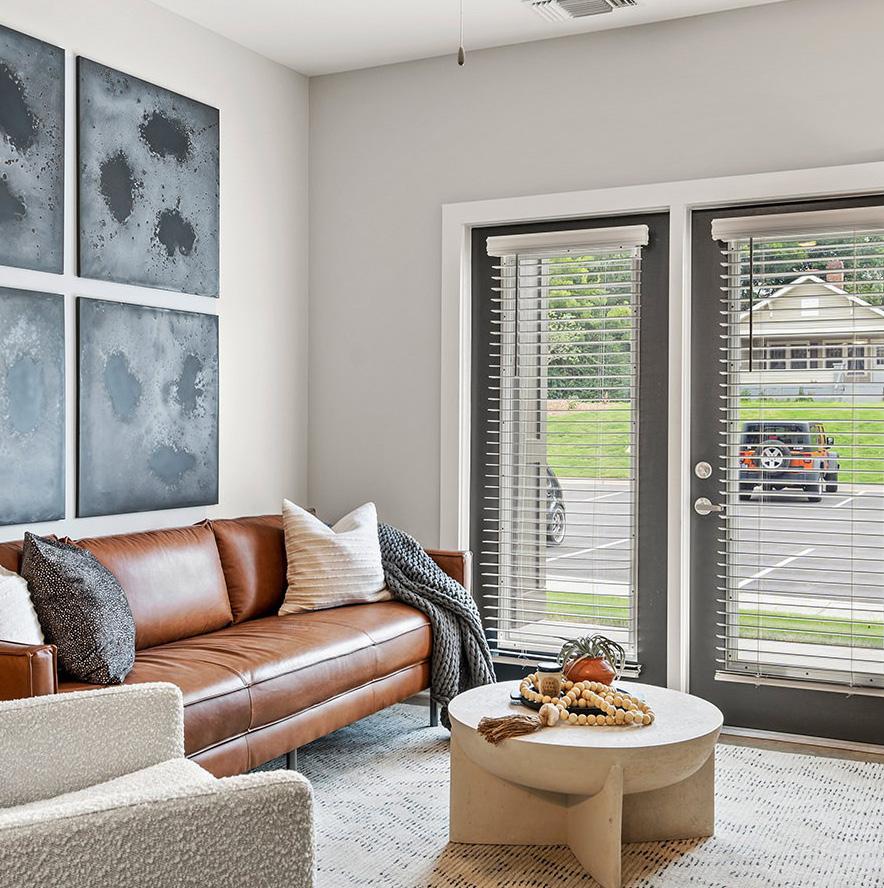
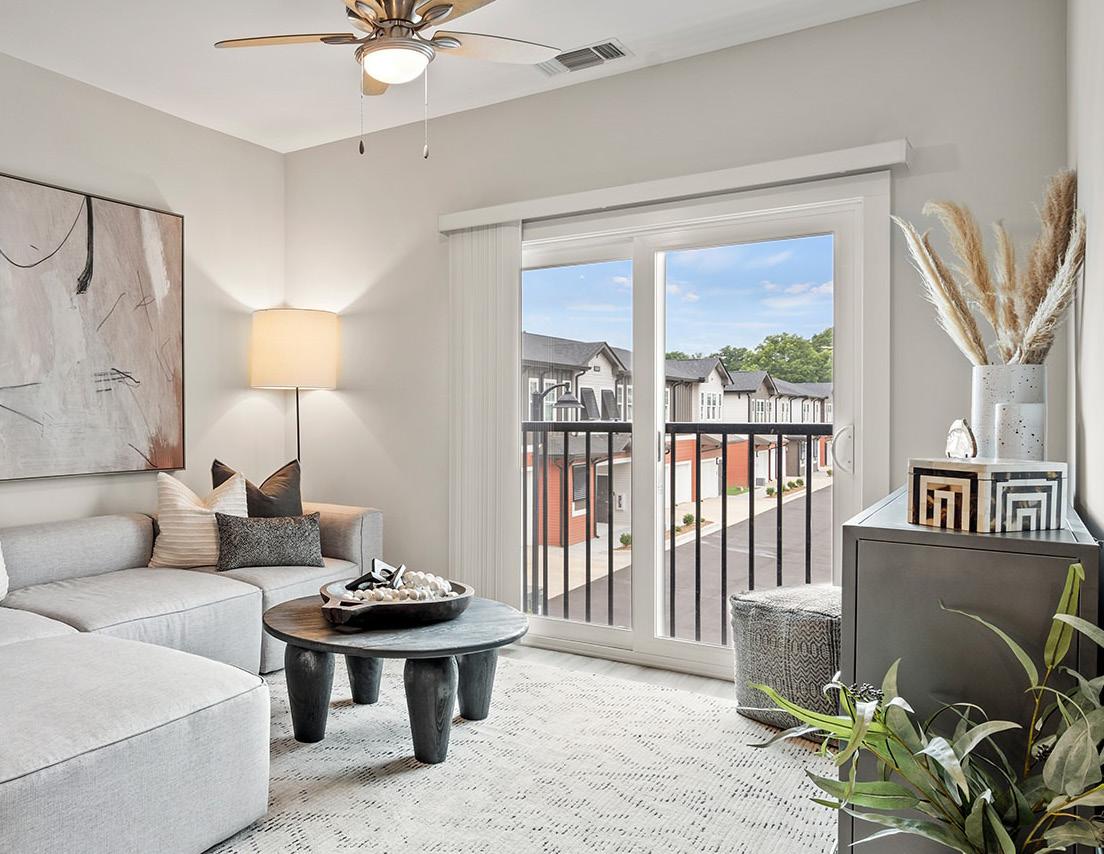
Open and Airy Floor Plans with Rustic, Artisan-Style Design
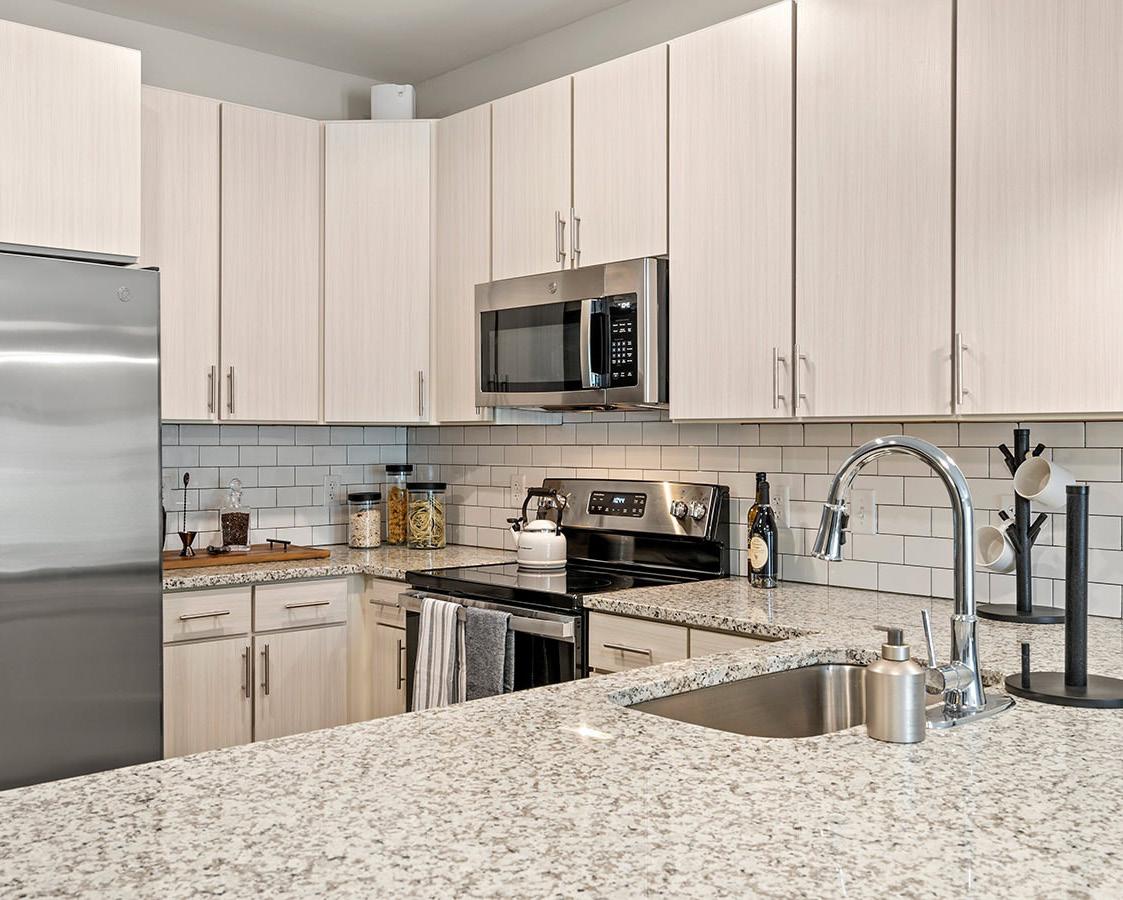
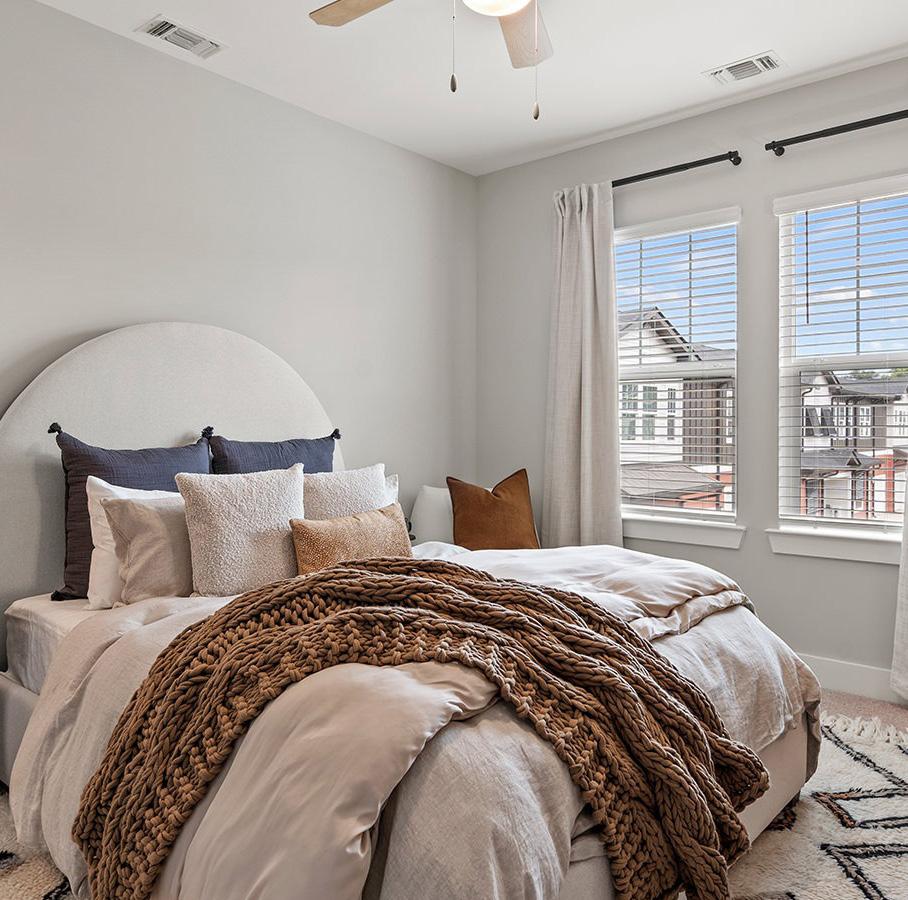
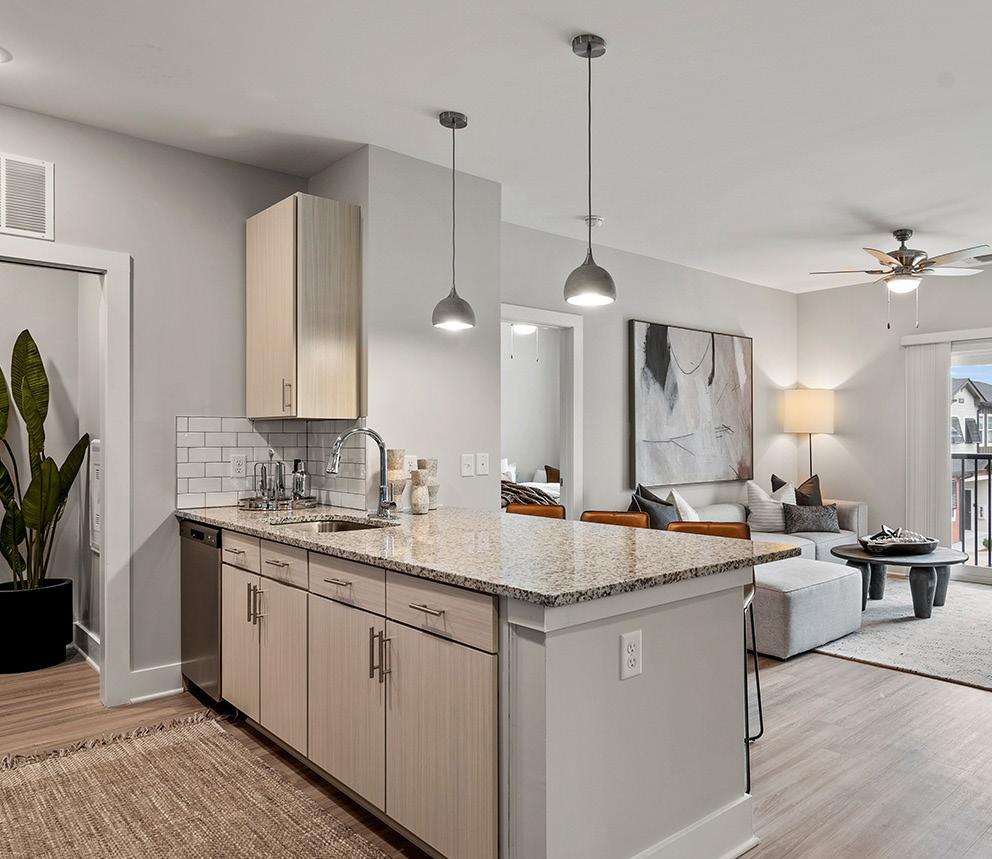
Beautifully Appointed with High-End Finishes Including Stainless Steel Appliances, Granite Countertops, Wood-Style Flooring, Custom Light Wood Cabinetry, Signature Hardware, Tiled Kitchen Backsplash, Undermount Sink with Gooseneck Faucet, and Upgraded Lighting
Modern Kitchen with Electric Stove with Glass-Top Range, Refrigerator, Built-In Microwave, Dishwasher, Kitchen Island / Breakfast Bar, and Plenty of Cabinet and Counter Space Full Size Bathroom with Tub and Shower Combination / Walk-In Shower
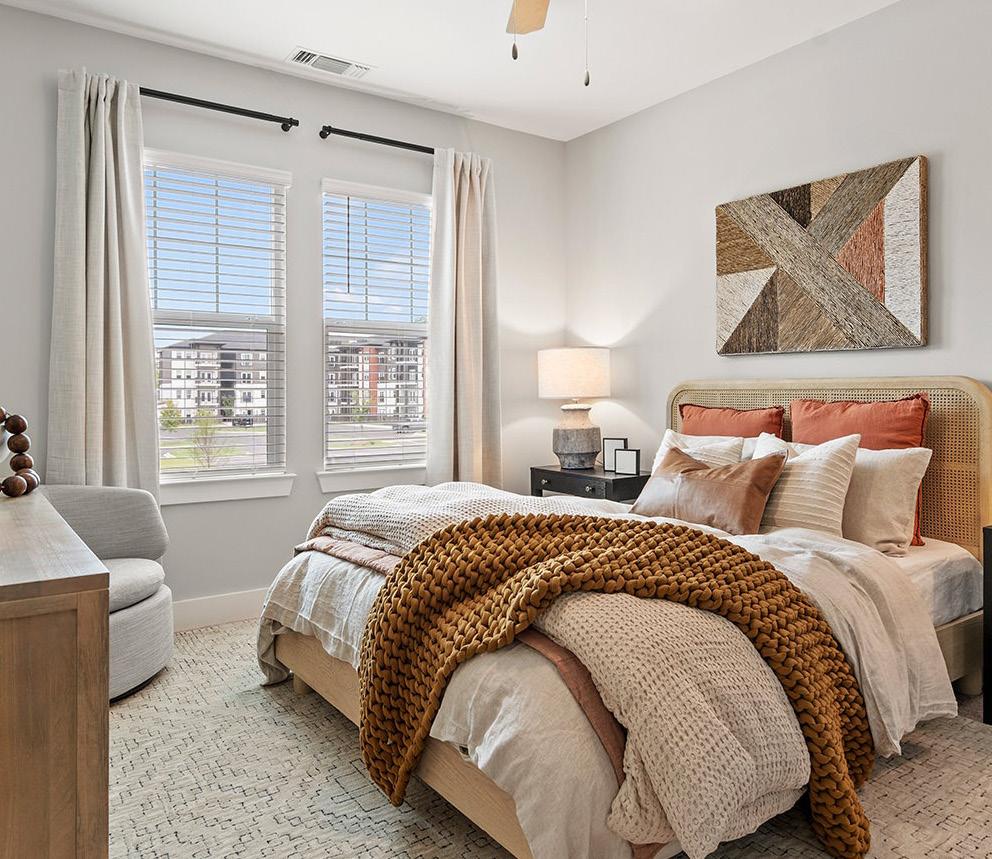
Lighted Ceiling Fans, Nine Foot Ceilings, Plush Bedroom Carpeting, and Mini Blinds Generous Closet Space
Large Windows Allowing in Abundant Natural Light In-Unit Washer and Dryer Select Units Feature Concrete Floors, Private Patio / Balcony / Juliette Balcony with Glass Panel / Sliding Glass Doors, and Enclosed Garage with Direct Access
THE LIVELY The Pro P er T y 11 1 2 3 4 5 28 29 30 31 32 43 33 34 38 39 40 41 35 36 37 45 42 6 7 8 12 24 13 14 25 9 27 10 11 26 S 15 16 17 18 19 20 21 22 23 44 46 48 49 50 51 52 47 POINTS
OF INTEREST
S THE LIVELY VICTOR PARK 1 Prisma Health Greer Memorial Hospital 2 Walmart Supercenter 3 Walmart Neighborhood Market 4 Planet Fitness 5 Belk 6 Anytime Fitness - Greer, SC 7 ALDI 8 Gold's Gym Greer 9 Firehouse Subs Greer 10 Walgreens 11 Panera Bread 12 Chili's Grill & Bar 13 Kohl's 14 Ross Dress for Less 15 Five Below 16 Lowe's Home Improvement 17 Dairy Queen Grill & Chill 18 Starbucks 19 The Home Depot 20 GNC 21 Chick-fil-A 22 Cook Out 23 Food Lion 24 Papa Johns Pizza 25 Staples 26 Panera Bread 27 Dunkin' 28 Applebee's Grill + Bar 29 Domino's Pizza 30 Little Caesars Pizza 31 Subway 32 Walgreens 33 Big Lots 34 Dollar Tree 35 Dick Brooks Honda 36 Nissan of Greer 37 Kia of Greer 38 Chevrolet 39 Toyota of Greer 40 Greer Mitsubishi and the Truck Farm of Greer 41 Hyundai of Greer 42 Enterprise Rent-A-Car 43 Family Dollar 44 Greer City Park 45 Cannon's Drive-In & Catering 46 Wild Ace Pizza & Pub 47 Harvest Kitchen 48 The Great Bay Oyster House 49 Barista Alley Speciality Coffee and Smoothie Bar 50 SELECT Restaurant - Greer 51 The Mason Jar 52 Cartwright Food Hall POINTS OF INTEREST


THE LIVELY The Pro P er T y 13 THE LIVELY VICTOR PARK NEIGHBORHOOD QUICK FACTS GREER, SC FROM THE PROPERTY 3.2mi JOBS SUPPORTED 1.0k SF FACILITY 600k DEMAND DRIVER Plastic Omnium NEIGHBORHOOD SHOPPING Dillard’s | Belk | Pottery Barn | Banana Republic | Apple FROM THE PROPERTY 10.2mi STORES AND RESTAURANTS 1.2m SF SHOPPING DESTINATION 130 TOTAL JOBS SUPPORTED SF FACILITY 11.0k 7.0m FROM THE PROPERTY 3.6mi NEIGHBORHOOD CONVENIENCES Within a four-mile drive of the property DEMAND DRIVER BMW Manufacturing Corporation FROM THE PROPERTY 2.8mi JOBS SUPPORTED 570 HOSPITAL BEDS 82 PRIMARY EDUCATION Crestview ES | Greer MS | Greer HS STUDENTS SERVED 77.5k SCHOOLS AND CENTERS 99 JOBS SUPPORTED 9.8k DEMAND DRIVER Prisma Health Greer Memorial Hospital 34.7k Population (Within Three Miles) 33% Renter Occupied Housing Units (Within Three Miles) $210.6k Median Housing Unit Value (Within Three Miles) $56.0k Median Household Income (Within Three Miles) 2.5%* City Unemployment Rate (*Preliminary for August 2022) NEIGHBORHOOD DESCRIPTION
MARKET POSITIONING
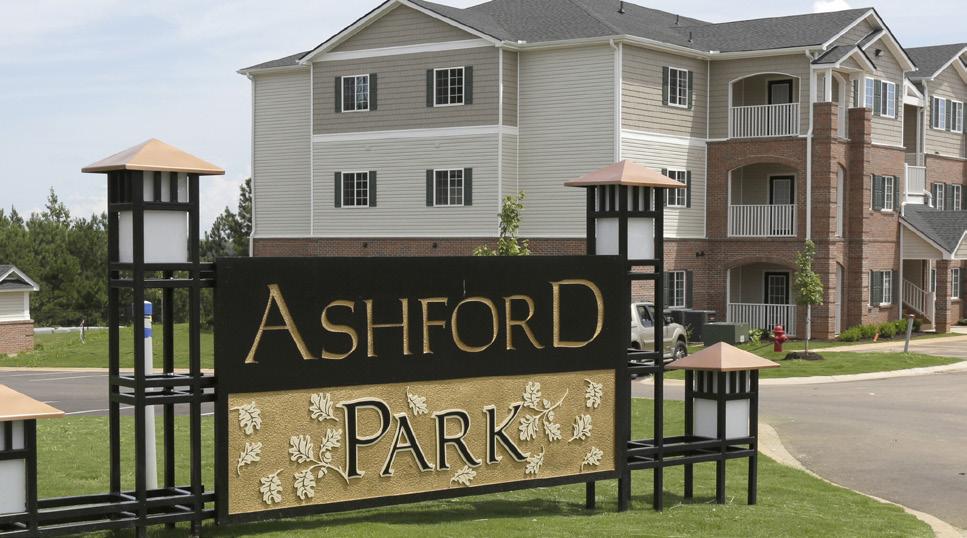
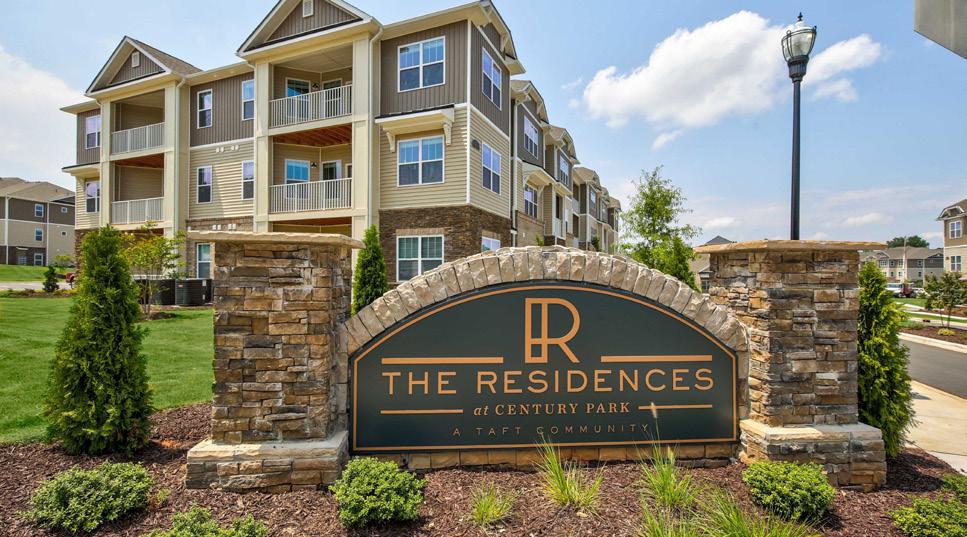
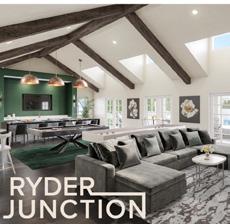
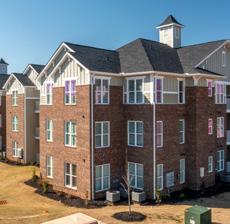
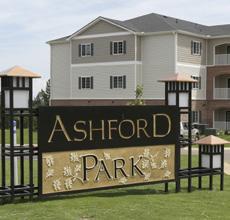
THE LIVELY Marke T Posi T ioning 15 COMPARABLE RENTALS PROPERTY CITY DISTANCE UNITS BUILT OCCUPANCY AVG SF MARKET AVG RENT AVG RENT / SF S Lively at Victor Park Greer 318 2022 25% 833 $1,506 $1.81 1 Ashford Park Duncan 6.81 Miles 242 2016 100% 1,116 $1,123 $1.01 2 Ryder Junction Greer 0.89 Miles 264 2022 0% 931 $1,359 $1.46 3 The Residences at Century Park Greer 1.35 Miles 298 2018 96% 1,091 $1,466 $1.34 4 The Groves at Berry Creek Duncan 8.52 Miles 266 2019 87% 1,070 $2,987 $2.79 5 Palisades at Duncan Duncan 5.87 Miles 246 2019 94% 1,059 $1,592 $1.50 AVERAGES* 1,316 1,053 $1,712 $1.62 1. ASHFORD PARK 4. THE GROVES AT BERRY CREEK 3. THE RESIDENCES AT CENTURY PARK 2. RYDER JUNCTION 5. PALISADES AT DUNCAN S. THE LIVELY AT VICTOR PARK *Averages do not include Subject Property
THE RESIDENCES AT CENTURY PARK
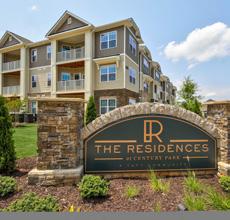
298 UNITS
Built : 2018 Distance : 1.35 Occupancy : 96% RSF : 325,004 Avg SF : 1,091 Avg Rent : $1,466 Avg Rent/SF : $1.34
LIVELY AT VICTOR PARK
318 UNITS
Built : 2022 Distance : Occupancy : 25% RSF : 264,896
Avg SF : 833 Avg Rent : $1,506 Avg Rent/SF : $1.81

PALISADES AT DUNCAN
246 UNITS
Built : 2019
Distance : 5.87 Occupancy : 94% RSF : 260,430
Avg SF : 1,059
Avg Rent : $1,592 Avg Rent/SF : $1.50
ASHFORD PARK
242 UNITS
Built : 2016 Distance : 6.81 Occupancy : 100%
RSF : 269,962
Avg SF : 1,116
Rent : $1,402
Rent/SF : $1.24
THE GROVES AT BERRY CREEK
266 UNITS
Built : 2019 Distance : 8.52 Occupancy : 87% RSF : 284,710 Avg SF : 1,070 Avg Rent : $2,987 Avg Rent/SF : $2.79
NORTH
Avg
Avg
RYDER JUNCTION 264 UNITS Built : 2016 Distance : 0.89 Occupancy : 0% RSF : 245,673 Avg SF : 931 Avg Rent : $1,359 Avg Rent/SF : $1.46
85 80 101
296 14 29
290
5 3 2 4
1
COMPARABLE RENTALS
THE LIVELY Marke T Posi T ioning 17 COMPARABLE RENTALS 250 Victor Avenue Greer, SC 29651 Units: 318 Built: 2022 Occupancy: 25% UNIT MIX UNITS TYPE UNIT SF MARKET RENT RENT / SF 6 Studio
8 Studio
4 Studio
40 1 Bedroom / 1 Bath
60 1 Bedroom / 1 Bath
8 1 Bedroom / 1 Bath
8 2 Bedrooms / 2 Baths
71 2 Bedrooms / 2 Baths
49 2 Bedrooms / 2 Baths
18 2 Bedrooms / 2 Baths
6 3 Bedrooms / 2 Baths
8 3 Bedrooms / 2 Baths
8 3 Bedrooms / 2
24 3 Bedrooms / 2
318 Weighted Average 833
6 STUDIO 6% 1 BED / 1 BA 34% 2 BED / 2 BA 46% 3 BED / 2 BA 14% THE LIVELY AT VICTOR PARK
478 $1,225 $2.56
646 $1,175 $1.82
670 $1,226 $1.83
579 $1,308 $2.26
580 $1,347 $2.32
697 $1,395 $2.00
865 $1,574 $1.82
933 $1,545 $1.66
933 $1,589 $1.70
958 $1,554 $1.62
1,048 $1,725 $1.65
1,205 $1,995 $1.66
Baths 1,206 $1,800 $1.49
Baths 1,206 $1,842 $1.53
$1,506 $1.81
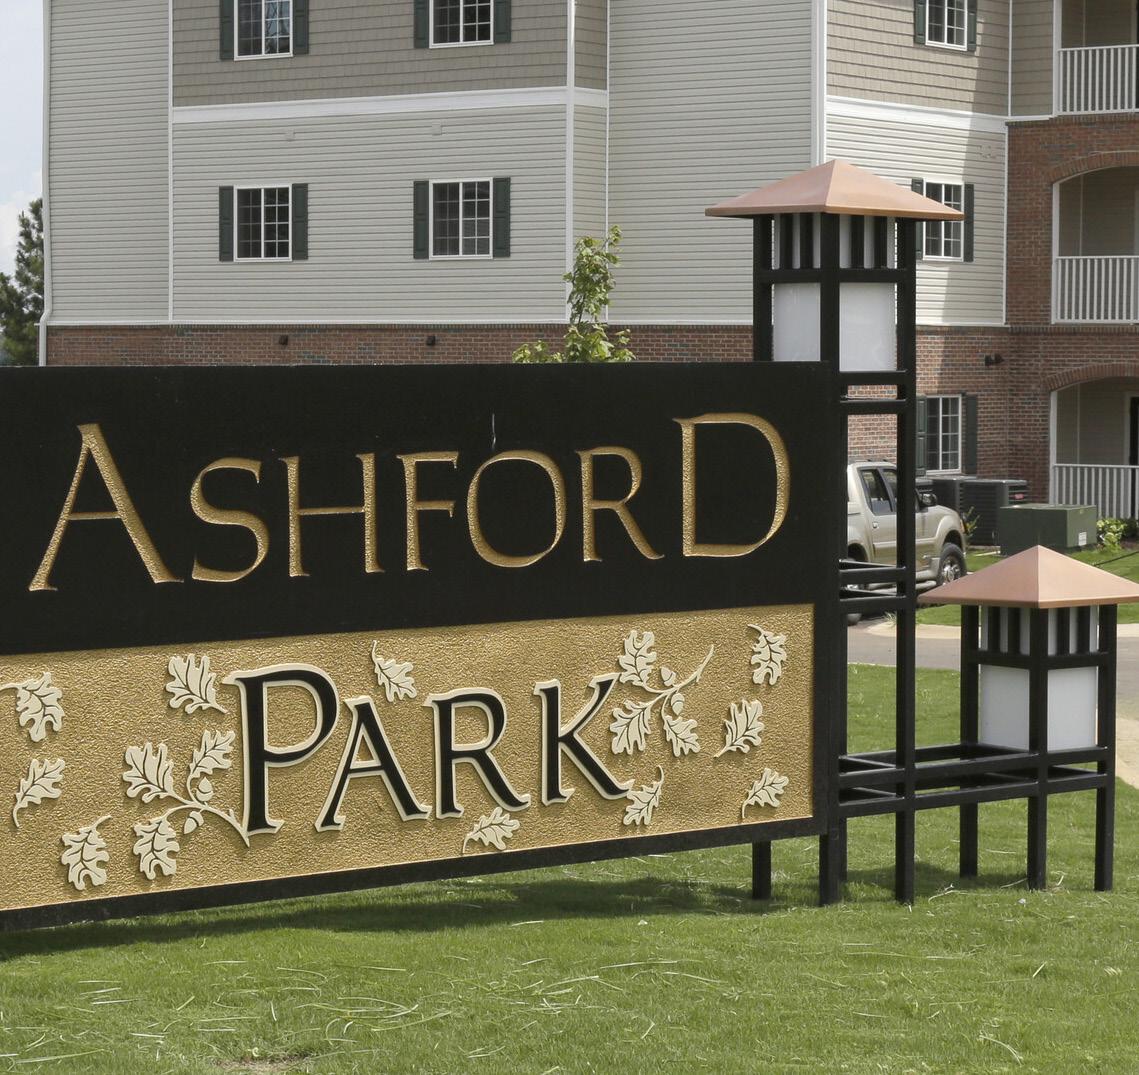
THE LIVELY Marke T Posi T ioning 18 COMPARABLE RENTALS 151 Bridgepoint Dr Duncan, SC 29334 Distance (mi): 6.81 Miles Units: 242 Built: 2016 Occupancy: 100% UNIT MIX UNITS TYPE UNIT SF MARKET RENT RENT / SF 44 1 Bedroom / 1 Bath 791 $980 $1.24 44 1 Bedroom / 1 Bath 919 $1,030 $1.12 66 2 Bedrooms / 2 Baths 1,125 $1,080 $0.96 66 2 Bedrooms / 2 Baths 1,253 $1,215 $0.97 22 3 Bedrooms / 2 Baths 1,717 $1,450 $0.84 242 Weighted Average 1,116 $1,123 $1.01 36 1 BED / 1 BA 36% 2 BED / 2 BA 55% 3 BED / 2 BA 9% ASHFORD PARK
THE LIVELY Marke T Posi T ioning 19 COMPARABLE RENTALS 900 Conductor Cir Greer, SC 29651 Distance (mi): 0.89 Miles Units: 264 Built: 2022 Occupancy: UNIT MIX UNITS TYPE UNIT SF MARKET RENT RENT / SF 108 1 Bedroom / 1 Bath 743 $1,237 $1.66 84 2 Bedrooms / 2 Baths 1,026 $1,406 $1.37 45 2 Bedrooms / 2 Baths 1,029 $1,391 $1.35 27 3 Bedrooms / 2 Baths 1,220 $1,644 $1.35 264 Weighted Average 931 $1,359 $1.46 41 1 BED / 1 BA 41% 2 BED / 2 BA 49% 3 BED / 2 BA 10% RYDER JUNCTION
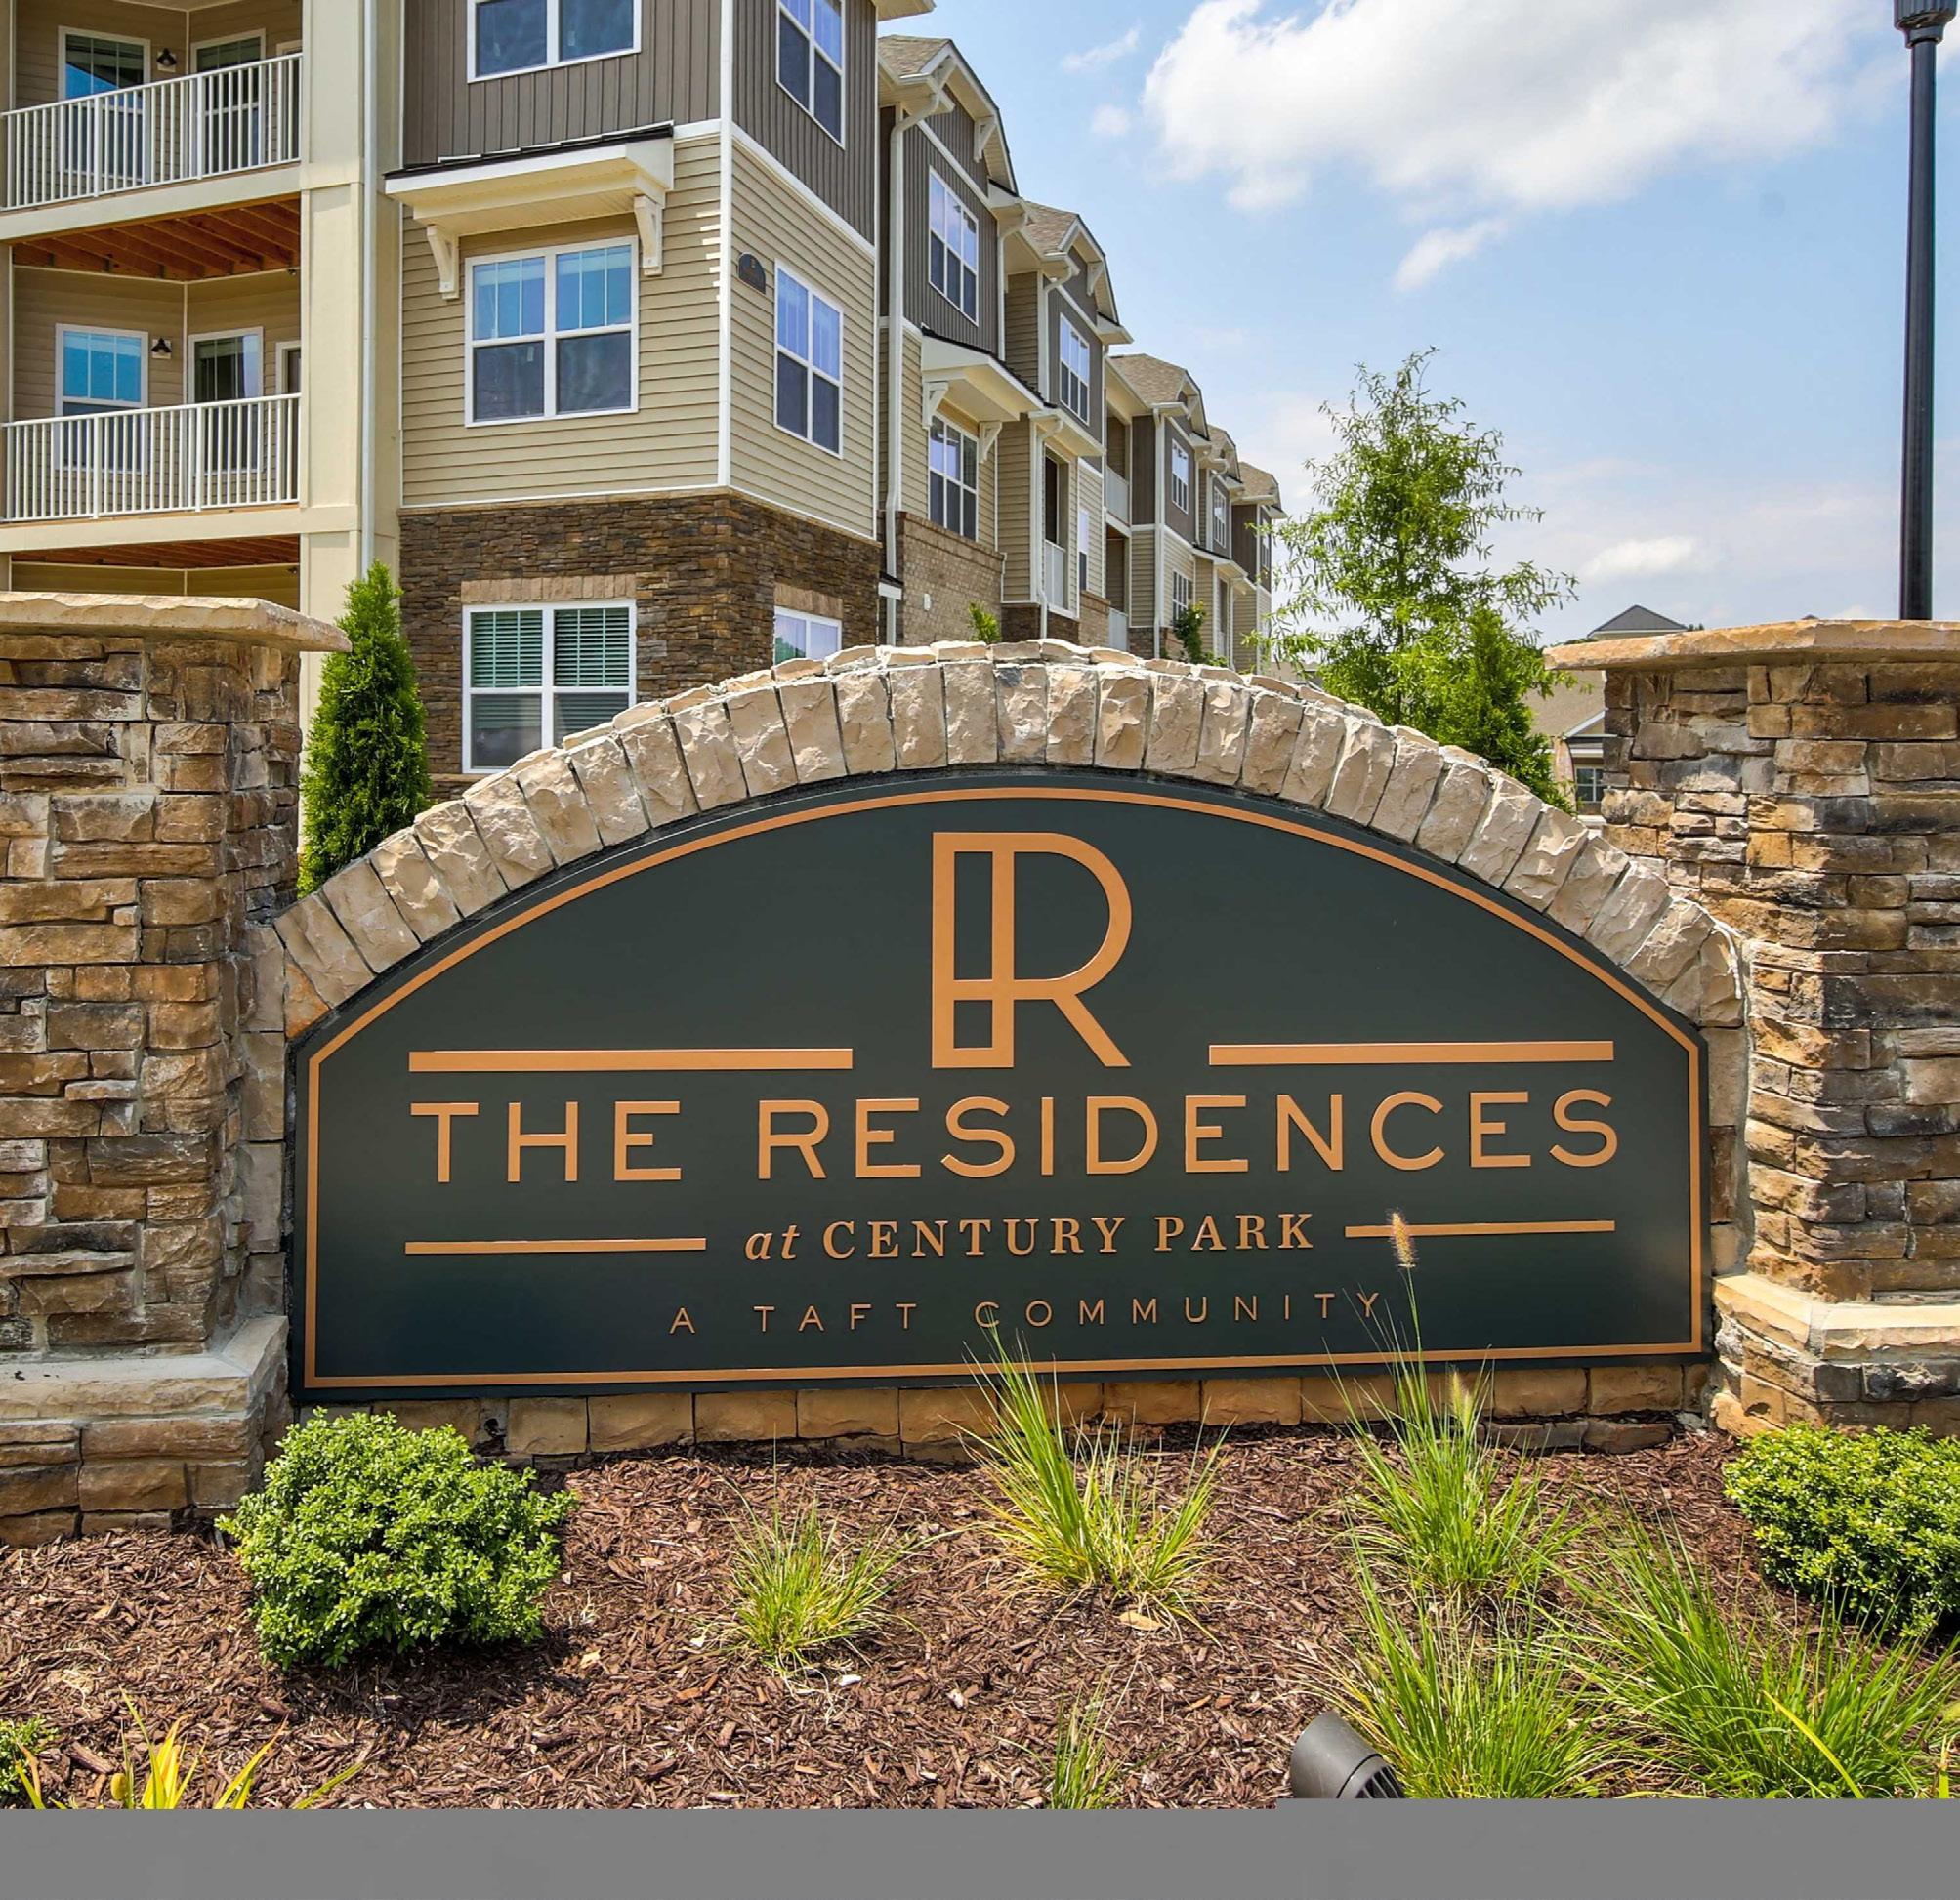
THE LIVELY Marke T Posi T ioning 20 COMPARABLE RENTALS 3000 Daventry Cir Greer, SC 29650 Distance (mi): 1.35 Miles Units: 298 Built: 2018 Occupancy: 96% UNIT MIX UNITS TYPE UNIT SF MARKET RENT RENT / SF 48 1 Bedroom / 1 Bath 835 $1,279 $1.53 76 1 Bedroom / 1 Bath 914 $1,290 $1.41 66 2 Bedrooms / 2 Baths 1,176 $1,542 $1.31 24 2 Bedrooms / 2 Baths 1,185 $1,542 $1.30 60 2 Bedrooms / 2 Baths 1,255 $1,565 $1.25 12 3 Bedrooms / 2 Baths 1,373 $1,840 $1.34 12 3 Bedrooms / 2 Baths 1,469 $1,880 $1.28 298 Weighted Average 1,091 $1,466 $1.34 42 1 BED / 1 BA 42% 2 BED / 2 BA 50% 3 BED / 2 BA 8% THE RESIDENCES AT CENTURY PARK
THE LIVELY Marke T Posi T ioning 21 COMPARABLE RENTALS
Miles Units:
Built:
Occupancy:
UNIT MIX UNITS TYPE UNIT SF MARKET RENT RENT / SF 30 1 Bedroom /
30 1
1
30 1
30 2 Bedrooms
2
30 2
2
30 2
30 2 Bedrooms
2
30 3
2
26 3 Bedrooms
2
266 Weighted Average
34 1 BED / 1 BA 34% 2 BED / 2 BA 45% 3 BED / 2 BA 21% THE GROVES AT BERRY CREEK
101 Halehaven Dr Duncan, SC 29334 Distance (mi): 8.52
266
2019
87%
1 Bath 840 $1,245 $1.48
Bedroom /
Bath 870 $1,380 $1.59
Bedroom / 1 Bath 938 $1,290 $1.38
/
Baths 1,022 $1,465 $1.43
Bedrooms /
Baths 1,085 $1,505 $1.39
Bedrooms / 2 Baths 1,093 $1,445 $1.32
/
Baths 1,157 $1,475 $1.27
Bedrooms /
Baths 1,298 $1,775 $1.37
/
Baths 1,370 $1,795 $1.31
1,070 $1,481 $1.38
THE LIVELY Marke T Posi T ioning 22 COMPARABLE RENTALS 1010 Palisade Wds Dr Duncan, SC 29334 Distance (mi): 5.87 Miles Units: 246 Built: 2019 Occupancy: 94% 37 1 BED / 1 BA 37% 2 BED / 2 BA 44% 3 BED / 2 BA 19% PALISADES AT DUNCAN UNIT MIX UNITS TYPE UNIT SF MARKET RENT RENT / SF 36 1 Bedroom / 1 Bath 771 $1,410 $1.83 36 1 Bedroom / 1 Bath 831 $1,415 $1.70 18 1 Bedroom / 1 Bath 949 $1,500 $1.58 90 2 Bedrooms / 2 Baths 1,102 $1,575 $1.43 18 2 Bedrooms / 2 Baths 1,224 $1,615 $1.32 24 3 Bedrooms / 2 Baths 1,303 $1,915 $1.47 24 3 Bedrooms / 2 Baths 1,383 $1,920 $1.39 246 Weighted Average 1,059 $1,592 $1.50
THE LIVELY Marke T Posi T ioning 23 COMPARABLE RENTALS ANALYSIS 1 BEDROOM $1,005 $1,237 $1,286 $1,305 $1,336 $1,430 $0 $200 $400 $600 $800 $1,000 $1,200 $1,400 $1,600 Ashford Park Ryder Junction The Residences at Century Park The Groves at Berry Creek Lively at Victor Park Palisades at Duncan Average $1,253
THE LIVELY Marke T Posi T ioning 24 COMPARABLE RENTALS ANALYSIS 2 BEDROOMS $1,148 $1,401 $1,473 $1,551 $1,562 $1,582 $0 $200 $400 $600 $800 $1,000 $1,200 $1,400 $1,600 $1,800 Ashford Park Ryder Junction The Groves at Berry Creek The Residences at Century Park Lively at Victor Park Palisades at Duncan Average $1,431
THE LIVELY Marke T Posi T ioning 25 COMPARABLE RENTALS ANALYSIS 3 BEDROOMS $1,450 $1,644 $1,784 $1,846 $1,860 $1,918 $0 $500 $1,000 $1,500 $2,000 $2,500 Ashford Park Ryder Junction The Groves at Berry Creek Lively at Victor Park The Residences at Century Park Palisades at Duncan Average $1,731
THE LIVELY Marke T Posi T ioning 26 COMPARABLE SALES PROPERTY UNITS BUILT PRICE PRICE/UNIT PRICE/SF AVG SF CAP RATE S The Lively at Victor Park 318 2022 833 0.00% 1 NOVO Mauldin 330 2021 $81,500,000 $246,970 $348.29 943 0.00% 2 Trailside Verdae 276 2020 $69,000,000 $250,000 $690.00 1052 0.00% 3 The Lofts at Woodside Mill 307 2021 $107,000,000 $348,534 $227.66 1114 0.00% AVERAGES* $281,835 $421.98 1,036 0.00% 3. THE LOFTS AT WOODSIDE MILL 1. NOVO MAULDIN 2. TRAILSIDE VERDAE S. THE LIVELY AT VICTOR PARK
THE LIVELY Marke T Posi T ioning 27 NORTH NOVO MAULDIN 101 MCCAW STREET, MAULDIN, SC 29662 Built: 2021 Units 330 Dist(mi) 10.91 Price/Unit $246,970 Sale Price $81,500,000.00 THE LIVELY AT VICTOR PARK 250 VICTOR AVENUE, GREER, SC 29651 Built: 2022 1 2 3 Built: 2020 Units 276 Dist(mi) 8.69 Price/Unit $250,000 Sale Price $69,000,000.00 TRAILSIDE VERDAE 180 WOODRUFF RD, GREENVILLE, SC 29607 Built: 2021 Units 307 Dist(mi) 13.06 Price/Unit $348,534 Sale Price $107,000,000.00 THE LOFTS AT WOODSIDE MILL 1 E MAIN ST, GREENVILLE, SC 29611 Greenville Mauldin Five Forks COMPARABLE SALES
THE LIVELY Marke T Posi T ioning 28
SALES
$227.66 $348.29 $690.00 $0.00 $100.00 $200.00 $300.00 $400.00 $500.00 $600.00 $700.00 $800.00 The Lofts at Woodside Mill NOVO Mauldin Trailside Verdae Average $421.98 $246,970 $250,000 $348,534 $0 $50,000 $100,000 $150,000 $200,000 $250,000 $300,000 $350,000 $400,000 NOVO Mauldin Trailside Verdae The Lofts at Woodside Mill Average $281,835 COMPARABLE
ANALYSIS PRICE PER UNIT PRICE PER SF
FINANCIALS
PROPERTY FACTS
THE LIVELY Financials 30
FINANCIAL SUMMARY
Units
Average Unit Size
SF Market Rent
Effective Rent
Upfront Capital Expenditures/Unit
UNDERWRITING ASSUMPTIONS Rental Income Total Income FYI Annual $5,485,973
FYI Monthly
Tax
75% Reval.
FY1 NOI
LOAN TERMS NEW FINANCING Loan Amount $39,780,000 Loan to Value
58% Interest Rate
Term 10 Amortization Period 30 Interest Only 10 DSCR
RESIDUAL Holding Period 10 Years Cap Rate
Gross Value
Per Unit
VALUES POTENTIAL REACH COMPETITIVE OFFER STRONG PRICE SUPPORT Cap Rate(FY1) 4.99% 5.06% 5.38% Price $69,000,000 $68,000,000 $64,000,000 Price/Unit $216,981 $213,836 $201,258 Price/SF $260 $257 $242 LEVERAGED YIELDS - VALUE ADD Unlevered Cash on Cash 5.85% 5.88% 5.97% Levered Cash on Cash 6.13% 6.18% 6.39% Cash on Cash(FY1 with I/O) 4.00% 4.05% 4.23% Cash on Cash(FY1 with amort) 2.30% 2.35% 2.53% INTERNAL RATE OF RETURN (IRR) - VALUE ADD All Cash IRR 6.93% 6.98% 7.17% Levered IRR 8.39% 8.49% 8.89% VALUATION POTENTIAL REACH $69,000,000 $68,000,000 $64,000,000 COMPETITIVE OFFER STRONG PRICE SUPPORT
information
be correct and
appraisal. Projections are
file
privileged and confidential;
Year built 2021 Occupancy as of (10/02/22) 24.53% Total
318 Size 264,896 SF
833
($/sqft) $1.81
($/sqft) $0.00 No. of Stories 3 Submarket Greer
$0 PROFORMA
$5,928,349
$457,164 $494,029 RE
Assumption
in
(T3 w/Tax Adjustment) ($79,500) NOI (FY1 w/Tax Adjustment) $3,457,903 5-Year NOI Growth (Cum.) 16%
(LTV)
5.65%
1.249886334
6.00%
$82,200,000
$258,491
IMPORTANT INFORMATION & DISCLAIMER: The
contained herein is assumed to
market-supported. Output produced from this model should not be considered an
forecasts and are not to be considered fact. The information contained in this
is
it is intended only for use by Berkadia® and their clients. This file may not be reproduced physically or in electronic format without the express written consent of Berkadia. Not responsible for errors and omissions.
YEAR ONE FORECASTED OPERATING STATEMENT
RENTAL REVENUES
UNITS TYPE UNIT SF TOTAL SF MARKET RENT RENT/SF MONTHLY MARKET RENT ANNUAL MARKET RENT
6 Studio 478 2,868 $1,225 $2.56 $7,350 $88,200
8 Studio 646 5,168 $1,175 $1.82 $9,400 $112,800
4 Studio 670 2,680 $1,226 $1.83 $4,905 $58,860
318 833 264,896 $1,506 $1.81 $478,980 $5,747,760
VALUES
Potential Reach (High) $69,000,000
Competitive Offers (Mid) $68,000,000
Strong Price Support (Low) $64,000,000
Debt Service Coverage(I/O) 1.51
Debt Service Coverage (Amortizing) 1.25
YEAR ONE FORECASTED OPERATING STATEMENT
INCOME YR 1 PROFORMA INCOME
Scheduled Market Rent
ANNUAL MONTHLY
$5,920,193 $493,349
Less: Loss to Lease ($29,601) ($2,467)
Subtotal Gross Potential Rent (GPR) $5,890,592 $490,883
Less: Physical Vacancy 5.00% ($294,530) ($24,544)
Less: Concessions 1.00% ($58,906) ($4,909)
Less: Non Revenue/Model 0.27% ($15,840) ($1,320)
Less: Employee Unit 0.10% ($5,891) ($491)
Less: Bad Debt 0.50% ($29,453) ($2,454)
Less: Down Unit $0 $0
Net Rental Income $5,485,973 $457,164
Economic Occupancy % 6.87%
Effective Rent/SF (GPR Less Concession Loss) $1.83
Plus: Utility Reimbursements
$190,266 $15,856
Plus: Other Income $63,600 $5,300
Plus: Parking Income $0 $0
Plus: Fee Income $188,510 $15,709
Total Other Income $442,376 $36,865
Total Operating Income (EGI) $5,928,349 $494,029
THE LIVELY Financials 31
YEAR ONE FORECASTED OPERATING STATEMENT
ANNUAL AMOUNTS
OPERATING EXPENSES ANNUAL MONTHLY /UNIT % OF EGI /SQ FT.
Apartment Prep/Turnover $39,750 $3,313 $125 0.7% $0.15 Administrative $79,500 $6,625 $250 1.3% $0.30
Marketing & Promotion $63,600 $5,300 $200 1.1% $0.24
Contracted Services $127,200 $10,600 $400 2.1% $0.48
Repairs & Maintenance $95,400 $7,950 $300 1.6% $0.36 Payroll $436,508 $36,376 $1,373 7.4% $1.65
Utilities $318,000 $26,500 $1,000 5.4% $1.20
Other Controllable Expenses1 $0 $0 $0 0.0% $0.00 Other Controllable Expenses2 $0 $0 $0 0.0% $0.00
Total Controllable Expenses $1,159,958 $96,663 $3,648 19.6% $4.38
Management Fee $177,850 $14,821 $559 3.0% $0.67 Insurance $111,300 $9,275 $350 1.9% $0.42
Real Estate Taxes $955,688 $79,641 $3,005 16.1% $3.61
Other Taxes & Assessments $0 $0 $0 0.0% $0.00
Other Non-Controllable Expenses1 $0 $0 $0 0.0% $0.00
Other Non-Controllable Expenses2 $0 $0 $0 0.0% $0.00
Total Non-Controllable Expenses $1,244,838 $103,737 $3,915 21.0% $4.70
Total Operating Expenses $2,404,796 $200,400 $7,562 40.6% $9.08
Net Operating Income $3,523,553 $293,629 $11,080 59.4% $13.30
Replacement Reserves $79,500 $6,625 $250 1.3% $0.30
Net Operating Income after RR $3,444,053 $287,004 $10,830 58.1% $13.00
THE LIVELY Financials 32
DETAILED UNIT MIX
UNIT TYPE SIZE (SF) TOTAL UNIT COUNT % OF MIX IN-PLACE RENT IN-PLACE RENT PER SF MAX RENT ACHIEVED
MAX RENT ACHIEVED PER SF MARKET RENT MARKET RENT PER SF
POST-RENO MARKET RENT
POST-RENO MARKET RENT PER SF
Studio 478 6 2% $1,162 $2.43 $1,185 $2.48 $1,225 $2.56 $1,225 $2.56
Studio 646 8 3% $1,095 $1.70 $1,200 $1.86 $1,175 $1.82 $1,175 $1.82
Studio 670 4 1% $1,169 $1.74 $1,335 $1.99 $1,226 $1.83 $1,226 $1.83
1 Bed / 1 Bath 579 40 13% $1,253 $2.16 $1,320 $2.28 $1,308 $2.26 $1,308 $2.26
1 Bed / 1 Bath 580 60 19% $1,279 $2.20 $1,395 $2.41 $1,347 $2.32 $1,347 $2.32
1 Bed / 1 Bath 697 8 3% $1,410 $2.02 $1,460 $2.09 $1,395 $2.00 $1,395 $2.00
2 Bed / 2 Bath 865 8 3% $1,493 $1.73 $1,495 $1.73 $1,574 $1.82 $1,574 $1.82
2 Bed / 2 Bath 933 49 15% $1,611 $1.73 $1,705 $1.83 $1,589 $1.70 $1,589 $1.70
2 Bed / 2 Bath 933 71 22% $1,521 $1.63 $1,610 $1.73 $1,545 $1.66 $1,545 $1.66
2 Bed / 2 Bath 958 18 6% $1,572 $1.64 $1,690 $1.76 $1,554 $1.62 $1,554 $1.62
3 Bed / 2 Bath 1,048 6 2% $1,725 $1.65 $1,725 $1.65 $1,725 $1.65 $1,725 $1.65
3 Bed / 2 Bath 1,205 8 3% $1,995 $1.66 $1,995 $1.66 $1,995 $1.66 $1,995 $1.66
3 Bed / 2 Bath 1,206 24 8% $1,878 $1.56 $1,965 $1.63 $1,842 $1.53 $1,842 $1.53
3 Bed / 2 Bath 1,206 8 3% $0 $0.00 $0 $0.00 $1,800 $1.49 $1,800 $1.49 WA/Totals
THE LIVELY Financials 33
Monthly Total $445,542 $483,935 $478,980 $478,980 Annual Total $5,346,506 $5,807,220 $5,747,760 $5,747,760
833 318 100% $1,401 $1.68 $1,522 $1.83 $1,506 $1.81 $1,506 $1.81
DEBT SCENARIOS
Property: The Lively Victor Park
Competitive Offers: $69,000,000 Rehab Budget: $0 Total Cost: $69,000,000 Property NOI: $3,457,903
Underwritten Debt Terms
PRODUCT: 10-YEAR FIXED
Interest Rate Type: Fixed Supplemental Loan Mezzanine Debt Preferred Equity Loan Amount: $39,780,000 Loan Amount Loan Amount Investment Amount LTPP 57.7% Combined Loan $39,780,000 Combined Loan $39,780,000 Combined Debt / Pref $39,780,000 LTC 57.7% LTPP 57.7% LTPP 57.7% LTPP 57.7% Underwritten NOI: $3,444,053 LTC 57.7% LTC 57.7% LTC 57.7%
Term (years): 10 Max LTV 80% Max LTV 85% Max LTV 90% Interest Only (years): 10 Min DSCR 1.25 Min DSCR 1.05 Min DSCR 1.05
Amortization (years): 30 Interest Rate Type:
Interest Rate Type: Minimum Annual Return (%):
Prepayment: Yield Maintenance Interest Rate Interest Rate
Minimum Annual Return ($):
Spread (bps): 175 IO Period (years) IO Period (years) Total Return
Index: 10yr UST Amortization (years) Amortization (years) Amortization
Index Rate: 3.90% Loan Term Loan Term Investment Term
Interest Rate: 5.65% Annual P&I: $0 Annual P&I: $0 DSCR:
Annual P&I: $2,755,493 I/O DSCR (w/ amortizing 1st)
I/O DSCR (w/ amortizing 1st) I/O DSCR 1.51 Amort DSCR (w/ amortizing 1st) Amort DSCR (w/ amortizing 1st) Amortizing DSCR 1.25
VARIOUS DEBT STRATEGIES
Product: Existing Loan Product: 5-Year Fixed 7-Year Fixed 10-Year Fixed 3-Year Float 5-Year Float 7-Year Float 10-Year Float Originating Lender xyz Interest Rate Type: Fixed Fixed Fixed Variable Variable Variable Variable Master Servicer abc Loan Amount: $45,090,000 $47,290,000 $39,780,000 $55,200,000 $55,200,000 $47,290,000 $39,780,000 Special Servicer abc LTPP 65.3% 68.5% 57.7% 80.0% 80.0% 68.5% 57.7% Loan Type: CMBS LTC 65.3% 68.5% 57.7% 80.0% 80.0% 68.5% 57.7%
Original Loan Amount $10,000,000 Max DCSR Loan (Actual) $45,090,000 $47,290,000 $39,780,000 $47,290,000 $39,780,000
Current UPB $10,000,000 Max LTV Loan $55,200,000 $55,200,000 $41,400,000 $55,200,000 $55,200,000 $55,200,000 $41,400,000 LTPP 14.5% Max Debt Yield Loan: $38,270,000 $38,270,000 $38,270,000 $38,270,000 LTC 14.5% Underwritten NOI: $3,444,053 $3,444,053 $3,444,053 $3,444,053 $3,444,053 $3,444,053 $3,444,053
Origination Date 8/1/2015 Term (years): $5 $7 $10 $7 $10 $7 $10 1st Pmt Date 9/1/2015 Interest Only (years): $1 $2 $10 $2 $5 $2 $5 1st Amort Pmt Date 9/1/2018 Amortization (years): $30 $30 $30 $30 $30 $30 $30
Open Prepay Date 8/1/2020 Prepayment: Yield Maintenance Yield Maintenance Yield Maintenance 12mth LO; 1% after 12mth LO; 1% after 12mth LO; 1% after 12mth LO; 1% after Prepayment Yield Maintenance Max LTV: $1 $1 $1 $1 $1 $1 $1 Maturity Date 8/1/2022 Min DSCR (Actual): $1 $1 $1 N/A N/A $1 $1 Term Remaining (years) 5 Max Debt Yield: N/A N/A N/A $0 $0 $0 $0 I/O Period Remaining (years) 2 Spread (bps): $271 $254 $175 $375 $500 $265 $273 Interest Rate Type: Fixed Index: 5yr UST 7yr UST 10yr UST 30-Day LIBOR 30-Day LIBOR 30-Day LIBOR 30-Day LIBOR Interest Rate: 4.15%
$2,362,022 $2,007,424 I/O DSCR 8.22 I/O DSCR 1.79 1.74 1.51 1.54 1.17 2.48 2.87 Amortizing DSCR 5.93 Amortizing DSCR 1.30 1.25 1.25 1.09 0.94 1.46 1.72
Refinance Scenario
Interest Rate Sensitivity
Refinance Year 99 5.15% $26,580,000 $27,810,000 $24,500,000 $31,140,000 $30,910,000 UW NOI #N/A 5.25% $26,350,000 $27,570,000 $24,300,000 $30,850,000 $30,620,000
Cap Rate 6.00% 5.35% $26,120,000 $27,330,000 $24,110,000 $30,560,000 $30,330,000
Refinance Valuation #N/A 5.45% $25,900,000 $27,090,000 $23,920,000 $30,280,000 $30,050,000
Max LTV 75% 5.55% $25,670,000 $26,860,000 $23,730,000 $30,000,000 $29,780,000
New Loan Term (years) 7 5.65% $25,460,000 $26,630,000 $23,550,000 $29,720,000 $29,510,000
Interest Rate 5.00% 5.75% $25,240,000 $26,410,000 $23,370,000 $29,450,000 $29,240,000
Interest Only (years) 1 5.85% $25,030,000 $26,190,000 $23,190,000 $29,190,000 $28,970,000
Amortization (years) 30 5.95% $24,820,000 $25,970,000 $23,010,000 $28,920,000 $28,720,000
Min DSCR 1.25 6.05% $24,620,000 $25,750,000 $22,830,000 $28,660,000 $28,460,000
Refinance Loan Amount #N/A 6.15% $24,410,000 $25,540,000 $22,660,000 $28,410,000 $28,210,000
THE LIVELY Financials 34
Index Rate: $0 $0 $0 $0 $0 $0 $0 Amortization (years): 30 Interest Rate: 4.21% 4.14% 5.65% 4.00% 5.25% 2.90% 2.98% Annual P&I $583,324 Annual P&I: $2,649,133 $2,755,238 $2,755,493 $3,162,399 $3,657,797
MARKET OVERVIEW
DEMOGRAPHICS
One-Mile Radius Three-Mile Radius Five-Mile Radius Spartanburg County Greenville-AndersonMauldin, SC MSA
2022 Estimated Population 9,129 34,671 84,083 337,571 954,423
Projected 2027 Population 9,499 36,170 87,899 348,810 986,600 Population Change (2022 - 2027) 4.1% 4.3% 4.5% 3.3% 3.4%
2022 Estimated Median HHI $41,098 $56,041 $64,454 $55,240 $59,128
Projected 2027 Median HHI $47,142 $63,393 $72,744 $62,824 $67,926
Median HHI Growth (2022 - 2027) 14.7% 13.1% 12.9% 13.7% 14.9%
Key Renter Age Group (18 to 35) 21% 21% 22% 23% 23% Households Earning $100,000+ Annually 11% 21% 28% 21% 26% Bachelor's Degree or Higher (Age 25+) 13% 26% 32% 24% 30%

Single-person Households 32% 27% 24% 26% 26% Renter-Occupied Housing Units 45% 33% 27% 27% 28% White-Collar Workers 37% 54% 60% 56% 61%
Workplace Establishments 275 1,022 2,025 7,400 21,628
FTE Employees* 4,550 16,579 33,656 161,503 354,860 *Full-Time Equivalent Workplace Employees
THE LIVELY Marke T o verview 36
KEY TAKEAWAYS: FIVE-MILE RADIUS TARGET MARKET AREA (TMA)
STURDY POPULATION HOUSEHOLD DEMOS RENTER FRIENDLY
4.5% FORECAST POPULATION GROWTH over the next five years, compared to the Greenville MSA of 3.4%
MEDIAN HHI IS PROJECTED TO REACH $72,744 BY 2027, a 12.9% increase from 2022
28% of households earn $100K OR MORE ANNUALLY
RENTER VS OWNER MEDIAN HOUSEHOLD INCOME
Renter: $38,177 | Owner: $69,249
– 22% OF RESIDENTS in the key renter age group of 18 to 35
– 27% RENTER-OCCUPIED housing units
STRONG WORKFORCE
60% OF WORKERS IN WHITE-COLLAR POSITIONS
– 32% of residents (age 25+) possess a BACHELOR’S DEGREE OR HIGHER
– Education and health services @ 21% is LARGEST EMPLOYED POPULATION
– Manufacturing @ 18% is SECOND-LARGEST EMPLOYED POPULATION
– Wholesale and retail trade @ 14% rounds out the TOP THREE LARGEST EMPLOYED SECTORS
MARKET RESILIENCY ANALYSIS
65 OVERALL MARKET RESILIENCY, COMPARED TO 50 NATIONWIDE*
Volatility: 100 Demand: 51 Cost of Living: 47 Employment: 61
*The higher the score, the better a market’s ability to withstand an economic downturn (Source: Berkadia Pyxis)
THE LIVELY Marke T o verview 37
APARTMENT MARKET OVERVIEW
Among the six apartment submarkets in the Greenville metropolitan service area, the Lively Victor Park apartment community is in the North Greenville submarket, according to RealPage.

At the end of the third quarter of 2022, the submarket contained 19,803 market-rate apartments, representing 28% of the total existing inventory metrowide.
Multifamily construction consistently added new units in the submarket for the past 10 years, where nearly 2,865 market rate units came online since 2012, a 15% inventory expansion
THE LIVELY Marke T o verview 38
THE LIVELY Marke T o verview 39 APARTMENT MARKET OVERVIEW EFFECTIVE RENT $1,299 PER MONTH IN 3Q22 Up 16.4% year over year, outpacing the annual five-year average of $974/month by 33% OCCUPANCY 96.5% AVERAGE OCCUPANCY RATE IN 3Q22 130 basis points above the submarket’s five-year average (95.2%) RENT VS. OWN THE MEDIAN HOME PRICE IN ZIP CODE 29651 IS $346,000 (SEPTEMBER 2022) Housing favors renting over homeownership by $742 per month Average Mortgage Payment*: $1,971 Average submarket effective rent: $1,229 Difference: $742 * Calculation based on the following criteria: 30-year fixed, 20% down, 6.24% interest rate, 0.57% SC property tax, $1,249 homeowner’s insurance. Sources: RealPage; National Association of Realtors $811 $841 $856 $924 $965 $982 $1,145 $1,299 88% 91% 94% 97% 100% $600 $800 $1,000 $1,200 $1,400 2015 2016 2017 2018 2019 2020 2021 3Q22 RENT VS. OCCUPANCY NORTH GREENVILLE SUBMARKET Effective Rent Occupancy Rate 4.6% 3.7% 1.8% 7.9% 4.4% 1.8% 16.6% 14.8% 0% 2% 4% 6% 8% 10% 12% 14% 16% 18% 2015 2016 2017 2018 2019 2020 2021 2022 ANNUAL EFFECTIVE RENT GROWTH NORTH GREENVILLE SUBMARKET (Projected) 12.6% 12.7% 13.2% 16.4% 18.3% 20.8% 0% 10% 20% Spartanburg South Greenville Clemson/Pickens County North Greenville Anderson Central Greenville ANNUAL EFFECTIVE RENT GROWTH *As of 2Q222
KEY EMPLOYERS
COMPANY NAME ADDRESS

CITY STATE ZIP # EMP DISTANCE
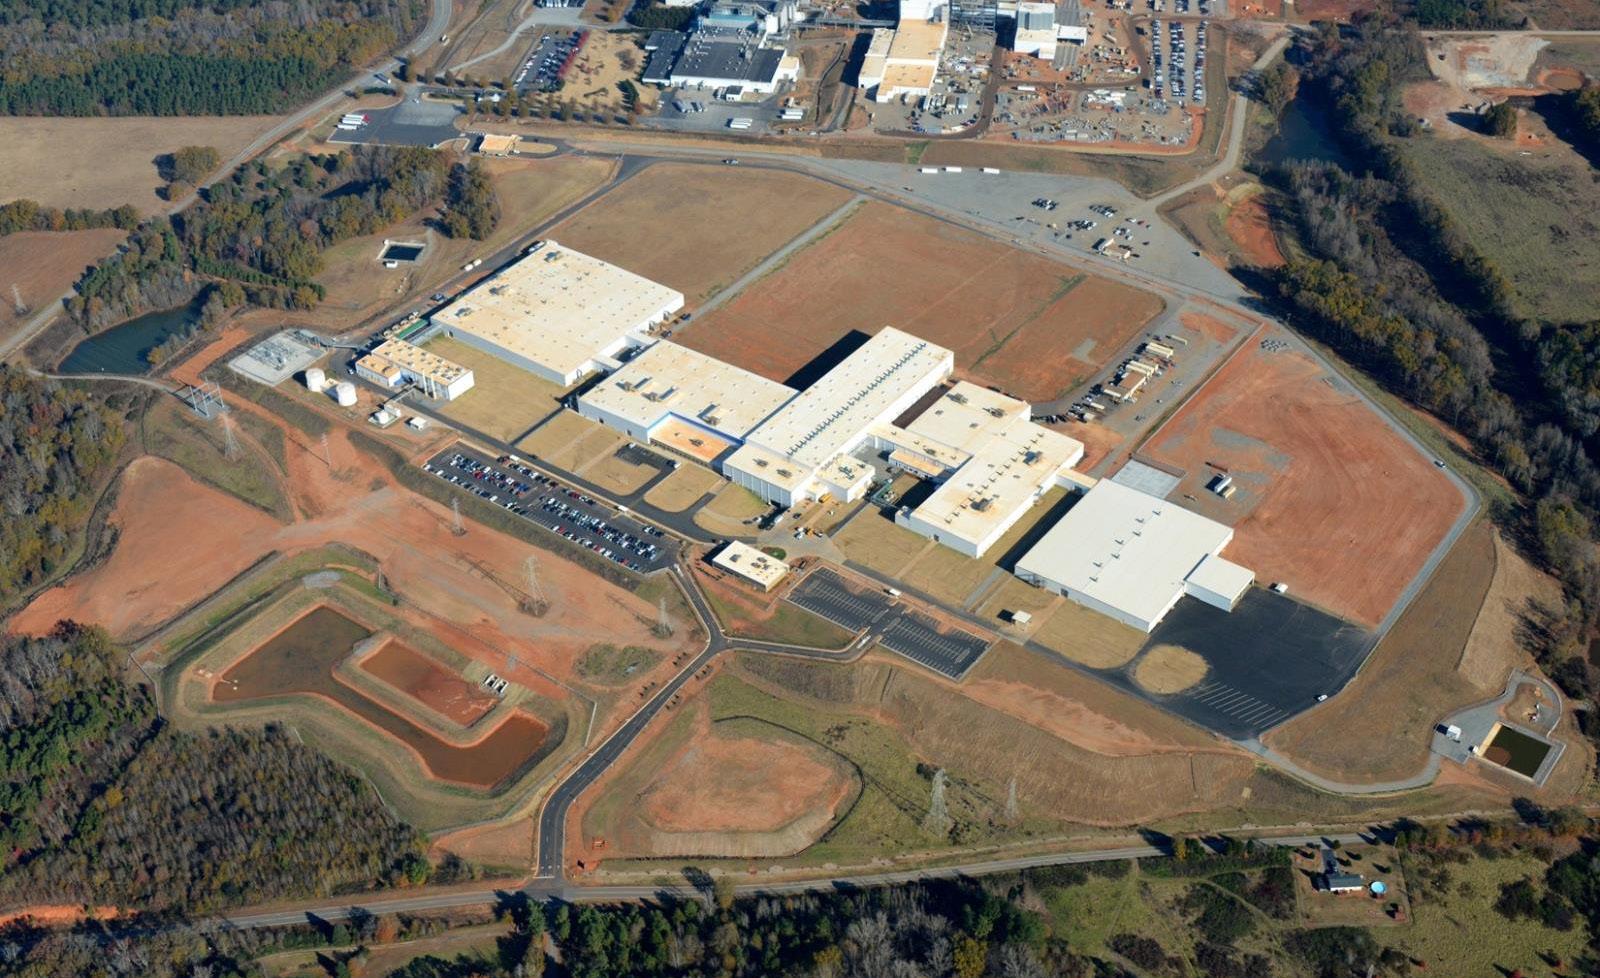
1 BMW 1400 Highway 101 South Greer SC 29651 11,000 3.6
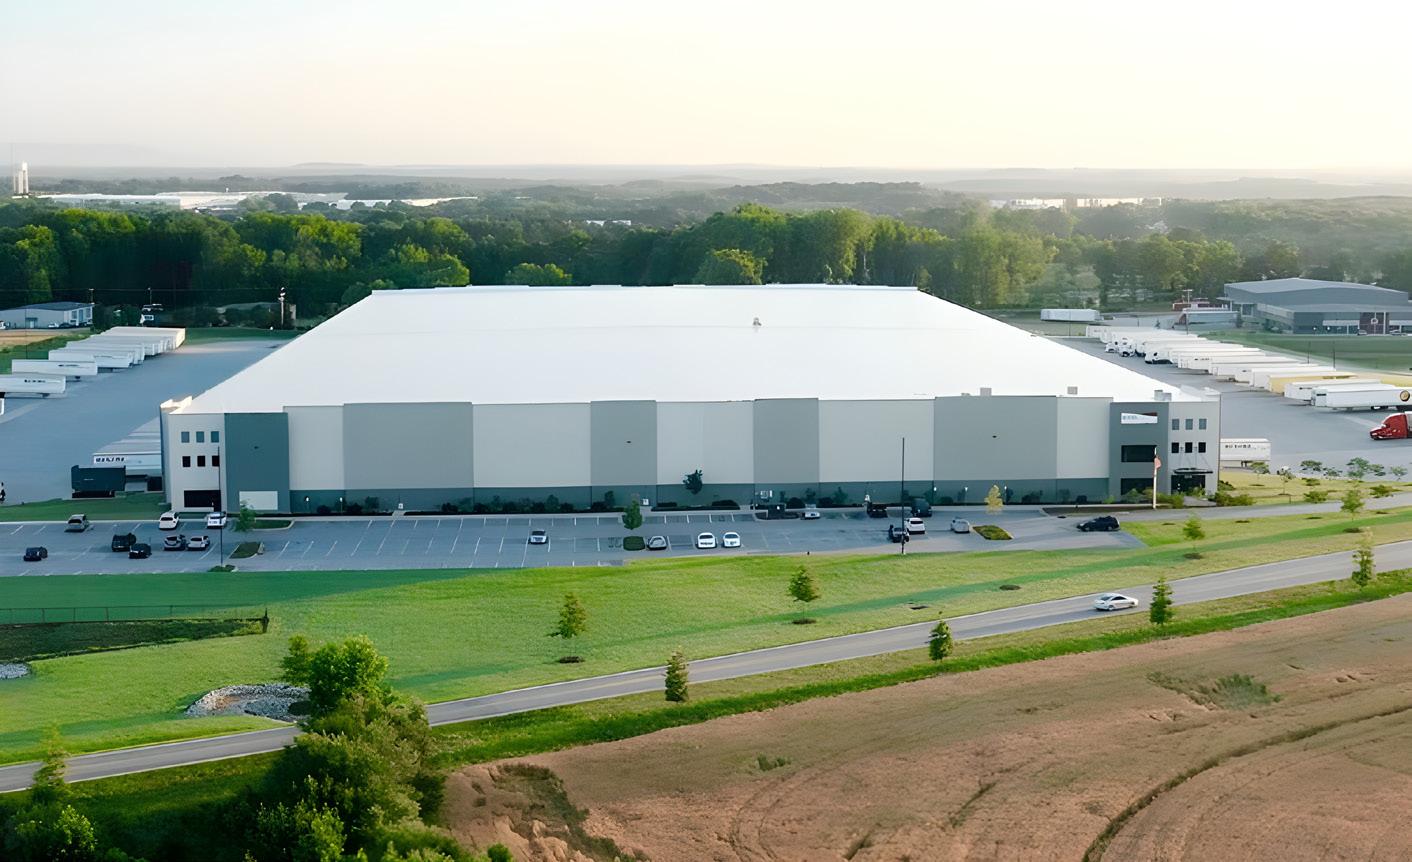
2 Bencore Logistic Systems, Inc. 2501 Highway 101 South Greer SC 29651 800 7.1

3 Honeywell International 400 S Buncombe Rd Greer SC 29650 645 2.7
4 Mitsubishi Polyester Film, Inc. 2001 Hood Road Greer SC 29652 600 3.1
5 Pelham Medical Center 250 Westmoreland Road Greer SC 29651 446 6.1

Note: Employee counts are estimates
Source: Upstate SC Alliance
4 5
1 2 3
6
KEY EMPLOYERS
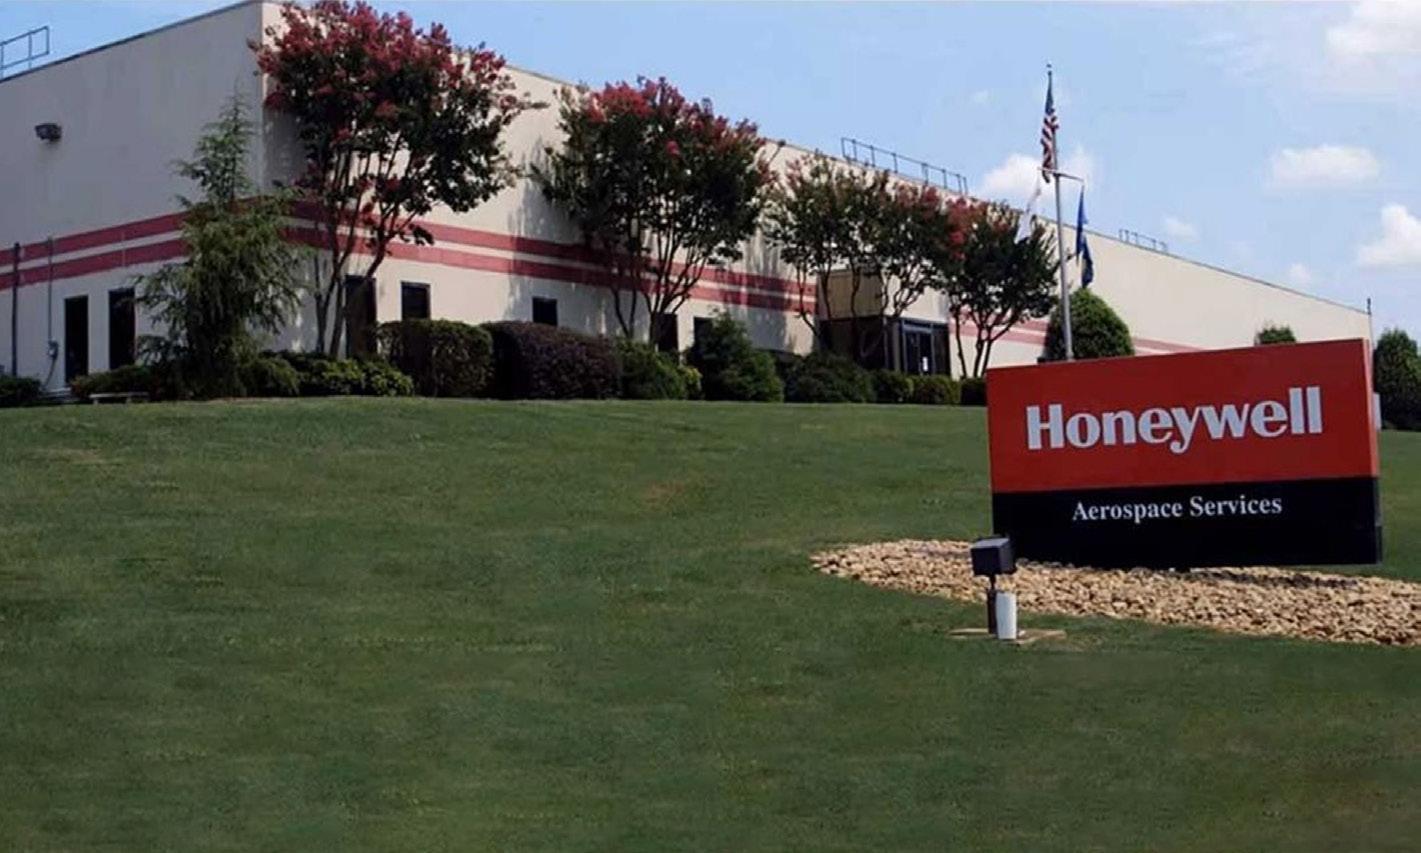
HONEYWELL AEROSPACE (2.7 MI.)
400 S Buncombe Rd, Greer, SC 29650
Major center for the company’s machining, special processes, maintenance repair, and overhaul services for both commercial and military aircraft
One of several Honeywell divisions that maintains a footprint within the state
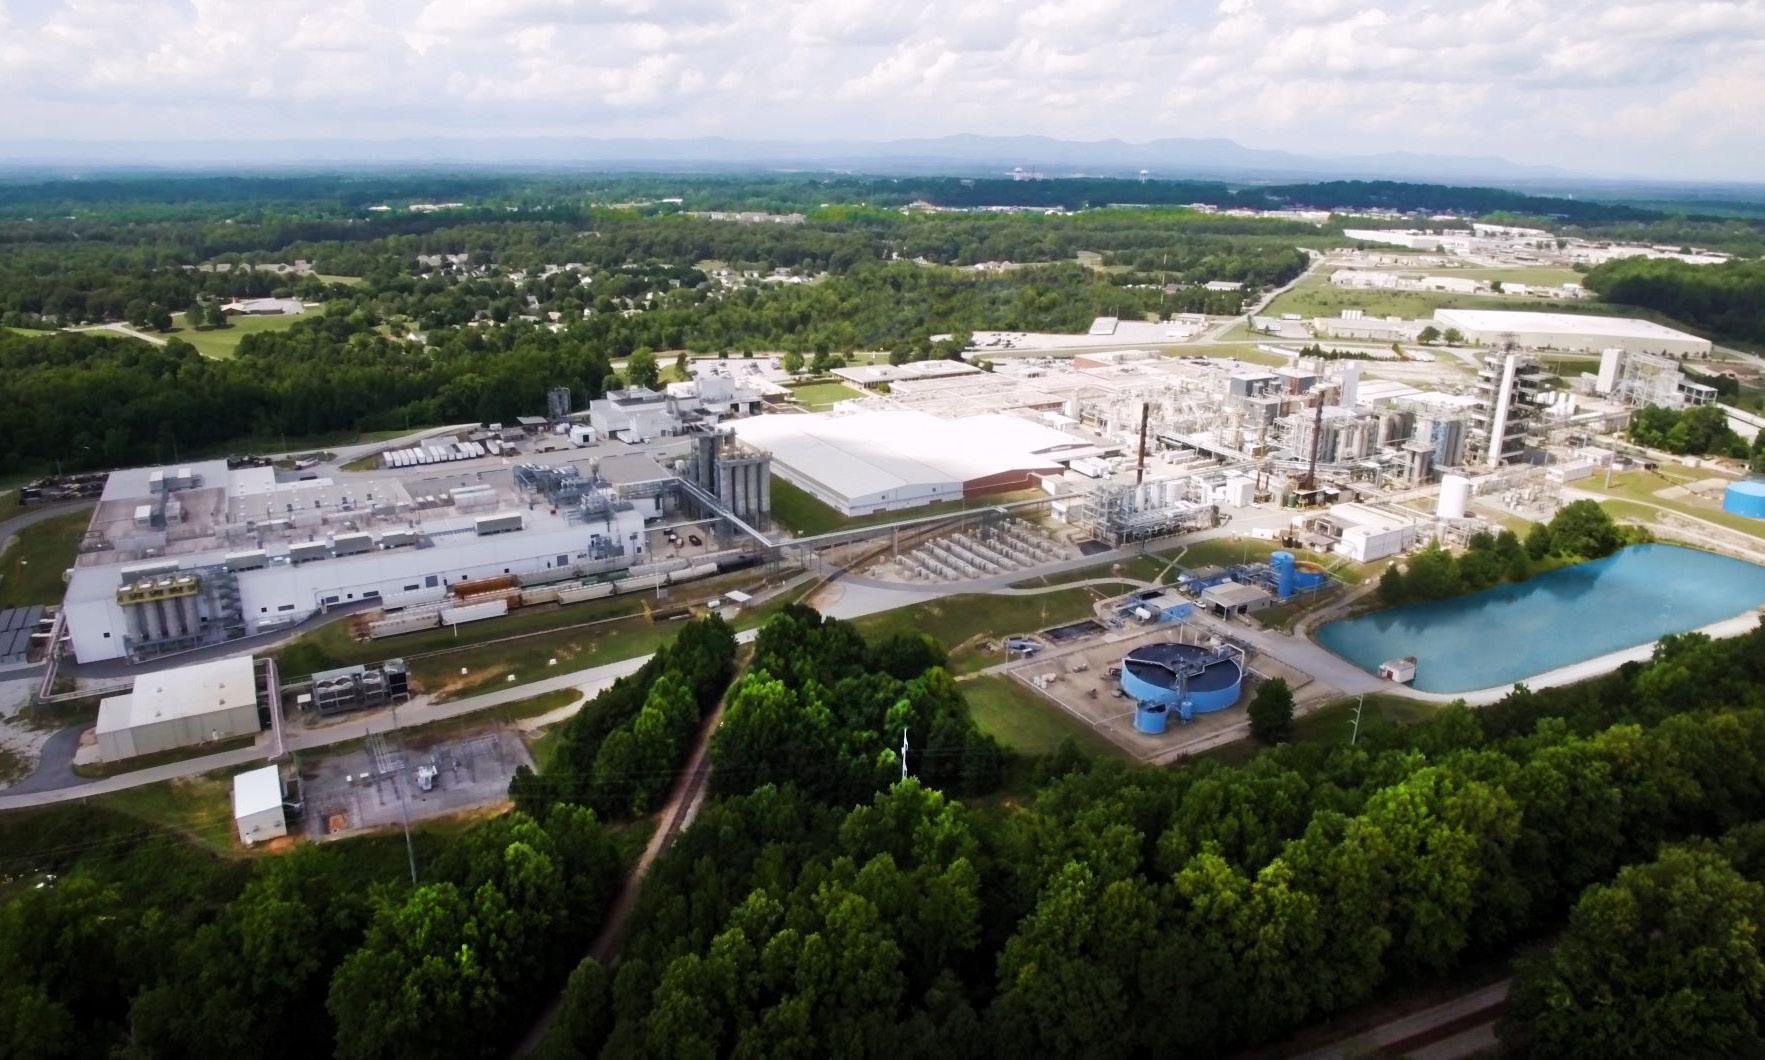
MITSUBISHI CHEMICAL CORPORATION (3.1 MI.)
2001 Hood Rd, Greer, SC 29650
THE LIVELY Marke T o verview 41
Greer facility in operation for 50+ years Manufactures synthetic resins, plastics materials, and nonvulcanizable elastomers 645 EMPLOYEES 600 EMPLOYEES 193 ACRE SITE
KEY EMPLOYERS
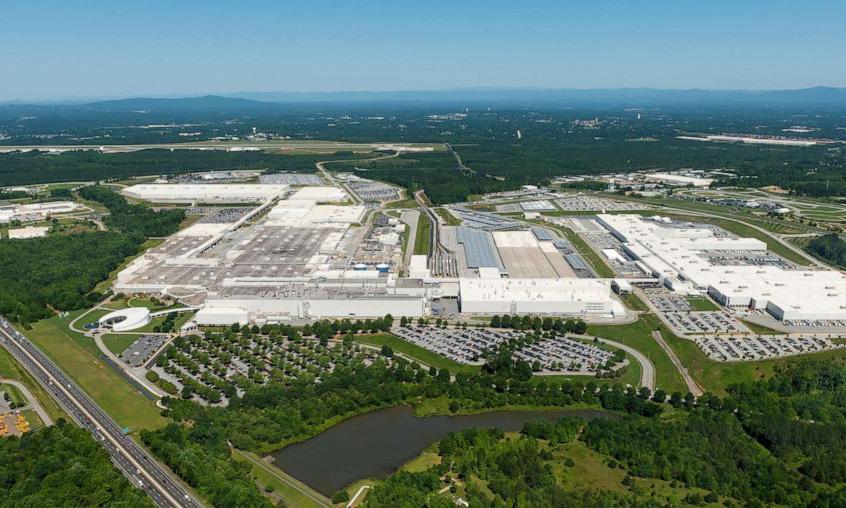
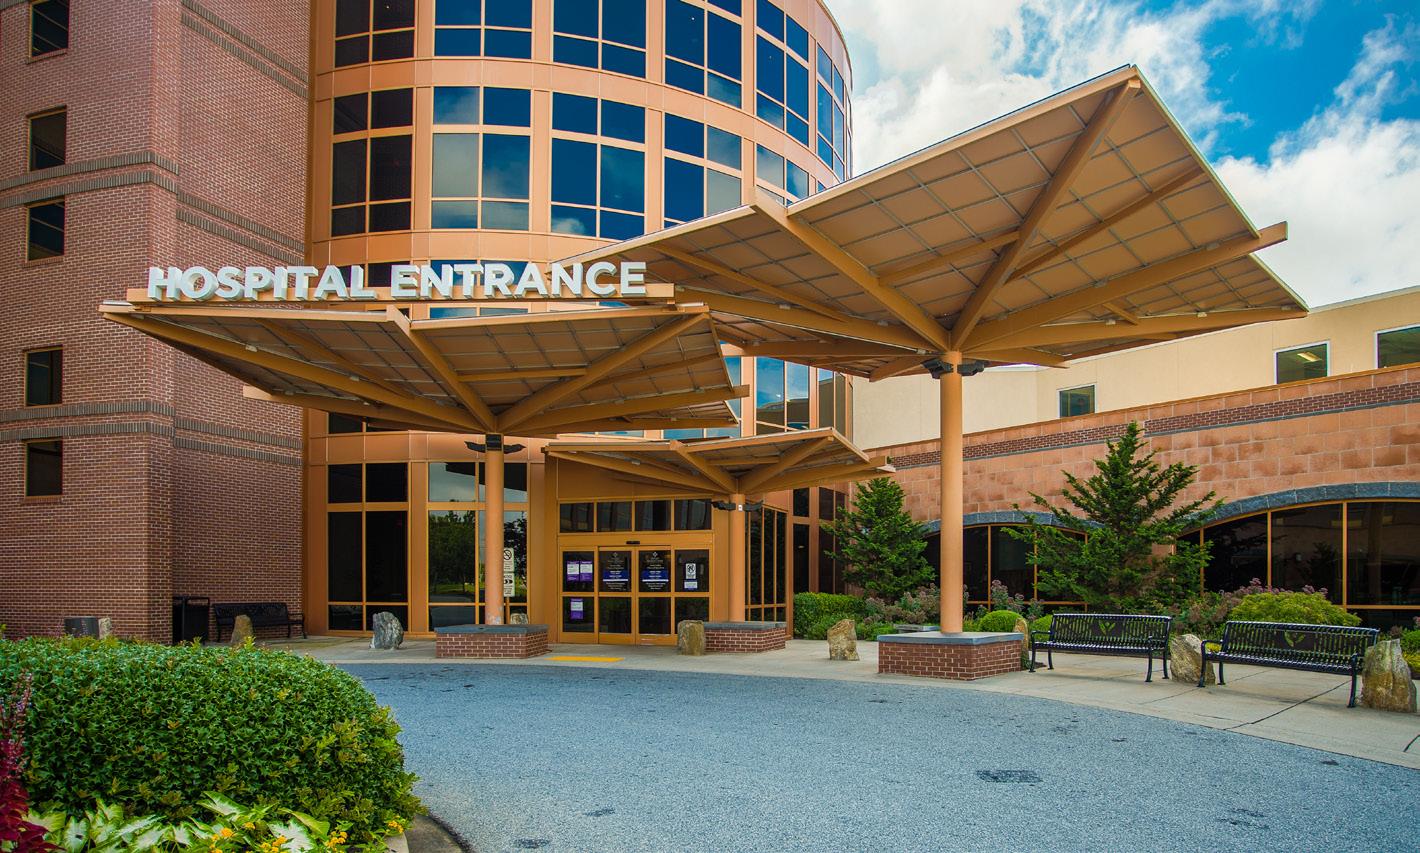
BMW (3.6 MI.) 1400 Highway 101 South, Greer, SC 29651 PELHAM MEDICAL CENTER (6.1 MI.) 250 Westmoreland Rd, Greer, SC 29651
THE LIVELY Marke T o verview 42
Manufacturing
– BMW sports
vehicles
$200 expansion announced March 2022 219,000 SF press shop 200 new jobs Start
Part of Spartanburg Regional Healthcare System $33.5
ER completed
Primary physician care, diagnostic capabilities, surgery, and
446 EMPLOYEES 11,000 EMPLOYEES 1,500 VEHICLES PRODUCED DAILY 48 HOSPITAL BEDS
plant
activity
Largest BMW Group plant in the world
$20 million performance driving school
production in summer of 2024
million expansion of
in 2019
a cancer center
THE LIVELY Marke T o verview 43 KEY EMPLOYERS BENCORE LOGISTIC SYSTEMS, INC. (7.1 MI.) 2501 SC-101, Greer, SC 29651 MICHELIN NORTH AMERICAN HEADQUARTERS (7.1 MI.) 1 Parkway S, Greenville, SC 29615 Full-service supply chain management provider Product distribution Transload services Warehouse services 14-acre, 232,000 SF facility consisting of three five-story buildings 800 EMPLOYEES 1,400 EMPLOYEES

THE LIVELY Marke T o verview 44
Electric
861 Victor
SC LIFESTYLE & ENTERTAINMENT Greer STATIOVN – 12 blocks w/retail, dining, entertainment, & services Pelham Mill Park Vicario Micro-Distillery and Farm Lake Robinson Recreational Area Willow Creek Golf Course Greer Golf Course Greer City Park
MAJOR DEVELOPMENTS / CORPORATE EXPANSIONS
vehicle battery factory
$76 million initial investment
327,000 SF battery systems factory
200 new jobs
Expected to launch in 2H22
10.8 million manufacturing plant
PET containers
40 new jobs
Production planned for 4Q22 PROTERRA INC. Carolina Commerce Center, Greer, SC VPET USA
Hill Road in Greer,
The material contained in this document is confidential, furnished solely for the purpose of considering investment in the property described therein and is not to be copied and/or used for any purpose or made available to any other person without the express written consent of Berkadia Real Estate Advisors LLC and Berkadia Real Estate Advisors Inc. In accepting this, the recipient agrees to keep all material contained herein confidential.
This information package has been prepared to provide summary information to prospective purchasers and to establish a preliminary level of interest in the property described herein. It does not, however, purport to present all material information regarding the subject property, and it is not a substitute for a thorough due diligence investigation. In particular, Berkadia Real Estate Advisors LLC, Berkadia Real Estate Advisors Inc. and Seller have not made any investigation of the actual property, the tenants, the operating history, financial reports, leases, square footage, age or any other aspect of the property, including but not limited to any potential environmental problems that may exist and make no warranty or representation whatsoever concerning these issues. The information contained in this information package has been obtained from sources we believe to be reliable; however, Berkadia Real Estate Advisors LLC, Berkadia Real Estate Advisors Inc. and Seller have not conducted any investigation regarding these matters and make no warranty or representation whatsoever regarding the accuracy or completeness of the information provided. Any pro formas, projections, opinions, assumptions or estimates used are for example only and do not necessarily represent the current or future performance of the property.
Berkadia Real Estate Advisors LLC and Berkadia Real Estate Advisors Inc. and Seller strongly recommend that prospective purchasers conduct an in-depth investigation of every physical and financial aspect of the property to determine if the property meets their needs and expectations. We also recommend that prospective purchasers consult with their tax, financial and legal advisors on any matter that may affect their decision to purchase the property and the subsequent consequences of ownership.
All parties are advised that in any property the presence of certain kinds of molds, funguses, or other organisms may adversely affect the property and the health of some individuals. Berkadia Real Estate Advisors LLC and Berkadia Real Estate Advisors Inc. recommend, if prospective buyers have questions or concerns regarding this issue, that prospective buyers conduct further inspections by a qualified professional.
The Seller retains the right to withdraw, modify or cancel this offer to sell at any time and without any notice or obligation. Any sale is subject to the sole and unrestricted approval of Seller, and Seller shall be under no obligation to any party until such time as Seller and any other necessary parties have executed a contract of sale containing terms and conditions acceptable to Seller and such obligations of Seller shall only be those in such contract of sale.
For more information on these and other Berkadia® exclusive listings, please visit our website at www.Berkadia.com Berkadia®, a joint venture of Berkshire Hathaway and Jefferies Financial Group, is an industry leading commercial real estate company providing comprehensive capital solutions and investment sales advisory and research services for multifamily and commercial properties. Berkadia® is amongst the largest, highest rated and most respected primary, master and special servicers in the industry.
© 2022 Berkadia Proprietary Holding LLC
Berkadia® is a trademark of Berkadia Proprietary Holding LLC
Investment sales and real estate brokerage businesses are conducted exclusively by Berkadia Real Estate Advisors LLC and Berkadia Real Estate Advisors Inc. Commercial mortgage loan origination and servicing businesses are conducted exclusively by Berkadia Commercial Mortgage LLC and Berkadia Commercial Mortgage Inc. Tax credit syndication business is conducted exclusively by the Tax Credit Syndication group. In California, Berkadia Real Estate Advisors Inc. conducts business under CA Real Estate Broker License #01931050; Adrienne Barr, CA DRE Lic. # 01308753. Berkadia Commercial Mortgage LLC conducts business under CA Finance Lender & Broker Lic. #988-0701; and Berkadia Commercial Mortgage Inc. under CA Real Estate Broker Lic. #01874116. This proposal is not intended to solicit commercial mortgage loan brokerage business in Nevada. For state licensing details, visit: https://www.berkadia.com/licensing/ ATS274330
INVESTMENT SALES CALEB TROOP MANAGING DIRECTOR 314.607.3481 caleb.troop@berkadia.com MARK BOYCE MANAGING DIRECTOR 843.628.3765 mark.boyce@berkadia.com BLAKE COFFEY DIRECTOR 843.628.3766 blake.coffey@berkadia.com MORTGAGE BANKING JOSH FINLEY SENIOR DIRECTOR 404.654.259 josh.finley@berkadia.com RICHARD LEVINE SENIOR MANAGING DIRECTOR 404.654.2590 richard.levine@berkadia.com JOHN BRAY SENIOR MANAGING DIRECTOR 404.654.2595 john.bray@berkadia.com BERKADIA ATLANTA, GA | Three Alliance Center | 3550 Lenox Road, Suite 2600 | Atlanta, GA 30326 CHARLOTTE, NC | 6000 Fairview Road | Suite 1200 | Charlotte, NC 28210 CHARLESTON, SC | 207 East Bay Street | Suite 301 & 312 | Charleston, SC 29401
