COMMUNITY HEALTH NEEDS ASSESSMENT 2022-2024 HARDIN
(or worse) in the care of specific conditions. Thus, Hardin County’s low death rates in several categories may show that residents are seeking and receiving care quickly for few events, or they may be doing a better job of caring for themselves, thus reducing the number of events overall. The data in the table is based on all deaths from the counties, Kentucky, and the U.S., from 2015 through 2019. Heart disease remains the No. 1 killer in the service area; however, cancer is gaining on heart disease and is projected to overtake it in the future. Of course, these statistics were from before COVID19, which had a profound effect on mortality in Kentucky and the United States as a whole.
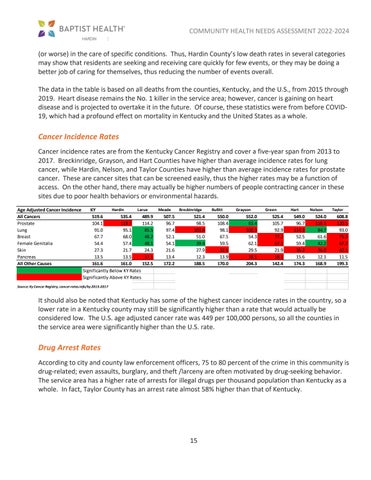
Cancer Incidence Rates Cancer incidence rates are from the Kentucky Cancer Registry and cover a five-year span from 2013 to 2017. Breckinridge, Grayson, and Hart Counties have higher than average incidence rates for lung cancer, while Hardin, Nelson, and Taylor Counties have higher than average incidence rates for prostate cancer. These are cancer sites that can be screened easily, thus the higher rates may be a function of access. On the other hand, there may actually be higher numbers of people contracting cancer in these sites due to poor health behaviors or environmental hazards. Age Adjusted Cancer Incidence All Cancers Prostate Lung Breast Female Genitalia Skin Pancreas All Other Causes
Hardin Larue KY 519.6 535.4 489.9 104.1 118.7 114.2 91.0 95.1 85.5 67.7 68.0 48.2 54.4 57.4 48.1 27.3 21.7 24.3 13.5 13.5 17.1 161.6 161.0 152.5 Significantly Below KY Rates Significantly Above KY Rates
Meade
507.5 96.7 97.4 52.1 54.1 21.6 13.4 172.2
Breckinridge
521.4 98.5 103.8 51.0 39.4 27.9 12.3 188.5
Bullitt
550.0 108.4 98.1 67.5 59.5 32.6 13.9 170.0
Grayson
552.0 83.4 100.3 54.3 62.1 29.5 18.1 204.3
Green
525.4 105.7 92.9 77.2 67.2 21.9 18.1 142.4
Hart
549.0 96.7 114.3 52.5 59.4 36.2 15.6 174.3
Nelson
524.0 118.5 84.7 61.6 42.2 36.0 12.1 168.9
Taylor
608.8 120.5 93.0 75.2 67.2 42.1 11.5 199.3
Source: Ky Cancer Registry, cancer-rates.info/ky 2013-2017
It should also be noted that Kentucky has some of the highest cancer incidence rates in the country, so a lower rate in a Kentucky county may still be significantly higher than a rate that would actually be considered low. The U.S. age adjusted cancer rate was 449 per 100,000 persons, so all the counties in the service area were significantly higher than the U.S. rate.
Drug Arrest Rates According to city and county law enforcement officers, 75 to 80 percent of the crime in this community is drug-related; even assaults, burglary, and theft /larceny are often motivated by drug-seeking behavior. The service area has a higher rate of arrests for illegal drugs per thousand population than Kentucky as a whole. In fact, Taylor County has an arrest rate almost 58% higher than that of Kentucky.
15
