COMMUNITY HEALTH NEEDS ASSESSMENT 2022-2024 HARDIN 2019 Dem ographic Snapshot Area: BH Hardin Level of Geography: Secondary Service Area by ZIP Code DEMOGRAPHIC CHARACTERISTICS Selected Area
USA
2019
2024
Total Male Population
106,845
109,826
2.8%
215,706 329,236,175
Total Fem ale Population
108,861
111,989
2.9%
221,815 340,950,101
Fem ales, Child Bearing Age (14-44)
40,480
41,125
1.6%
2010 Total Population
308,745,538
2019 Total Population 2024 Total Population % Change 2019 - 2024
2.8%
Average Household Incom e
3.6%
$65,097
$89,646
POPULATION DISTRIBUTION
HOUSEHOLD INCOME DISTRIBUTION Age Distribution
Age Group
% Change
2019
% of Total
2024
% of Total
USA 2019 % of Total
2019 Household Incom e
0-13
37,005
17.2%
36,604
16.5%
18.6%
10,694
12.5%
14-20
19,885
9.2%
20,250
9.1%
3.9%
$15-25K
9,610
11.3%
9.1%
21-24
10,721
5.0%
11,625
5.2%
9.6%
$25-50K
21,318
25.0%
21.5%
25-34
25,656
11.9%
26,203
11.8%
13.5%
$50-75K
15,844
18.6%
16.9%
35-54
54,330
25.2%
52,029
23.5%
25.3%
$75-100K
11,016
12.9%
12.3%
55-64
30,586
14.2%
30,841
13.9%
12.9%
Over $100K
16,875
19.8%
29.7%
65+
37,523
17.4%
44,263
20.0%
16.2%
215,706
100.0%
221,815
100.0%
100.0%
Total
85,357
100.0%
100.0%
Total EDUCATION LEVEL
2019 Adult Education Level Less than High School
<$15K
Incom e Distribution USA HH Count % of Total % of Total 10.5%
RACE/ETHNICITY Education Level Distribution Pop Age USA 25+ % of Total % of Total
Race/Ethnicity
Race/Ethnicity Distribution USA 2019 Pop % of Total % of Total
9,625
6.4%
5.4%
White Non-Hispanic
202,683
92.7%
60.0%
Som e High School
14,432
9.6%
7.3%
Black Non-Hispanic
6,252
2.9%
12.4%
High School Degree
61,758
41.1%
27.3%
Hispanic
4,388
2.0%
18.4%
Som e College/Assoc. Degree
42,953
28.6%
29.0%
Asian & Pacific Is. Non-Hispanic
1,136
0.5%
5.9%
Bachelor's Degree or Greater
21,454
14.3%
31.0%
All Others
4,228
1.9%
3.3%
150,222
100.0%
100.0%
218,687
100.0%
100.0%
Total
Total
Source: Truven Health Analytics Service Area Defined: Breckinridge, Bullitt, Grayson, Green, Hart, Nelson, and Taylor Counties in Kentucky
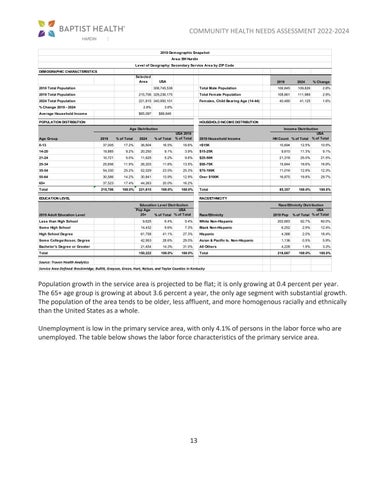
Population growth in the service area is projected to be flat; it is only growing at 0.4 percent per year. The 65+ age group is growing at about 3.6 percent a year, the only age segment with substantial growth. The population of the area tends to be older, less affluent, and more homogenous racially and ethnically than the United States as a whole. Unemployment is low in the primary service area, with only 4.1% of persons in the labor force who are unemployed. The table below shows the labor force characteristics of the primary service area.
13
