COMMUNITY HEALTH NEEDS ASSESSMENT 2022-2024 FLOYD
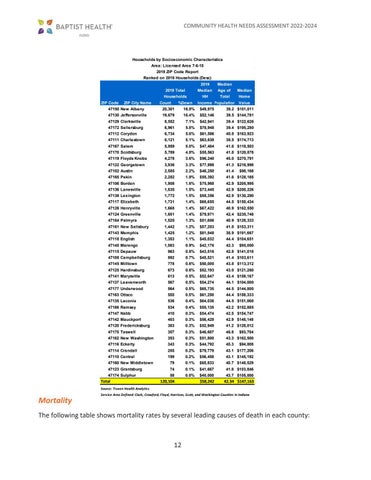
Households by Socioeconomic Characteristics Area: Licensed Area 7-6-15 2019 ZIP Code Report Ranked on 2019 Households (Desc)
ZIP Code
ZIP City Name
2019
Median
2019 Total
Median
Age of
Median
Households
HH
Total
Home
Count
%Down
Income Population Value
47150 New Albany
20,301
16.9%
$49,975
47130 Jeffersonville
19,679
16.4%
$52,146
39.5 $144,781
8,552
7.1%
$42,941
39.4 $122,626
47129 Clarksville
39.2 $151,011
47172 Sellersburg
6,961
5.8%
$78,948
39.4 $195,280
47112 Corydon
6,734
5.6%
$61,586
40.8 $163,923
47111 Charlestown
6,121
5.1%
$63,638
38.5 $174,713
47167 Salem
5,959
5.0%
$47,484
41.6 $118,503
47170 Scottsburg
5,789
4.8%
$55,563
41.8 $120,878
47119 Floyds Knobs
4,278
3.6%
$96,240
45.0 $270,791
47122 Georgetown
3,936
3.3%
$77,998
41.3 $216,998
47102 Austin
2,585
2.2%
$46,250
41.4
47165 Pekin
2,282
1.9%
$55,392
41.6 $128,165
$98,168
47106 Borden
1,908
1.6%
$75,968
42.9 $205,995
47136 Lanesville
1,835
1.5%
$73,445
42.9 $200,226
47138 Lexington
1,772
1.5%
$58,356
42.9 $130,290
47117 Elizabeth
1,731
1.4%
$66,655
44.5 $150,434
47126 Henryville
1,668
1.4%
$67,422
40.9 $162,550
47124 Greenville
1,651
1.4%
$79,971
42.4 $235,748
47164 Palmyra
1,520
1.3%
$51,606
40.9 $128,333
47161 New Salisbury
1,442
1.2%
$57,203
41.8 $153,311
47143 Memphis
1,425
1.2%
$81,548
38.9 $191,667
47118 English
1,353
1.1%
$45,032
44.4 $104,651
47140 Marengo
1,083
0.9%
$42,176
42.3
963
0.8%
$43,516
42.8 $141,018
47115 Depauw
$95,000
47108 Campbellsburg
892
0.7%
$45,521
41.4 $103,611
47145 Milltown
778
0.6%
$50,000
43.8 $113,312
47125 Hardinsburg
673
0.6%
$52,193
43.0 $121,260
47141 Marysville
613
0.5%
$52,647
43.4 $159,167
47137 Leavenworth
567
0.5%
$54,274
44.1 $104,000
47177 Underwood
564
0.5%
$65,735
44.5 $144,800
47163 Otisco
555
0.5%
$61,250
44.4 $158,333
47135 Laconia
536
0.4%
$64,038
44.5 $151,068
47166 Ramsey
534
0.4%
$55,135
42.2 $152,885
47147 Nabb
410
0.3%
$54,474
42.5 $154,747
47142 Mauckport
403
0.3%
$56,429
42.9 $148,148
47120 Fredericksburg
383
0.3%
$52,949
41.2 $128,012
47175 Taswell
357
0.3%
$46,607
46.8
47162 New Washington
353
0.3%
$51,800
43.3 $162,500
47116 Eckerty
343
0.3%
$44,792
45.3
47114 Crandall
205
0.2%
$79,779
43.1 $177,206
47110 Central
199
0.2%
$56,458
43.1 $145,192
79
0.1%
$65,833
40.7 $148,529
47160 New Middletown
$93,704 $94,808
47123 Grantsburg
74
0.1%
$41,667
41.8 $103,846
47174 Sulphur
58
0.0%
$40,000
43.7 $105,000
Total
120,104
$58,242
42.34 $147,163
Source: Truven Health Analytics
Mortality
Service Area Defined: Clark, Crawford, Floyd, Harrison, Scott, and Washington Counties in Indiana
The following table shows mortality rates by several leading causes of death in each county:
12


