
By Matthew Ball
The State of Video Gaming in 2025
January 2025
Last Updated: 2 November 2025 The most up -to-date version of this PDF can always be found here

A Rough Three Years and the End of the 2011 –2021 Growth Wave [Pages 3 – 27]
The Mobile Marketplace in 2025 [28 – 44]
A (Brief) Review of AR/VR Forecasts and Disappointments [45 – 49]
How Much (and Where) Console/PC Has Grown [50 – 66]
The Relevance of China (and Other Emerging Markets) [67 – 81]
The Hostility of the Modern Console/PC Content Marketplace [82 – 130]
How Player, Playtime, and Player Spend Might Return to Growth [131 – 230]
From 2011 to 2021, video gaming soared. Spending grew at over 2x the rate of the preceding 20 years, with annual revenues up 150% overall (from ~$79B to $196B)
Worldwide Consumer Spending on Video Game Content
(Nominal Prices; Arcade + Console + PC + Mobile + VR + Web; Excludes Hardware & Accessories; Excludes Web3/NFT)

Sources: Pelham Smithers / Bloomberg, IDG, Ampere, Epyllion analysis
Gaming’s 2011 to 2021 growth didn’t just beat its historical averages, it significantly outpaced global growth benchmarks (e.g. 3.3x the rate of world real GDP)
Though a few anticipated a slowdown or even a pullback after COVID, most expected that gaming’s growth would continue at high rates — if not accelerate Sources: Pelham Smithers / Bloomberg, IDG, Ampere, ARK, Bain, Google, E&Y, Epyllion analysis
Worldwide Consumer Spending on Video Game Content, Plus Select External Forecasts For Growth 1 (Nominal Prices; Arcade + Console + PC + Mobile + VR + Web; Excludes Hardware & Accessories; Excludes Web3/NFT)
Instead, spend fell by ~3.5% in 2022, then barely grew in 2023 & 2024, finishing flat over 3 years — and thus billions of player hours and dollars short of forecasts Sources: Pelham Smithers / Bloomberg, IDG, Ampere, ARK, Bain, Google, E&Y, Epyllion analysis
Worldwide Consumer Spending on Video Game Content, Plus Select External Forecasts For Growth 1 (Nominal Prices; Arcade + Console + PC + Mobile + VR + Web; Excludes Hardware & Accessories; Excludes Web3/NFT)
Had decade -long growth rates just halved, then 2022 would have grown +$9.3B in annual revenue, 2023 another $9.8B (+$19B v. actual), 2024 another $10.2B (+$29B)
Worldwide Consumer Spending on Video Game Content (Nominal Prices; Arcade + Console + PC + Mobile + VR + Web; Excludes Hardware & Accessories; Excludes Web3/NFT)
The decline also occurred despite the end of console/GPU shortages in mid -2022, and in 2023, arguably the best content release slate in the industry’s 70 -year history


A post -pandemic pullback is an insufficient explanation for gaming’s contraction and stall. Spending on books, music, and video (esp. digital) continued to grow
Consumer Spend on Books (Worldwide; Nominal Prices)
Consumer Spend on Recorded Music (Worldwide; Nominal Prices)
Consumer Spend on Digital Video (Worldwide; Nominal Prices)
And so not only does the video gaming industry now fall short of global growth benchmarks, it’s actually shrinking in real terms — down roughly 12% since 2021
Video Game Content 1 Real Spend
In the U.S., active players are now below pre -pandemic levels. Average playtime per player is up, but mostly because lower engagement players no longer play
Share of U.S. Population That Regularly Plays Video Games
Avg. Weekly Video Game Play Hours Among U.S. Gamers (Hours, PC + Console + Mobile + VR + Web)
The shortfall of players, dollars, and hours versus forecasts (and even vs. 2021) is partly behind the unprecedented number of commercial disappointments/flops


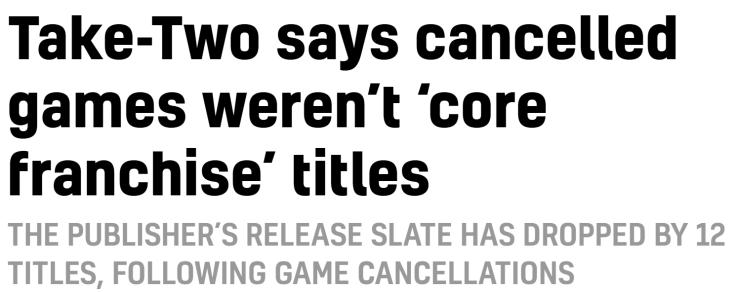
Rising failure rates have also led gamemakers to cancel scores of in -production titles, having lost faith in the business cases they had approved only a few years ago


VCs, seeing no growth and few breakouts, retreated. Content funding is down 77% vs. H2’21 –H1’22 and back to 2018 –19 levels (even though spend is up 34% or $51B!)
Worldwide VC Funding In Video Gaming Content Development Studios/Publishers by Quarter
(Nominal Prices; Excludes Investments In Video Game -Related Technology and Delivery Companies)
Many of the independent studios founded since 2019 are now closing because they can’t find the VC or publisher funding needed to finish their games


Employees have been hit hard, suffering back -to -back -to -back record layoffs. Layoffs might help short -term margins, but they won’t restore industry growth
Annual Gross Reported Layoffs in the Video Game Industry
(Excludes Unreported Layoffs and Layoffs Where the Approximate Headcount Is Not Known; Not Net of Hiring)
And what gamemakers need is growth. Gaming stocks have underperformed the market by 19 –140% since 2020; most have lost 10 –80% of value outright
And behind the headline layoffs there is still meaningful hiring for growth. Most top publishers have more employees in 2025 than in 2022 — even net of acquisitions
Time of Annual Reports)
So, What’s Going On?
No industry has a “right” to grow several times faster than global real GDP — let alone for a decade. Gaming achieved it through several concurrent growth engines
These several growth engines grew the video gaming industry’s players + playtime + spend, while strengthening network effects and often amplifying one another
Billions of new players & new hours per day to play
Reduced barriers to playing; expanded games’ social graphs; unlocked “whale monetization”
Lifted engagement and the monetization ceiling for all games — especially the biggest
Expanded every multiplayer game’s social graph (and thus appeal, playtime, and spend)
Brand new monetization model that increased the paying share of FTP gamers and encouraged more player spend
Most popular experiences of all time
Led “non -gamers” to take up video gaming to connect with friends/family
YouTube, Discord, Twitch created a new “meta -layer” that enriched gaming , aided game discovery, and strengthened social play
Highest -grossing game genre in history; most popular AAA genre in history; expanded cultural appeal/range of games
Helped normalized video gaming; aided game discovery; “pulled forward” revenues
Nearly all of the top games of the last 15 years took advantage of multiple growth engines simultaneously (if they didn’t pioneer them in the first place)


Yet the old growth engines are mostly exhausted. There are few high -value mobile players left to add, no new playtime to find, few games to add battle passes, etc.
And the many would -be growth engines have yet to drive real revenue or player growth — let alone generate new market leaders
Subscrip -tions
AR, VR, and LBE
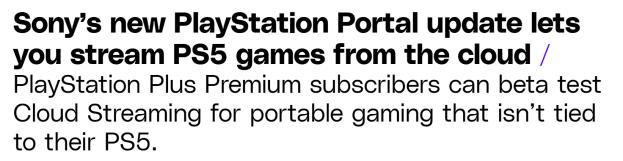
Cloud Gaming New Game Genres
Game + Esports Betting Crypto, Web3, NFTs Esports
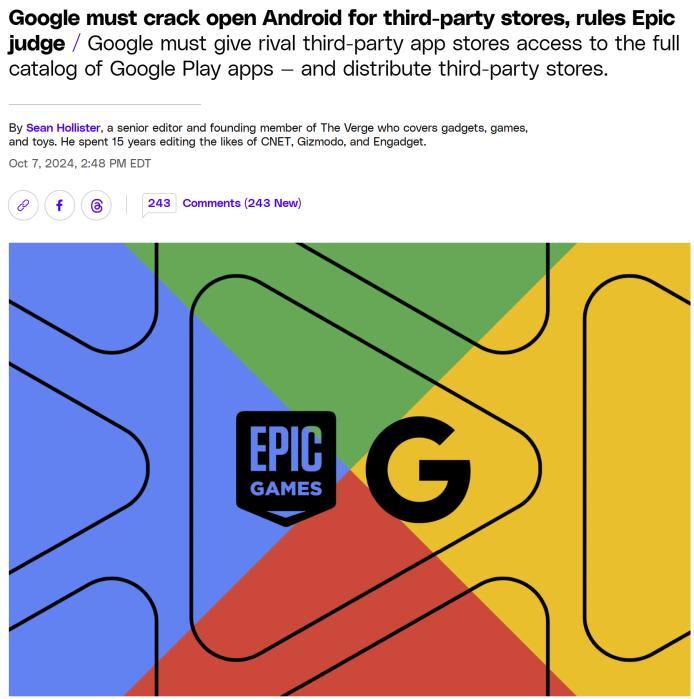
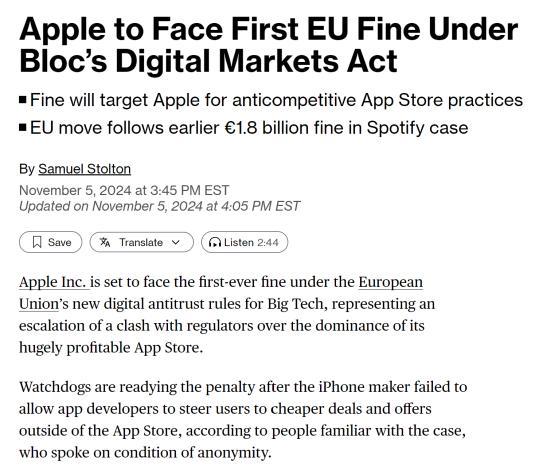
App Store Regulation
With video gaming’s growth engines slowing, it’s less surprising that participation, engagement, and spend are all waning. The 2011 –2021 era is getting old.
Share of U.S. Who Regularly Games (Ages 2+)
Weekly Playtime Among U.S. Gamers (Hours)
Monthly Spend Among U.S. Gamers (Nominal Prices)
Meanwhile, the industry is facing many new challenges — all while the old challenges have intensified
Growth in Foreign Developers
ATT, IDFA, & GAID Worsening Discovery Rise of Social Video ForeignFocused Growth Rising User Acquisition Costs Stagnant Console Install Bases End of Mobile User Growth Fear of Failure Rates Deflationary Pricing Reductions in Game Sampling Rising Development Costs Lengthening Production Timelines
“Black Hole” Games
Closed App Stores
A Rough Three Years and the End of the 2011 –2021 Growth Wave
The Mobile Marketplace in 2025
A (Brief) Review of AR/VR Forecasts and Disappointments
How Much (and Where) Console/PC Has Grown
The Relevance of China (and Other Emerging Markets)
The Hostility of the Modern Console/PC Content Marketplace
How Player, Playtime, and Player Spend Might Return to Growth
Gaming’s growth is driven by mobile’s growth — the form factor is over 70% of new spend since 2011 and is now 59% of the total market, up from 32%
Share of Growth in Worldwide Consumer Spending on Video Game Content Since 2011
(Nominal Prices; Arcade + Console + PC + Mobile + VR + Web; Excludes Hardware & Accessories; Excludes Web3/NFT)
The iPhone led to billions of new players and hours. But after 18 years, growth now relies on population growth and smartphone adoption in (very) low ARPU markets
6B Over Age 10
4.4B w/ Smartphones
Mobile Gamers
(68% of smartphone owners; 50% of those over age 10)

And though smartphone users and mobile gaming spend have both tripled since 2014 (1.5B to 4.5B, $35B to $105B), the number of mobile games is at a decade low
Number of Unique Mobile Games in the iOS App Store
(Worldwide; Had to Generate Any Revenue or Downloads in Year)
Behind shrinking mobile catalogues is not just annual de -listings, but a consistent trend of fewer and fewer and fewer new titles launching; success is too elusive
Annual Changes in Mobile Games on the iOS App Store
(Worldwide; Games that Generated No Revenue or Downloads in Year Counted as Delisted)
And social video is eating leisure time: just in the U.S., adults spend 35MM more hours a day watching TikTok than in H2’20/H1’21 (peak of mobile gaming spend)
Daily Hours of TikTok Use Among All U.S. Adults
TikTok’s growth hasn’t come from other social video platforms. Total consumption among U.S. adults is up 100MM hours a day since 2020/21 (or 23 mins/person/day)
Daily Hours of Use Among All U.S. Adults
Apple’s IDFA created a new vicious cycle: install down + costs up >> player time, spend, ad revenue fall >> UA is even costlier >> install volumes go down more, etc.
U.S. Mobile Game Downloads by Quarter
First quarter of Apple’s IDFA and Google’s GAID Deprecation
Altogether, mobile gaming has lost 2.6 percentage points of its share of all digital media time among U.S. adults since 2020 (a ~17% drop in share)
Mobile Gaming’s Share of Digital Media Time Among U.S. Adults
After three years, global mobile gaming spending remains down 8% from its peak (real spending is down 23%). The competitive consequences are even greater…
Worldwide Mobile Game Revenues by Quarter
(Sensor Tower Measured Markets and Platforms)
With discovery, downloads, and revenues stagnated, competition further ossified.
The top 3 titles in the U.S. by genre hold 40% of spend; titles 2+ years old are 70%
Share of U.S. Mobile Game Revenues by Title
and Rank (2023)
Share of U.S. Mobile Game Revenues by Title Genre and Age (2023)
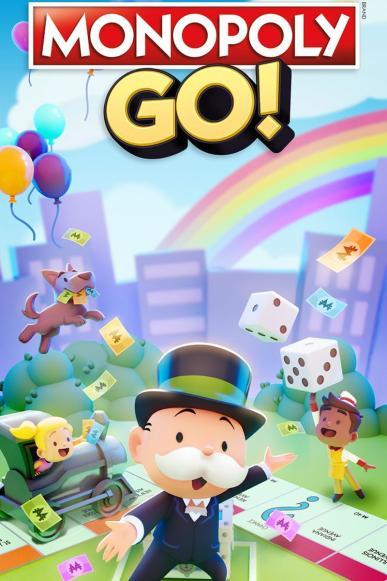
Consider that the biggest new game since 2020, Monopoly Go!, hit $5B in bookings in 2 years — but also spent ~$1.25B on user acquisition (or 36% of net revenue)
Estimated P&L For Monopoly Go During Its First Two Years (Worldwide)
Even Call of Duty is struggling to launch new mobile titles. 2024’s Warzone has only 30% of the downloads of 2019’s Mobile after 9 months — and 5% of the spend
Worldwide Downloads in First 9 Months After Launch (Sensor Tower Measured Markets and Platforms)


Worldwide Revenue in First 9 Months After Launch (Sensor Tower Measured Markets and Platforms)

Fortunately, part of Call of Duty: Warzone ’s challenge is that Mobile is still thriving.
Yet this exemplifies the stickiness of aged titles versus newer, “better” substitutes
Worldwide Downloads Over Nine Months (Sensor Tower Measured Markets and Platforms)
Worldwide Revenue Over Nine Months (Sensor Tower Measured Markets and Platforms)
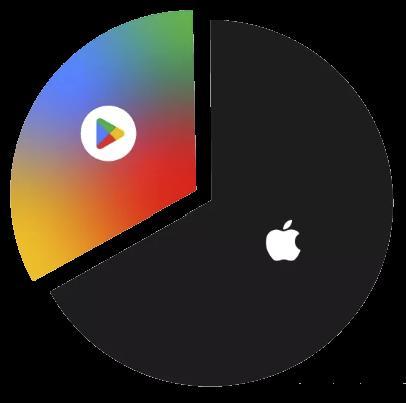
Given mobile gaming’s overall stall, app stores, which net ~$24B per year from mobile game developers, face renewed scrutiny over their commissions and policies
Total Worldwide App Store Revenue from Video Game Commissions (Nominal Prices; Revenue Typically Estimated at 75 –85% Profit Margins)
Take Roblox, the top mobile game ever. For every $100 in player spend, Roblox pays app stores $22 (a sum that’s nearly all profit for Apple/Google) and loses $35
Roblox Quarterly Payments to App Stores and Losses (Blended / Based on Revenues from All Platforms)
Indeed, Apple and Google likely net more in profit from mobile game sales than all (non -China) mobile and non -mobile publishers and platforms combined
2023 App Store Commissions from Mobile Games vs. Operating Income of Top 30 (Non -China) Video Game Publishers + Platforms (2023; Nominal Prices; Adjusted for Impairment Charges and Other Extraordinary Events)
A Rough Three Years and the End of the 2011 –2021 Growth Wave
The Mobile Marketplace in 2025
A (Brief) Review of AR/VR Forecasts and Disappointments
How Much (and Where) Console/PC Has Grown
The Relevance of China (and Other Emerging Markets)
The Hostility of the Modern Console/PC Content Marketplace
How Player, Playtime, and Player Spend Might Return to Growth
Annual AR/VR content spend is up from $0 in 2011 to about $1B today, but this sum remains too small (and stagnant) to attract much gamemaker investment Sources: Pelham Smithers / Bloomberg, IDG, Ampere, Epyllion analysis
Share of Growth in Worldwide Consumer Spending on Video Game Content Since 2011
(Nominal Prices; Arcade + Console + PC + Mobile + VR + Web; Excludes Hardware & Accessories; Excludes Web3/NFT)
And though AR/VR devices have improved substantially in performance and form factor, sales are down -to -flat (especially after accounting for periodic upgrades)
Annual AR/VR Headset Shipments, Actuals and Forecasts by Year (Worldwide)
Screenless (Excluding Viewers such as Cardboard)
Tethered or Standalone
AR/VR sales are also way behind forecasts. IDC now estimates 6.5MM headsets sold in 2025. Only a few years ago, IDC predicted 6 -7MM per quarter (if not month )
Annual AR/VR Headset Shipments According to IDC, Actuals and Forecasts by Year (Worldwide ; Including MR and XR ; As of 7 April 2025)
(April 2016)
(December 2016)
(March 2017) (March 2019)
(March 2018)
(March 2020)
Actuals (Screenless, Excl. Viewers such as Cardboard)
Actuals (Tethered or Standalone)
Multi -Year Combined Forecast (Date of Forecast)
(March 2022)
(March 2021) (March 2023)
(Sept 2020)
(March 2024) (Sept 2024)
(Dec 2024)
(March 2025)
Though focused on building a general -purpose computing platforms (vs a gaming console), Meta’s Reality Labs has now spent ~$85B on AR/VR, with ~$7 4B in losses
A Rough Three Years and the End of the 2011 –2021 Growth Wave
The Mobile Marketplace in 2025
A (Brief) Review of AR/VR Forecasts and Disappointments
How Much (and Where) Console/PC Has Grown
The Relevance of China (and Other Emerging Markets)
The Hostility of the Modern Console/PC Content Marketplace
How Player, Playtime, and Player Spend Might Return to Growth
The billions spent on each console generation on R&D, subsidies, content, etc., do seem to be growing penetration. Gen 8 outsold Gen 6 by over 50%
Worldwide Console Sales by Platform by Generation
(Not Deduplicated; Includes Replacement Devices and Mid -Cycle Upgrades; As of 15 January 2025)
And total console content spend is also $16B higher in 2024 than it was in 2011, a roughly 65% increase
Share of Growth in Worldwide Consumer Spending on Video Game Content Since 2011
(Nominal Prices; Arcade + Console + PC + Mobile + VR + Web; Excludes Hardware & Accessories; Excludes Web3/NFT)
Sources: Pelham Smithers / Bloomberg, IDG, Ampere, Epyllion analysis
Yet all Gen 7+8 growth is Nintendo. Gen 7+8 sales were also boosted by a lengthier cycle (more replacements + household growth) and Gen 8 from mid -gen upgrades
Worldwide Console Sales by Platform by Generation
(Not Deduplicated; Includes Replacement Devices and Mid -Cycle Upgrades; As of 20 May 2025)
And even with more upgrades and replacement buys, American and European console sales are ~flat versus a decade ago. Only Japan and ROW materially grew
Regional Console Sales by Platform by Generation
(Not Deduplicated; Includes Replacement Devices and Mid -Cycle Upgrades; As of 20 May 2025)
… And all Gen 8 growth in Japan was Nintendo, so too nearly all Gen 7 –9 growth in ROW, and PlayStation + Xbox are down in America, Europe, and Japan vs. Gen 6
Regional Console Sales by Platform by Generation
(Not Deduplicated; Includes Replacement Devices and Mid -Cycle Upgrades; As of 20 May 2025)
Sources: Microsoft, Nintendo, Sega, Sony, VGChartz , Entertainment Software Association,
And Switch mostly benefits Nintendo. Switch users buy 25 –33% fewer games than PS/Xbox owners, and over half of sales are Nintendo’s games (vs. 10% on PS/Xbox)
Proportion of Gross Software (“Content”) Sales on the Nintendo Switch that are 1st -Party (i.e. Nintendo) Titles
(By Fiscal Year)
Switch’s extraordinary sales are, for the most part, not from net new players but from the cannibalization of two console form factors ( livingroom and handheld)
Nintendo Annual Software Unit Sales by Platform Type (Worldwide)
The decline of handheld revenues ( −$9B since 2011) also offsets roughly 60% of livingroom growth ($16B). Combined console is up a more modest $7B, or 20%
Share of Growth in Worldwide Consumer Spending on Video Game Content Since 2011
(Nominal Prices; Arcade + Console + PC + Mobile + VR + Web; Excludes Hardware & Accessories; Excludes Web3/NFT)
Net Sales Delta of Generation 9 Platform Console Sales Compared to Generation 8 by Month Since Release (Worldwide)
And while Switch 2 is a likely mega -hit, Gen 9 PlayStation & Xbox sales are both down versus Gen 8 after 50 months — now a combined 8.5MM shortfall (or -7.5%) Sources:
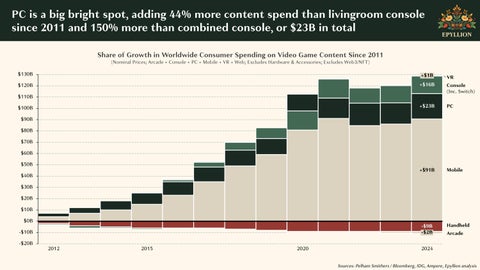
PC is a big bright spot, adding 44% more content spend than livingroom console since 2011 and 150% more than combined console, or $23B in total
Share of Growth in Worldwide Consumer Spending on Video Game Content Since 2011
(Nominal Prices; Arcade + Console + PC + Mobile + VR + Web; Excludes Hardware & Accessories; Excludes Web3/NFT)
Over the last twenty years, PC’s share of non -mobile content spending has grown from 29% to 51%. Since 2021, console is down 3 % but PC is up 12%
Worldwide Non -Mobile Video Game Content Spend (Excludes Web3/NFT)
The PC ecosystem benefits from many compounding advantages over the console ecosystem — and its momentum is still growing
Existing PC Advantages
Much larger library than any one console (or all consoles combined), and with near full backwards compatibility
Intensifying PC Advantages
More annual game releases (thus a compounding library advantage)
Much larger social graph than any one console (and often reaching into consoles)
PlayStation now releases its “exclusives” on PC (albeit in second window), as Xbox now does with all titles
Ability to multi -task (e.g. Alt -Tab to YouTube for tips and tricks, read Game Guides, use WhatsApp, etc.), run full Discord natively, livestream with full OBS/editing suites, etc.
Premium Roblox games can only be bought on PC
Lower entry price point than consoles and higher top -range of performance than high -performance consoles
Hundreds of millions of children growing up on Roblox are unlikely to ask for a $500 console to play AAA games
Greater competitive capability (i.e. keyboard/mouse)
Ability to play nearly every Early Access title in “Early Access”
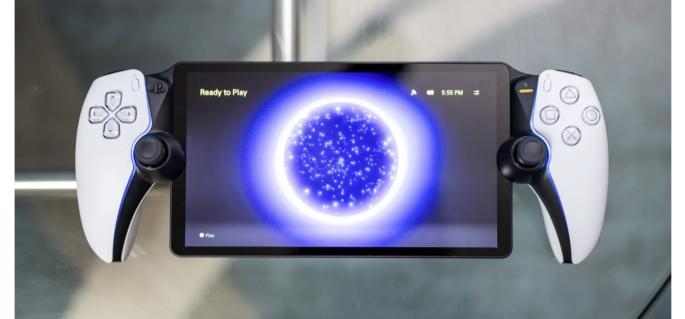
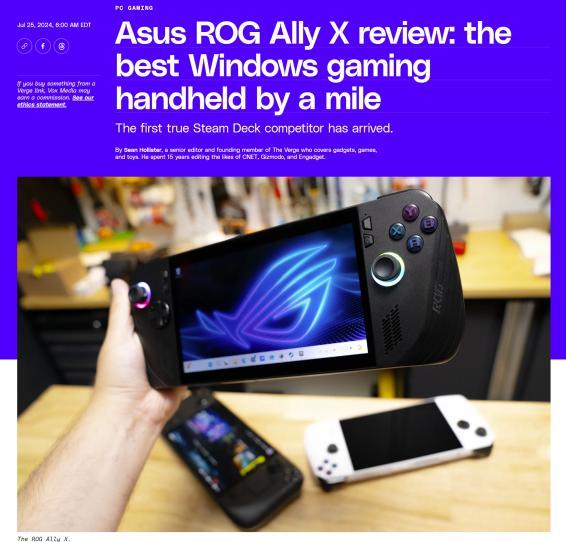
Portable Windows -based gaming devices are growing in popularity and have access to full Steam/PC catalogues and entitlements
Even with the 2021 to 2024 stall, Console/PC spend grew 3.5% annually — short of mobile’s 12.5%, which was powered by billions of new players — but still healthy
Worldwide Consumer Spending on Video Game Content
(Nominal Prices; Arcade
But Steam’s consolidation of the PC gamers provides insight into who is driving the category growth. In 2024, Steam’s APAC MAU exceeds its total MAU in 2017
Monthly Active Users By Client Language 1 (Worldwide; Based on Trailing 90 Days)
The largest share of Steam users now use Chinese as their default client language (which probably underrepresents China’s total share of Steam users)
Top Two User Languages on Steam 1 (Worldwide ; Trailing 90 Days)
CCUs affirm APAC’s role in Steam user growth: CCUs peak when America sleeps and China gets home and bottom when America is off work but China is at work
Steam Concurrent Users (CCUs) by 10 -Minute Intervals from 5 December 2024 to 12 December 2024 (Worldwide ; GMT Dateline)
3PM-11PM
11PM -7AM
7AM-3PM
A Rough Three Years and the End of the 2011 –2021 Growth Wave
The Mobile Marketplace in 2025
A (Brief) Review of AR/VR Forecasts and Disappointments
How Much (and Where) Console/PC Has Grown
The Relevance of China (and Other Emerging Markets)
The Hostility of the Modern Console/PC Content Marketplace
How Player, Playtime, and Player Spend Might Return to Growth
Since 2011, consumer video game spend in China has grown by $39B — roughly a third of global growth (and to 22% of the total market)
Consumer Spending on Video Game Content in China
(Nominal Prices; Arcade + Console + PC + Mobile + VR + Web; Excludes Hardware & Accessories; Excludes Web3/NFT)
Consistent with worldwide contraction, exacerbated by regulatory action and 4% RMB:USD decline
But only 20% of China’s domestic spend goes to foreign titles (many of which are banned). Total spend is up 50% since 2017 alone, yet imported spend is down 5%
China Spend on Video Game Content by Country of Origin
(USD; Console + PC + Mobile + VR + Web; Excludes Hardware, Excludes Web3/NFT)
China -Made Games’ Share of China Video Game Content Spend
(Console + PC + Mobile + VR + Web; Excludes Hardware, Excludes Web3/NFT)
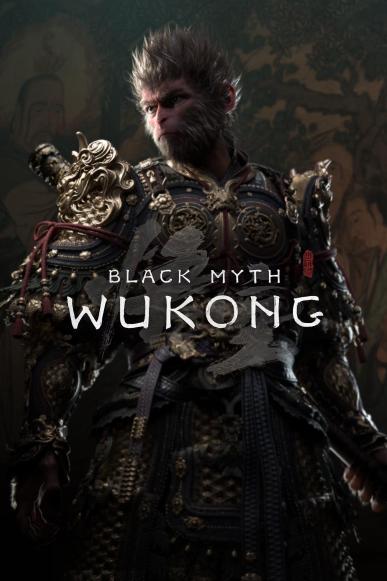
And AAA games from China and for China are now achieving sales figures in China that challenge the worldwide sales of the most acclaimed Western AAA titles
Unit Sales for Major 1P AAA Titles
(Worldwide)

Black Myth: Wukong , made by Chinese developer Game Science, is based on the 16th -century Chinese folktale of the Monkey King Wukong , and is set in a world of gods from the Chinese pantheon, intermixed with famous realworld Chinese landmarks and locations.

▪ Winner: Best Action Game
▪ Winner: Game of the Year (Players’ Voice)
▪ Nominee: Game of the Year
▪ Nominee: Best Direction
▪ Nominee: Best Art Direction


▪ Nominee 1: Best Design
▪ Nominee 1: Innovation Award
▪ Nominee 1: Best Narrative
▪ Nominee 1: Best Technology
▪ Nominee 1: Best Visual Art
▪ Nominee 1: Game of the Year
▪ Winner: Outstanding Art Direction
▪ Nominee 1: Game of the Year
▪ Nominee 1: Action Game of the Year

▪ Winner: Game of the Year
▪ Winner: Best Visual Design

▪ Winner: Grand Award (“GOTY”
▪ Winner: Best Visual Design


▪ Winner: Game of the Year
▪ Winner: Best Game You Suck At
▪ Winner: Best Story -Rich Game
Sources: Sony, Nintendo, FromSoftware, Larian , Epyllion analysis
China’s exports are soaring, too. Genshin is one of few titles to gross over $9B — almost half was outside China; Marvel Rivals is one of the biggest releases in years
Consumer Spend on Genshin Impact
(Worldwide through September 2024)
Debut Avg. Steam CCUs, Select FTP Multiplayer Titles
(Does not reflect all players, only Steam players, which has an unequal effect per title)


Altogether, China’s developers have grown their share of non -China content spend from 0.5% to 12.5% in 13 years, or from $360MM a year to $19B
Total Video Game Content Spending Outside of China
(USD; Console + PC + Mobile + VR + Web; Excludes Hardware, Excludes Web3/NFT)
Developed in China
Developed Outside of China
Chinese Video Games’ Share of Non -China Content Spend (USD; Console + PC + Mobile + VR + Web; Excludes Hardware, Excludes Web3/NFT)
In total, 42% of worldwide consumer spending growth since 2011 went to Chinese developers (split 2:1 on domestic spend on Chinese titles v. exports of them)
Breakdown of Worldwide Net Growth in Consumer Content Spending on Video Games Since 2011 (Nominal Prices; Arcade + Console + PC + Mobile + VR + Web; Excludes Hardware & Accessories; Excludes Web3/NFT)
Non-China Spend on Chinese Games
China Spend on Domestic Games
Non-China Spend on Non -Chinese Games
China Spend on Imported Games
Sources: China Audio -Video and Digital Publishing Association, Pelham Smithers / Bloomberg, IDG, Ampere, Epyllion analysis
And so total growth for non -Chinese developers since 2011 is less than headlines suggest. The market grew $118B (+150%) total, but $68B (+90%) for Western Devs
Worldwide Consumer Spending on Video Game Content
(Nominal Prices; Arcade + Console + PC + Mobile + VR + Web; Excludes Hardware & Accessories; Excludes Web3/NFT)
And while China is the largest, most mature, and regulated non -Western market, it’s no outlier. The most played AAA titles worldwide are Korean and Singaporean
Total Peak DAUs for Select AAA Franchises (Worldwide)


These non -Western titles thrive partly by focusing on lower device specifications, but also by investing in and prioritizing different cultural events and tones


As foreign markets grow, their domestic production capabilities and supply grow, too, and this always results in national preferences then shifting to local product
The films that now top the Chinese box office are not just “made in China” — they are fundamentally of China and for Chinese audiences
Wandering Earth (2019, $700MM)

A Rambo -style action film in which the muscled and jaded Chinese hero rescues Africa from American imperialism and bioterror. The bad guy is played by New York –born Frank Grillo (previously an evil mercenary in Captain America) and is scolded by the hero for America’s role in the slave trade. The hero also announces Chinese frailty to be a thing of the past, while asserting its role as global protector

A metaphor for climate change in which Chinese scientists leading the nations of the world — with the notable absence of the U.S. to save the planet , which will soon be engulfed by the sun. The film takes the virtues of collectivism as selfevident and is sharply critical of selfishness.
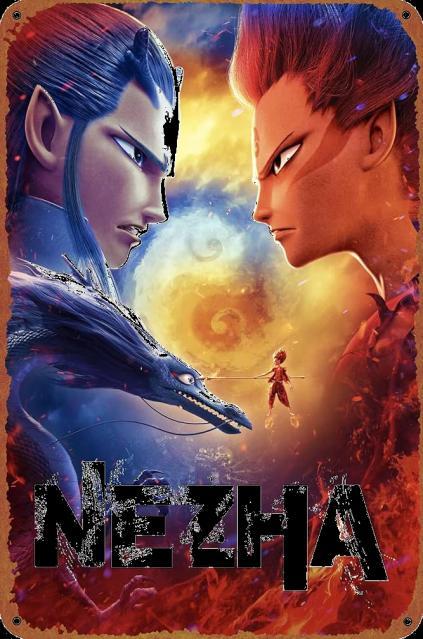
A family -oriented film that resembles animated Disney hits, particularly Frozen . Like Wukong , Ne Zha focuses on 16th -century Chinese folklore about a mischievous but misunderstood boy born from a powerful spirit pearl. Ne Zha is a rousing story in the shenmo (gods and demons) genre, with humor that is decidedly non -Western
As Nollywood has developed, Nigerian -made films (including those released during COVID!) toppled former chart toppers like Avengers: Endgame and Avatar
A Tribe Called Judah

Wedding Party

Classic “romcom” focused on the extravagant and chaotic wedding of Dunni and Dozie as they navigate meddling families, uninvited exes, and unexpected drama. Centers on Jedidah Judah, a single mother of five sons from different fathers and tribes. Facing financial strain due to her chronic kidney disease, her sons plan a heist to fund her treatment, leading to unforeseen complications.
Omo Ghetto 2: The

A gangster comedy that focuses on a tough ghetto leader caught between her gangster crew and her affluent family. Chaos ensues when a heist goes wrong, putting Lefty (the protagonist) in -between law enforcement and rival gangs, while forcing her to confront her comple x identity and loyalties.
India has always had a strong domestic film industry. As a result, only 3 of the 50 highest -grossing films of all time come from outside Bollywood
Top 50 Highest -Ever Grossing Films at the Indian Box Office by Home Market (Crore; Inflation Adjusted to 2024 Prices; All Films from 2013 to 2024)
Southeast Asia
Asia
Middle East & Northern Africa
Consumer Spending on Video Game Content in Major Foreign Markets and Regions
(Nominal Prices; Arcade + Console + PC + Mobile + VR + Web; Excludes Hardware & Accessories; Excludes Web3/NFT)
And so, as Console/PC continue to grow primary through APAC/ROW, there will be more Garenas , Game Sciences, MiHoYos — and they’ll take share in the West, too Sources: China Audio -Video and Digital Publishing Association, Newzoo , Capcom, Niko Partners, Research &
A Rough Three Years and the End of the 2011 –2021 Growth Wave
The Mobile Marketplace in 2025
A (Brief) Review of AR/VR Forecasts and Disappointments
How Much (and Where) Console/PC Has Grown
The Relevance of China (and Other Emerging Markets)
The Hostility of the Modern Console/PC Content Marketplace
How Player, Playtime, and Player Spend Might Return to Growth
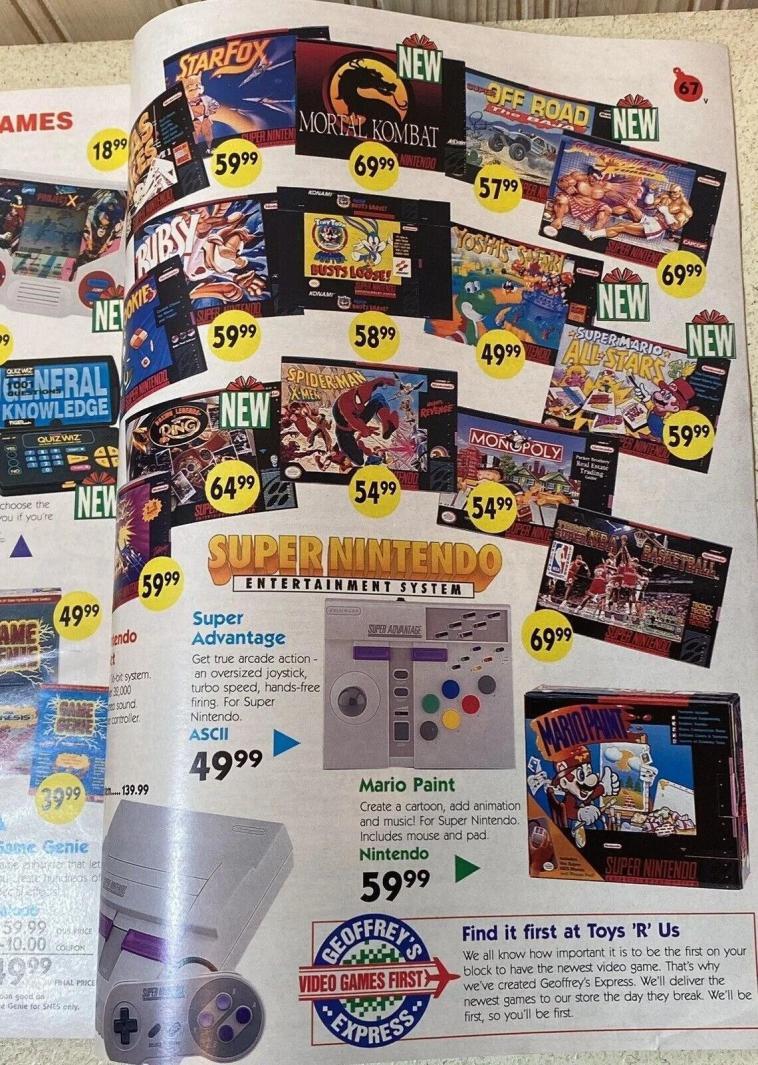
Without many new players, Console/PC growth relies on pricing — yet publishers struggle to keep them. Each decade, packaged prices fall 10 –20% in real terms
In 1992, Mortal Kombat, NBA, and Street Fighter each cost $70, Mario Paint $60, Spider -Man and Monopoly $55. In 2024 prices, they would be $157, $134, and $123
1992 U.S. Toys ‘R’ Us Ad with Nominal and Inflation -Adjusted Prices
In nearly all media categories, consumers expect (and digest) annual inflation adjustments. Several categories have massively increased real pricing over time
Packaged prices matter less given DLC/MTX/Live Services, which raise the spend ceiling. Yet real spending has grown only modestly despite these innovations
Worldwide Consumer Real Spending on Video Game Content
(2024 Prices; Arcade + Console + PC + Mobile + VR + Web; Excludes Hardware & Accessories; Excludes Web3/NFT)
Dota 2 “Compendium” Battle Pass Xbox Live
Elder Scrolls IV Horse Armor DLC
There are a few explanations for video gaming’s inability to maintain inflationadjusted prices, let alone grow them — and many are unique to the category
Challenge #1: Anchored Expectations
After forty years with $10 increases every other generation (~15 years), game prices (and customer expectations for them) are quite “sticky” and heavily scrutinized.
Challenge #2: Grey Market & Piracy
Publishers lose billions annually in private game trades, sales, and piracy – and know that any price hike on packaged sales will spark more of this behavior, thereby cannibalizing the benefit of the price hike
Challenge #3: Free -to -Play Dynamics
Challenge #4: Maximizing DLC Funnels
The most popular and profitable games globally are typically free -to-play. This makes it difficult for rival games to push up pricing, while reducing the incentives of the market leaders (which have the most pricing power) to do the same. FTP also constrains consumer perceptions on what a great game should cost
DLC tends to have far better economics than the “base game,” but requires upfront sales first. As such, publishers are reluctant to hike the “base games” price. Yet the price of DLC, which tends to offer fewer player hours than the base game, is also affected by the price of the base game
Challenge #5: Sale -Only Buyers
Reports suggest that between 33 -50% AAA gamers (skewing to PC gamers) wait until games are on sale before purchasing, offsetting the benefit of price increases and constraining value perceptions
Challenge #6: Strategic Underpricing
While movies, albums, books, TV series, et al, do not have variable pricing by title or budget, many games do release at $20 -50 (versus $60 -70) to help drive sales, which again constrains the size of the market
The AA/AAA segment’s player, playtime, and pricing struggles are a surprise . Who wouldn’t have bet on high -fidelity gaming if they’d seen the games of 2024 in 1994?


WATCH: https://www.youtube.com/watch?v=WU0gvPcc3jQ or https://tinyurl.com/StateofVideoGaming2025 -Matrix
Unfortunately, improvements in game fidelity, scale, and capability have led to a massive increase in the resources required to build such a game
Avg. Filesize per AAA Open World Action Game (GB)
Avg. Credits per AAA Open World Action Game (Does Not Include Uncredited Staff or Support)
Franchises that cost $50 million per title only 15 years ago, now run $200 –$500 million or more to develop — and costs are still growing
U.S. Federal Funds Effective Rate (Monthly Average)
What else has grown far faster than gamers or spend? The supply of games. In 2024, Steam released nearly as many games per month as it did in 2014 overall
Steam Game Releases by Year (Released in At Least One Market)
And new releases compete not just against other new releases, but nearly all of the 100,000+ games ever released — a sum that has doubled in the last four years
In total, industry -wide content development spend has surged 90% since 2017 — 1.6x the rate of consumer spend growth (and 2.1x that of Console/PC)
Total Video Game Content Development Spend (Worldwide)
Consumer Spend Begins to Decline/Stall
Downstream (Localization, Player Support)
Midstream (Functional Testing, Audio Development)
Upstream (Art & Animation, Game Engineering, Coding, and Design)
With higher budgets and more competition, yet few new players, dollars, or hours, competition has become more zero -sum than ever — and break -evens even rarer
Major Packaged AAA Video Game Releases Targeting Roughly the Same Player


And of course, new releases exist in a market where many of the top games release annual or even quarterly updates
Major Packaged AAA Video Game Releases Targeting Roughly the Same Player, Including Top Annual Releases and DLC/Updates


And the top games in a given year? Well, they’re almost always the top games in any given year
Best -Selling Packaged Games by Year by Packaged Sale Revenues
(US
3
Steam is best -in-class for game discovery. Still, 80% of 2024’s 19,000 releases didn’t qualify for Steam’s full social feature functionality (~$5K in sales in 2024)
Steam Game Releases by Year (Released in At Least One Market)
Games with Limited Profile Features
Games with Full Profile Features (e.g. Provide Steam XP, Badges, etc.)
In fact, 150 fewer Steam new releases grossed >$100,000 in 2024 than in 2016 — even though users are up 250%, new releases over 300%, and user spend up 200%
Estimated Steam MAUs and Peak CCUs by Month (Worldwide)
Steam Game Release by Year, First Year Sales (Released in At Least One Market, Includes Microtransactions)
Overall game discovery has declined as Steam’s player base and library grew. Game buys per user per year, as well as played per user, are at or near recorded lows
Steam Games Bought or Installed per MAU per Year
(Worldwide; Includes free -to-play games launched at least once)
Median Games Played per Steam MAU (Worldwide)
On Steam, 3rd -party games that are 8+ years old have 40% of total playtime and Counter -Strike takes another 13% ; the 12 -19,000 new releases get only 12%
Share of Total Steam Playtime by Year
Released in At Least One Market)
And among the thousands of annual releases fighting for 12% of playtime, #1 gets
20% of sales and #1 –10 take 60% (a share that has grown even as output swelled)
Share of Total New Game Sales on Steam, Top N Releases (2023; Worldwide)
Share of Total New Game Sales on Steam, Top 10 Releases (Worldwide)
Altogether, the same five franchises on PC (franchises which are 6 –22 years old) have averaged 30% of playtime for over 48 months straight
On PlayStation and Xbox, the concentration of engagement is even higher: The same five titles (7 –31 years old) have averaged 43% for 48+ months
Excluding annual releases ( NBA 2K ) but including sequels ( Spider -Man 2 ), only 6.5% of gametime in 2023 was for new games (a share that was high vs. 2021, 2022, 2024)
Share of Time Spent Playing PC and PlayStation/Xbox Games in 2023 (Worldwide; Users 18+; 37 Markets Total and Excludes India and China)
Annual Updates to Games First Released Before 2019 (EA FC, Call of Duty)
“Always On” GAAS Titles Released Before 2019 (Fortnite, Grand Theft Auto V)
Games Released in 2019, 2020, or 2021 (Apex Legends, Valorant)
Games Released in 2022 (Elden Ring, God of War Ragnarök)
6.5% Games Released in 2023 (Exc. Annually Releasing Titles, but Including Irregularly Released Sequels such as Spider -Man 2 and Alan Wake 2)
Tens of billions in development and marketing investment and thousands of games competed for that 6.5% of total player hours (and four titles won half of it)
Share of Time Spent Playing PC and PlayStation/Xbox Games in 2023 (Worldwide; Users 18+; 37 Markets Total and Excludes India and China)
Annual Updates to Games First Released Before 2019 (EA FC, Call of Duty)
“Always On” GAAS Titles Released Before 2019 (Fortnite, Grand Theft Auto V)
Games Released in 2019, 2020, or 2021 (Apex Legends, Valorant)
Games Released in 2022 (Elden Ring, God of War Ragnarök)
Games Released in 2023 (Exc. Annually Releasing Titles, but Including Irregularly Released Sequels such as Spider -Man 2 and Alan Wake 2)
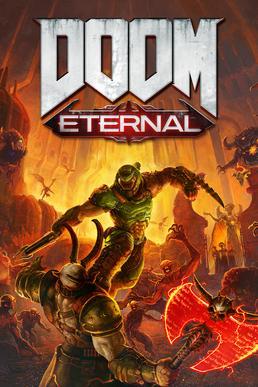
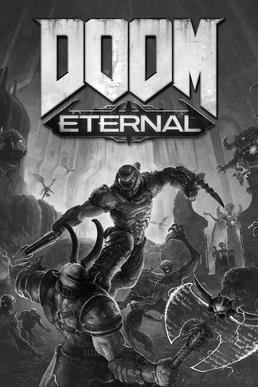
As supply grows but players stay stuck in top titles, even the best franchises often face falling sales but higher budgets across successive releases
Life -to -Date Unit Sales for Insomniac’s Spider -Man Series (Worldwide; Earlier Releases Benefit from More Years Available For Sale)
Production Budget for Insomniac’s Spider -Man Series (USD; Nominal Prices)
It’s easy to argue that sequel budgets should be lower given the uncertainty of matching, let alone growing, the sales of the prior entry…
Life -to -Date Unit Sales for Insomniac’s Spider -Man Series (Worldwide; Earlier Releases Benefit from More Years Available For Sale)


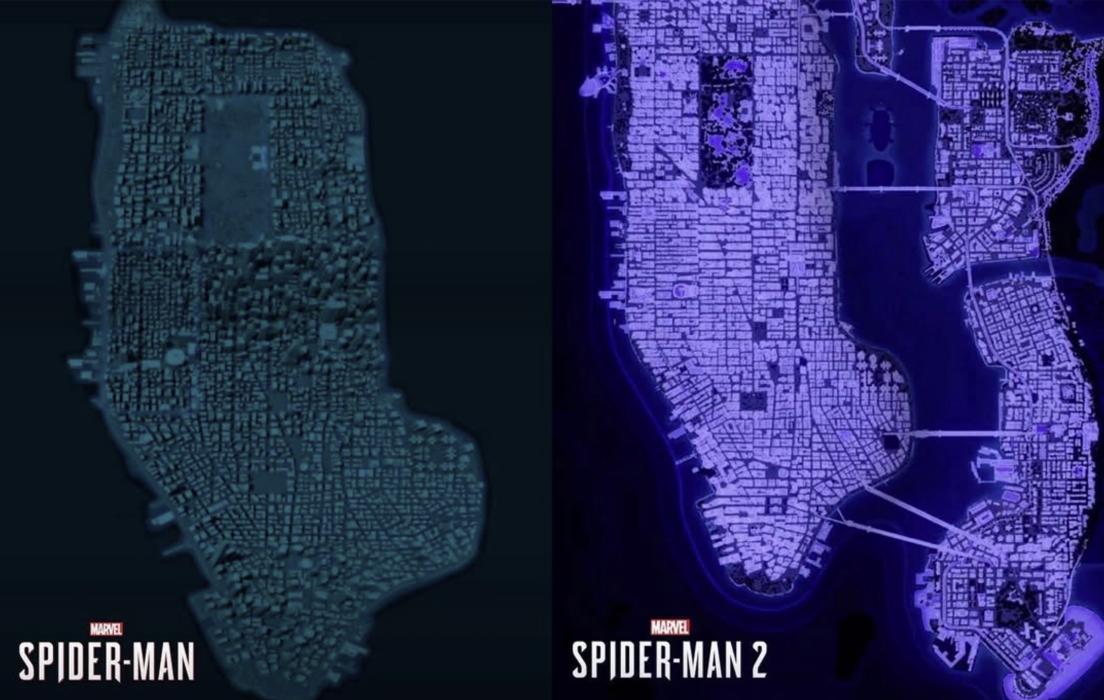

…But it’s not easy to convince those who skipped or didn’t finish a game to spend $70 on a sequel — or earn another $70 and 25 hours from those who did
Life -to -Date Unit Sales for Insomniac’s Spider -Man Series (Worldwide; Earlier Releases Benefit from More Years Available For Sale)

…And building a richer, deeper, and more expansive game is a natural response to a market that competes for increasingly scarce players, time, and spend
Life -to -Date Unit Sales for Insomniac’s Spider -Man Series
(Worldwide; Earlier Releases Benefit from More Years Available For Sale)


And to endure, live services titles need to replace a user’s existing weekly -to -daily habit — which makes a feature/content -light launch an even greater challenge
Average Concurrent Players on Steam by Month (Not All Titles Have the Same Player Concentration on Steam)
Splitgate development ended for Splitgate 2
MultiVersus Taken Offline MultiVersus Returns
Even at their cultural peak, many would -be GAAS leaders have fewer players than many long -running GAAS leaders averaged over four -plus years
Average Concurrent Players on Steam by Month
(Not All Titles Have the Same Player Concentration on Steam)
Marvel’s Avengers
Splitgate
New World
Halo Infinite
MultiVersus The Finals Helldivers II
Not Visible: Concord, Suicide Squad, Callisto Protocol, etc.
Faced with rising costs of operation, shrinking playerbases , and powerful competitors, new live service titles are forced to call it quits earlier than ever
Ongoing Development Timeline for Ubisoft Live Services Titles (Launches Since Q4 2015)
The Division 2 Brawlhalla For Honor
Ghost Recon Breakpoint
Hyper Scape
Riders Republic
Rainbow Six Extraction
Roller Champions
Skull & Bones
The concentration of player time reflects not just the abundance of choice, but the growing importance of network effects as games become increasingly social

Reed’s Law observes network strength from not just network size, but also group and sub -group formation. An A+ game that lacks a player’s squad is no A+ game.
To stay fun, sticky, and broadly appealing, market leaders also marshal unprecedented investments into their (constantly -refreshed) titles


“Black Hole Games” refers to a phenomenon whereby a massive franchise title has such a hold on players that it’s nearly impossible for a new game to pull them away
To compete with a Black Hole game, a would -be competitor must offer an experience that can overcome a player’s…

1. Hundreds or thousands of hours achieving skill mastery (and comfort)
▪ 800MM+ Fortnite players have probably spent 125B+ hours playing the game
2. Hundreds or thousands of dollars in purchased entitlements (avatars, outfits, items, skins, etc.), and much more in earned entitlements
▪ Fortnite players have probably spent $30B on cosmetics and items, much of which is on licensed IP (e.g. Star Wars, Marvel, John Wick, Neymar) that is not available in any other game
3. Hundreds of millions (or billions) of player connections and playmates, only a fraction of which will be on another game
▪ Epic counts over 6 billion player connections across Fortnite, Rocket League, and Epic Games Store
4. Hundreds of millions of hours and investment dollars (if not billions) in ecosystem development
▪ Creators have launched over 150,000 UEFN games on Fortnite, with Epic paying $500MM to these creators since March 2023
5. Confidence that their scarce time, money, effort, and social signaling will be durably rewarded
So,
What’s Going On… In a Sentence?
So, What’s Going On… In a Sentence?
The exhaustion of decade -plus growth drivers that grew players, playtime, and spend… coincided with evolving user behaviors, changing monetization models, and growing “lock -in” effects… that exacerbated longrunning competitive and budgetary escalations… while growth concentrated in foreign markets that shifted to local productions (and then took share abroad)… and occurred alongside acute macroeconomic financial events and epidemics… were worsened by microeconomic platform policy shifts… as well as the emergence of new and hyper -viral substitutes… and foreign -based competition… alongside too many would -be new growth drivers that have yet to deliver growth
This confluence of factors explains why the market stagnated, not just fell so very short of external and (not publicly available) internal forecasts
Worldwide Consumer Spending on Video Game Content, Plus Select External Forecasts For Growth 1 (Nominal Prices; Arcade + Console + PC + Mobile + VR + Web; Excludes Hardware & Accessories; Excludes Web3/NFT)
Sources: Pelham Smithers / Bloomberg, IDG, Newzoo , Meta, IDC, ARK, Bain, Google, E&Y, Ampere, Epyllion analysis
…And why so many titles have missed internal expectations (or even their production costs)
…And why so many gamemakers re-evaluated their development pipelines and, more often than not, cancelled scores of titles to instead refocus on existing hits

…And why venture capitalists have retreated to 2018 –2019 investment levels, even though worldwide spend is up 34% or $51B
VC Funding in Video Game Content Start -Ups (Worldwide)
VC Deals in Video Game Content Start -Ups (Worldwide)
Active VC Investors in Video Gaming (Worldwide; At Least One Deal in Year )
…Why PlayStation, a console with >100MM MAU and >$30B in revenue, has seen revenues grow 68% since 2018 but profits by only 3% and with a 9% income margin
employees suffered three straight years of record layoffs — 35,000 total before counting unreported layoffs and those without specified headcount
Annual Gross Reported Layoffs in the Video Game Industry
(Excludes Unreported Layoffs and Layoffs Where the Approximate Headcount Is Not Known; Not Net of Hiring)
…Prompting nearly every platform and publisher to start “aggressively” pursuing customers on every channel
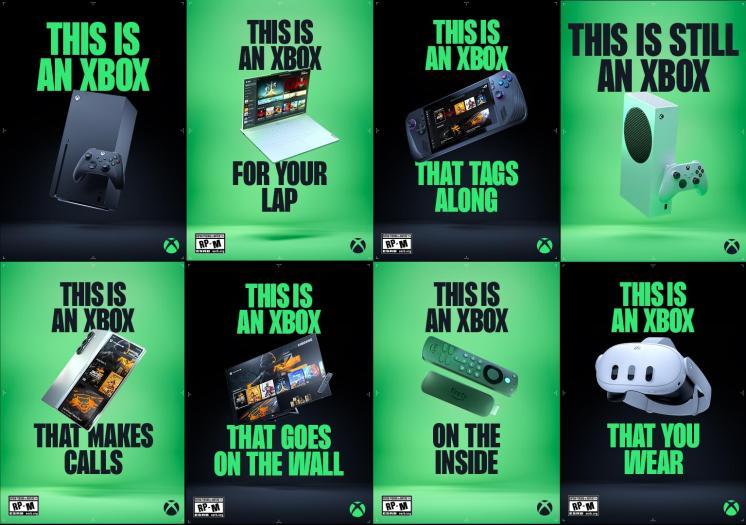
“[We will now] aggressively pursue a multiplatform strategy that includes Nintendo platforms, PlayStation, Xbox, and PCs.”
But how can the video game industry return to growth, rather than just fight over the same players, hours, and spend (and at ever higher costs)?
Worldwide Consumer Spending on Video Game Content
Without new growth engines, the video gaming market is stuck in a vicious cycle
Stagnant Revenues (with Rising Costs)
No -to -Low Player or Playtime Growth
Falling Profits with More & Bigger Failures
Fewer New Hits & Innovations
Less Investment and Risk Taking
Fewer Games & Studios
A Rough Three Years and the End of the 2011 –2021 Growth Wave
The Mobile Marketplace in 2025
A (Brief) Review of AR/VR Forecasts and Disappointments
How Much (and Where) Console/PC Has Grown
The Relevance of China (and Other Emerging Markets)
The Hostility of the Modern Console/PC Content Marketplace
How Player, Playtime, and Player Spend Might Return to Growth
First, it’s important to recognize that while low growth is a challenge for everyone — especially the largest players — new studios and franchises are emerging


As was the case in China, the global maturation of local/regional content studios is likely to (substantially) accelerate spending growth in those same markets
China Spend on Video Game Content by Country of Origin
(USD; Console + PC + Mobile + VR + Web; Excludes Hardware, Excludes Web3/NFT)
Developed in China
Developed Outside China
Consumer Spending on Video Game Content (USD; Console + PC + Mobile + VR + Web; Excludes Hardware, Web3/NFT)
Central Southern Asia
Southeast Asia
Middle East & Northern Africa
But with growing national support, plus far ( far) lower production costs, emerging market developers may take most of future growth — and more of current spend Sources:
Although video gaming faces declining players and playtime, Roblox’s growth is accelerating — benefiting from 140MM kids turning each of 8, 9, 10, etc., annually
Roblox Avg. Monthly Hours of Engagement
(Launch to Date ; Excludes Off -Platform Engagement such as YouTube and Twitch)
1-Year-Old at iPad Release Hits Roblox Demo
4-Year-Old at iPad Release Hits Roblox Demo
Roblox Release
iPad Release
Yet Roblox’s growth is also heavily diversified. Over 60% of users are now 13+ and playtime (and growth) is split roughly evenly across all major regions
Roblox Average DAUs by Age by Quarter (Worldwide)
Roblox Avg. Monthly Hours by Region (Worldwide)
With 350 –400 million monthly active users, Roblox already rivals the size of the
AAA ecosystem and towers over core competitors


Reported and Estimated Monthly Active Users in 2024 (Sums Are Not Deduplicated; Many Users Use or Play Multiple Platforms and Titles)


And though children game less than adults, Roblox now has more hours of direct monthly engagement than every gaming -specific console or software platform
Monthly Hours of Engagement
(Worldwide; Excludes Off -Platform Engagement Such as Watching PlayStation or Fortnite Streams on YouTube, Twitch, TikTok, etc.)


In fact, Roblox, with half the users of Netflix and about as many as Disney+, has about half the usage of Netflix and twice that of Disney+
Monthly Hours of Engagement
(Worldwide; Excludes Off -Platform Engagement Such as Watching PlayStation or Fortnite Streams on YouTube, Twitch, TikTok, etc.)


But Roblox doesn’t focus on “game -like” objectives (win, kill, shoot, defeat, score, beat) but non -game -like ones (share, create, express, identify, feel, show)
Roblox UGC Experiences Made per Year (Worldwide)
Roblox UGC Cosmetics, Assets or Bundles Made per Year (Counts Bundles as a Single Release)
Moreover, Roblox’s UGC economy is piping, with over $3.25B in payouts to UGC developers since 2006 — and annual run -rate payments now exceed $1B
Quarterly Developer Payments (Worldwide)
$300MM
Yet Roblox also loses roughly $30 for every $100 a player spends. After App Store and developer payments, only $52 is left for the remaining $82 in costs
Roblox Costs as a Percentage of Revenue
(Based on GAAP)
One problem is spend: Roblox generates a fraction of the revenue per hour of rival platforms and publishers (partly due to its sizable pre -teen/teen playerbase )
Content Revenue per Thousand Hours of Player Engagement
(Worldwide; Excludes Off -Platform Engagement Such as Watching PlayStation or Fortnite Streams on YouTube, Twitch, TikTok, etc.)
Another challenge is the tech/tools platform required for such scale. Roblox now spends $1.5B annually (40% of revenue) just on R&D (a 16x increase vs. 2019)
Roblox Quarterly R&D Expense and R&D Expense as TTM Share of Revenue (Based on GAAP)
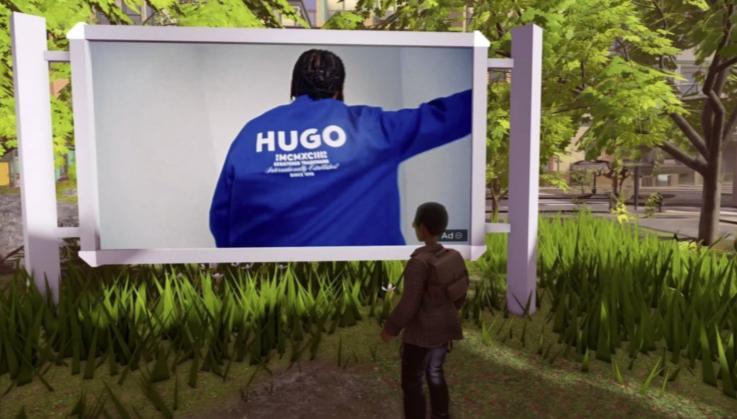
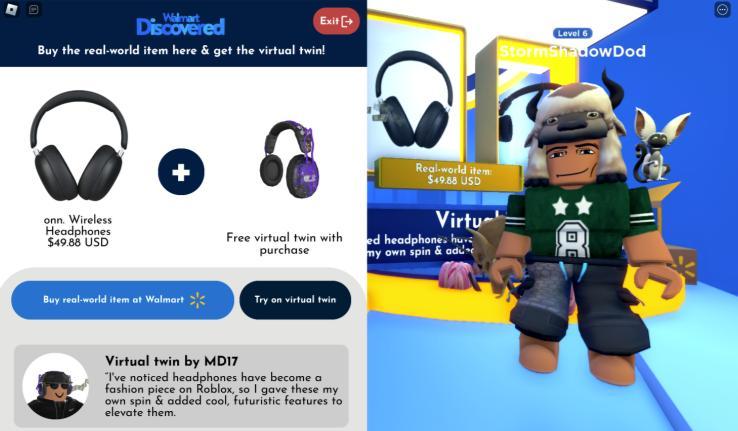
Roblox’s engine and data centers now enable surprisingly high -fidelity games (thus far, developers and users seem mostly uninterested in such experiences)
Maximillian’s FRONTLINES (2020)
(As of January 2025, Frontlines had over 120,000,000 lifetime plays)

Watch: https://x.com/JoshLu/status/1633506752082894848 or https://tinyurl.com/StateofVideoGaming2025 -Roblox
Maximillian’s FRONTLINES VERSUS (Forthcoming)
(As of January 2025, Frontlines had over 120,000,000 lifetime plays)

Watch: https://www.youtube.com/watch?v=rCplruoX0WA& or https://tinyurl.com/robloxfrontlinesversus
Sources: Maximillian’s FRONTLINES on Roblox, Josh Lu
Roblox’s R&D also supports numerous (mostly non -gaming) platform efforts. Few platforms ever reach 400MM MAU — and when they do, opportunities only grow…


Roblox has its own discoverability challenges , too. The most -played experience is 10% of playtime, while the top 10 are 30%, and top 50 of 30MM+ (!) are over half
Distribution of Engagement Across All Roblox Experiences (Monthly -Based Ranks)
Moreover, Roblox’s benefits — while great — come with large financial, technological, and strategic