28 minute read
Why the Steam Drum Is Crucial for Ensuring Proper Boiler Water Chemistry

blowdown sample is greater and therefore, less susceptible to error in collection and testing (3). The flowrate through the sample lines should be checked to ensure that velocity is approximately 6 feet per second (ft/s) with sample surplus flow going to drain.
The amount of time required to adequately flush the sample line depends on the length of the line and the size of the sample tubing. Table A, adapted from ASME’s Consensus on Operating Practices for the Sampling and Monitoring of Feedwater and Boiler Water Chemistry in Modern Industrial Boilers, provides recommended flushing times for various sizes of commonly used sample tubing. Best practices dictate a minimum of three pipe volumes be run through the system before it can be ensured that a sample is representative (4, 5). Using the table—if the sample line is constructed of 3/8-inch tubing with a wall thickness of 0.049 inches, the required flush time would be 4.3 seconds per foot (s/ft) of sample line. So, if the sample line from the pipe tap to the sample panel is 500 ft, the required flushing time is 2,150 s, or a minimum of 36 minutes. The sample flowrate should not be readjusted after or during the flush period.
Table A: Flush Times Required for Representative Sample Collection Recommended Purge Time at Flowrate of 500 mL/min
Sample Tubing Size (inches) Wall Thickness (inches) Tube ID (inches) (s/ft)
0.035 0.180 1.8 0.042 0.166 1.5 ¼-inch tubing 0.049 0.152 1.3 0.058 0.134 1.0 0.065 0.120 0.8 0.035 0.305 5.2 0.042 0.291 4.7 3/8-inch tubing 0.049 0.277 4.3 0.058 0.259 3.7 0.065 0.254 3.6 0.035 0.430 10.3 0.042 0.416 9.6 ½-inch tubing 0.049 0.402 9.0 0.058 0.384 8.2 0.065 0.370 7.6
Note: ID = inside diameter
Source: Reference 4
Most steam drums are provided with multiple saturated steam take-offs, with each take-off having its own sample collection nozzle. The sample lines from each take-off are commonly tied together to produce a composite saturated steam sample that is then routed down to the sample conditioning equipment for pressure reduction, cooling, and measurement. In other instances, the saturated steam sample is collected at a single location after the various saturated steam take-offs have been combined into a common steam header upstream of the superheater. If the plant is provided with the capability, it is most desirable to sample the saturated steam from each individual take-off to evaluate the carryover. This permits the steam purity to be evaluated along the entire length of the drum and helps to identify any location along the length of the drum where degradation or damage to the steam separation devices may have occurred. According to the Electric Power Research Institute (EPRI), there have been numerous instances reported where excessive carryover was discovered in only one area of the drum, and the damage to the steam separation equipment may have been missed or underappreciated if testing had only occurred on the combined saturated steam sample (2). To obtain samples that are truly representative of the bulk flow for fluid steams that exhibit two-phase, isokinetic sampling procedures as detailed in ASTM D1066 Standard Practice for Sampling Steam should be used. Isokinetic sampling ensures that all phases of the sampled fluid enter the collection nozzle with the same velocity and direction of flow and that the flow velocity into the nozzle is the same as the sampled stream velocity (6). Fluids exhibit different density and inertia in different phases and are, therefore, not proportionally represented in a sample that is not collected with an isokinetic device (6). To ensure that the data collected during a drum carryover test accurately measures the purity of the steam phase as well as the water droplets present in the steam, the saturated steam samples should be collected using isokinetic sample nozzles in accordance with ASTM D1066. During the test planning phase, it is important to verify that isokinetic sample nozzles are installed in the saturated steam lines where sample collection will be performed.
Testing Procedure Here are important steps to follow in the cooling drum testing procedure. 1. Walk down the unit and confirm sampling system configuration and valve alignments. Verify that all valves are functional and do not leak. Confirm that the sampling conditioning system is in service, lines are properly flushed, and uniform flowrate is provided to the instrumentation and/or grab sample points. 2. Verify calibration of all testing instrumentation and online analyzers. 3. Ensure that the unit is operating at steady design load and will likely remain so for the duration of the testing. Ensure that the drum blowdown is fixed at a constant flowrate.
Note the operating load, steam flowrate, and continuous blowdown flowrate (if available). It is recommended that testing commence one hour or more after steady state operating conditions have been established to minimize error potential due to transient conditions. 4. If the unit is operating on all-volatile treatment (AVT) chemistry, administer a small dosage of sodium hydroxide to the steam drum to boost sodium levels and provide sufficient sodium for testing. 5. If the unit is operating on caustic or phosphate treatment, discontinue feed temporarily to the drum while samples are collected and analyzed. 6. Collect and analyze samples from the saturated steam (drum steam) sample point(s) and the drum continuous blowdown. To achieve the best accuracy, the steam sample and the blowdown sample should be taken and analyzed within 5 minutes of each other. If the plant has the capability to rotate between multiple saturated steam take-offs, each take-off should be sampled individually (by closing the isolation valves on the other take-offs). After each sampling, the steam sample line should be flushed to avoid cross contamination of subsequent samples. Record the measured sodium concentration for each saturated steam sample location and the corresponding drum water sodium concentration. 7. Wait approximately one hour and repeat the process outlined in Step 6. 8. Confirm that the data collected in Step 6 is consistent with the repeated testing conducted in Step 7. The expectation is that the results should be comparable during repeat testing at each saturated steam take-off (within about 10%). If there is large variation in the data, wait one hour and repeat the testing process again or until repeatable results (again within about 10%) are achieved. The following data should be collected for each saturated steam take-off test point: • Continuous blowdown sodium (microgram per liter [µg/L], as Na) • Saturated steam sodium (µg/L as Na) • Carryover (Saturated Steam/Na/Blowdown Na) • Calculated carryover (Saturated Steam Na/Blowdown Na) *100% IAPWS document TGD1-08 (3), Technical Guidance Document: Procedures for the Measurement of Carryover of Boiler Water into Steam, and Appendix F of EPRI Technical Report 3002001381 (2), Comprehensive Cycle Chemistry Guidelines for Combined Cycle/ Heat Recovery Steam Generators, provide additional detail on performing carryover testing as well as additional background information that may be useful in planning and conducting this testing.
Interpreting the Results From the data collected during the testing process, the total carryover can be calculated by dividing the concentration of the sodium in the saturated steam by the concentration of the sodium in the drum blowdown and multiplying the result by 100%. An average total carryover can be determined (useful if multiple saturated steam take-offs were tested) by summing the individual test results and dividing by the number of tests conducted. For drums operating at less than 2,500 pounds per square inch gauge (psig), the vaporous component of the total carryover is less than 0.01%, allowing the assumption that the measured total carryover using the process above is approximately equal to the mechanical carryover (2). If the drum operates at 2,500 psig or greater, the vaporous carryover needs to be determined from the applicable charts or tables and subtracted from the total carryover to accurately determine the mechanical carryover. Appendix F of EPRI Technical Report 3002001381 provides tabulated data on volatile carryover of sodium at various operating pressures at or above 2,500 psig that can be used for this calculation. Once the mechanical carryover rate has been determined, the results can be compared to the design values for the steam drum to evaluate performance and potential separator degradation or damage. These results should also be compared to the previous carryover testing results to identify trends and determine the need for inspection of the steam drum internals or planning for repairs. If variations in mechanical carryover are noted between the various saturated steam take-offs, there is likely localized damage to the steam separation equipment, and plans for inspection and repair should be made as soon as practical. If needed, the cycles of concentration in the steam drum can be adjusted downward (by increasing the continuous blowdown from the drum) as required to maintain the required steam quality for the steam turbine and other steam users.
Case Studies While carryover, due to one mechanism or another, is the most frequently encountered chemistry challenge, other issues rooted in the design, maintenance, or operation of the steam drum or its ancillaries can also cause chemistry issues throughout the unit. These issues may include improper cleaning, improper blowdown control, improper chemical feed control, partitioning of amine/ammonia in drum, location of chemical feeds, or use of inferior pH adjustment products. The following case studies highlight a number of challenges related to steam/water cycle chemistry where issues (mechanical, chemical, or otherwise) originating in the steam drum were found to be the root cause of the chemistry issue. These case studies illustrate the importance of proper design, operation, and maintenance of this piece of equipment and its ancillary devices.
Study #1 Calibration and routine maintenance of all steam drum instrumentation is critical to ensuring that operations are properly monitored and that adjustments can be made based on reliable information. The first case study presents a situation where the level instrumentation on the steam drum was not calibrated properly, resulting in chemistry issues throughout the cycle. Lack of automation on the blowdown equipment and the drum chemical feed systems also exacerbated the problem. In a practical guide to boiler operations published in its journal, the American Society of Heating, Refrigerating and Air-Conditioning Engineers (ASHRAE) listed improper boiler blowdown techniques as one of the most common causes of catastrophic boiler failure. According to ASHRAE, a properly designed and operated continuous blowdown system constantly monitors boiler water conductivity and adjusts the blowdown rate to maintain compliance within a certain control range (7). After a scheduled maintenance outage, the high-pressure drum boiler at this industrial facility came back online. The plant operated using a phosphate program, and chemistry had been well maintained with very few excursions prior to its shutdown. However, just a few days after returning to service, the plant chemist began noting elevated sodium and silica levels in the condensate system. Little monitoring was available on the steam itself, but chemistry in the drum boiler water appeared to be within specification. Grab sample testing confirmed the online chemistry instrumentation readings. Despite the confirmation received on the online chemistry instrumentation, the plant decided to manually open the boiler blowdown until the condensate sodium and silica returned to specification. As expected, the increased boiler blowdown decreased the sodium and silica levels throughout the system; however, it also threw the chemistry in the steam drum into an upset condition. Control of chemical addition to the steam drum was performed manually with the operations staff, adjusting the pump stroke and speed as required after performing routine testing. These manual chemical feed adjustments resulted in overfeed-underfeed swings in chemistry as the operators struggled to locate the optimal dosing rates. This further exacerbated the control of chemistry throughout the system, resulting in a downward spiral where blowdown and chemical feed to the steam drum were almost constantly being adjusted as chemistry spiraled out of control. After weeks of operation in this fashion, the boiler was taken back offline and the drum opened. The first and most obvious thing noted as the drum was opened was a significantly higher operating water line in the drum. Further investigation revealed that a new process used to calibrate the drum level instrumentation during the previous outage resulted in a miscalibration of the devices and the drum operating with a significantly higher drum level than what the instrumentation was indicating. The devices were re-calibrated, and water chemistry quickly returned to normal once the unit was placed back into service.
Study #2 At first glance, the situation at the Case Study #2 facility was eerily similar to the situation experienced at the Case Study #1 facility. After coming back from a routine maintenance outage, the plant was starting to experience high silica readings throughout the system. Above-specification silica readings were noted in the condensate, feedwater, and steam, while the silica concentration within the steam drum itself was slightly elevated but remained within specification. Increasing the blowdown from the unit helped to keep the silica within ranges where the unit could remain in operation, but the water wastage from the unit was a concern for plant management, so testing was conducted to troubleshoot the problem. The first attempt to troubleshoot the problem was to lower the operating drum level to determine whether foaming or an issue with the level instrumentation was at the heart of this problem. The plant had experienced some foaming issues in another boiler drum at this facility due to organics present in the boiler water. Therefore, the plant was initially convinced that foaming was the root cause. However, the drum level change experiment produced a minimal change in the concentration of silica in the steam, and no organics were found during sampling and testing. Carryover testing on this steam drum was then performed to further troubleshoot the issue. It had been many years since the baseline carryover testing was completed, and no subsequent testing had been conducted since, so there was limited information to baseline the unit. Design information for the unit found in the plant files specified a guaranteed 0.125% mechanical carryover for the equipment. Sodium was used as the “tracer” chemical during the testing, and saturated steam samples were able to be collected via two takeoff locations. Based on the data collected during the testing, one of the two saturated steam
takeoff points had a much greater sodium carryover than the other takeoff; predicted total carryover far exceeded initial predictions based on operating pressure and design data on one end of the boiler drum as compared to the other end of the drum. When the unit was finally able to be brought offline for inspection, there was evidence of significant damage to a set of demister pads on the end of the drum that displayed excessive carryover during the carryover testing. After replacement of the demister pads and repair of the supports, the unit chemistry quickly returned to normal upon return to service.
Study #3 Selection of the right cycle chemistry program given the design of the plant is crucial to minimizing corrosion and deposition throughout the entire cycle. However, contrary to popular belief, chemistry programs are not “one size fits all” templates and application of recommendations provided by trade organizations. Guidelines such as those developed by EPRI, the American Society of Mechanical Engineers (ASME), and the International Association for the Properties of Water and Steam (IAPWS) require the end-user to evaluate the system design and operation independently and apply those recommendations in a fashion that considers and balances multiple site-specific requirements, such as corrosion and deposition minimization, economics, operational scenarios, and skill level of plant staff. Case Study #3 involves a 2 x 1 combined-cycle power plant with high pressure (HP), intermediate pressure (IP), and low pressure (LP) steam drums. The plant was designed with a feed forward low-pressure steam drum and was equipped with a single injection point for feeding a pH-adjusting agent downstream of the condensate pumps. The chemical injection locations normally provided on the HP, IP, and LP steam drums were capped and plugged, as the plant was designed to operate utilizing an AVT program, as recommended by most organizations for an all-ferrous metal system. Based on recommendations from the plant designers, the plant was operating utilizing aqueous ammonia as the pH-adjustment chemical injected in the condensate system to maintain a pH of 9.6 to 10.0, in accordance with the latest HRSG/combined-cycle chemistry recommendations. A target pH of 9.5 to 9.8 was established in the LP steam drum water to minimize the potential for flow-accelerated corrosion. The challenge that the plant encountered in this case was an inability to maintain the operating pH range both in the condensate and in the LP steam drum using aqueous ammonia as the chemical of choice. To maintain the low level of the operating band in the LP drum water at 9.5, the plant needed to add sufficient ammonia to increase the pH of the condensate to about 10.2. However, even with the elevated condensate pH, the plant was struggling to maintain a desirable operating pH in the IP and HP feedwater systems and in the IP and HP steam drums. Due to the tendency for ammonia to volatize with the steam in the LP drum, the IP and HP systems pH levels were depressed, leading to corrosion forming in these portions of the system. To rectify the situation, the plant conducted a series of trial tests using different amine blended products to try and find a product that achieved the target pH in the condensate, the target pH in the LP system, and the target pH in the IP and HP systems, and achieved their chemistry goals in a cost-effective manner. Several different products were tested, with the desire to maintain the single injection point in the condensate system for simplicity’s sake. After several trial runs, the plant settled on a blended ammonia and monoethanolamine as the best performing option. They also added an additional amine injection point in the suction line to the boiler feedwater pump to supplement the current injection location in the condensate system. One lesson learned that the plant took away from this experience was that regardless of recommendations by the plant design team, for the next combined-cycle plant that is was looking to construct, it would keep intact alternative chemical locations at all three steam drums to allow for flexibility in optimizing the cycle chemistry.
Study #4 An inadequate or incomplete chemical cleaning can be just as bad, or even worse, than no chemical cleaning at all. In Case Study #4, a new boiler was constructed, and chemical cleaning of the water side was completed in a rushed fashion to meet a slipping schedule. Also, due to a compressed schedule, limited inspections were performed to verify the cleanliness of the unit: the steam drum was not opened for inspection. After chemical cleaning, the plant attempted to quickly move the unit into the startup process. Throughout the next few weeks, heavy iron transport was observed throughout the system, resulting in plugging of a number of the sample panel lines. Side-stream filters were installed in an attempt to remove some of the iron transport in the system. After several days of limited progress, the unit was taken offline and a thorough inspection was performed. The appearance inside the steam drum was not visually appealing. Large volumes of debris were found, particularly in the boiler steam drum, as well as areas of inadequate passivation. Due to the way that the vents and drains were configured on the drum and the natural holdup in the drum, it was suspected that poor venting and draining occurred during the cleaning
process, despite constant monitoring of pressure throughout the process. Lack of circulation in the steam drum during cleaning and air-locking in the top section of the drum were suspected as the causes of the inconsistent passivation noted through the drum. Other areas of the steam/water system, on the other hand, including the downcomers, looked remarkably well with relatively clean and well-passivated pewter gray surfaces. The plant decided that the best path forward was to redo the chemical cleaning. The lessons learned from this case study are multiple. First, the design for the chemical cleaning was not ideal and resulted in inadequate venting and draining of the drum during the cleaning process. This design was modified during the second cleaning of the unit. Secondly, the plant implemented a total suspended solids endpoint for confirmation that adequate flushing had been achieved after chemical cleaning. The first chemical cleaning process criteria only included a conductivity endpoint for flushing operations. Finally, for the post-chemical cleaning, the plant performed a full and thorough inspection of the unit, including opening and inspecting the steam drum, before signing off the process as complete and acceptable with the cleaning contractor.
Final Thought The aim of this article was to examine mechanical and operational problems commonly experienced with boiler and HRSG steam drums, and what chemistry challenges and other issues these can create throughout the entire steam-water cycle. The steam drum is often viewed by some as a wide spot in the line, or more frequently, as a simple storage vessel where water and steam separation occurs. This is true and a key reason why the operation and maintenance of the steam drum is important to good cycle chemistry in a boiler system. Routine carryover testing is relatively easy to perform and a valuable tool for detection and diagnosis of mechanical and operational issues associated with boiler and HRSG steam drums. References 1. Babcock and Wilcox (1992). Steam: Its Generation and Use, 40th ed., Babcock and Wilcox, Barberton, Ohio. 2. EPRI (2013). “Comprehensive Cycle Chemistry Guidelines for Combined
Cycle/Heat Recovery Steam Generators”,Technical Report 3002001381,
Electric Power Research Institute, Palo Alto, California. 3. International Association for the Properties of Water and Steam (2008).
“Technical Guidance Document: Procedures for the Measurement of Carryover of Boiler Water into Steam”, IAPWS TGD1-08, website: www.iapws.org. 4. American Society of Mechanical Engineers (2006). “Consensus on Operating
Practices for the Sampling and Monitoring of Feedwater and Boiler Water
Chemistry in Modern Industrial Boilers”, CRTD-Vol. 81. 5. American Society of Mechanical Engineers (1994). “Consensus on Operating
Practices for the Control of Feedwater and Boiler Water Chemistry in Modern
Industrial Boilers”, CRTD-Vol. 34. 6. ASTM (2018). “Standard Practice for Sampling Steam”, #D1066-18e1, ASTM
International,West Conshohocken, PA. 7. Reeves, W.L. (September 2001). “Avoiding Boiler Problems”, ASHRAE Journal,
American Society of Heating Refrigerating and Air-Conditioning Engineers,
Atlanta, Georgia.
Author Colleen Scholl is senior vice president with HDR and a technical expert consultant who has more than 25 years specializing in water and steam/water cycle chemistry within the industrial sectors. Ms. Scholl holds B.S. and M.S. degrees in engineering fields as well as an MBA. She is currently the chairperson of the ASME Research and Technology Committee on Water and Steam in Thermal Systems. Ms. Scholl can be contacted at Colleen.Scholl@hdrinc.com.
This paper was presented at the 2019 International Water Conference, which was conducted November 10-14, 2019, in Orlando, Florida. More information about the IWC is available at www.eswp.com.
Diagnosing Heat Exchanger Failures in Waste Heat Steam Generation Systems
Edward S. Beardwood, Solenis LLC
Steam generator failures occur for a variety of reasons, and sometimes the root cause(s) are misdiagnosed, leading to reoccurrence of the failures. Tube failures are not necessarily required to impact the degradation of system performance. In manufacturing, where a process may run at high temperatures to allow for completion of chemical reactions, eventually the process will need to be cooled. The process side that requires cooling maybe a gas, vapor, liquid, or solid smelt. If the process-side temperatures are extremely high, and cooling to well above the atmospheric boiling of water is required, this waste heat is converted to steam via a waste heat boiler. The components of waste heat steam generation systems are typically not readily identifiable and accessible within a process unit. A waste heat steam generation system may look like a typical “O” type water tube boiler inserted into a gas exhaust flue stack, or it may be more complex. The complexity will depend on the number of unit processes that require cooling and the required pressure and temperature of the produced steam needed to operate the manufacturing process. Remote steam drums are associated with these complex systems, and multiple pressures may apply. A centrally located feedwater plant that produces a mixture of pretreated makeup water and returned condensate is deaerated and then transported to process units within the manufacturing site for use in the waste heat steam generation system. The system may consist of unit processes such as preheaters, economizers, and steam-generating shell-and-tube heat exchangers, operating in a thermosiphon fashion, and the steam water mixture is then sent to a remote collection drum for steam separation that may or may not have an associated process or externally fired superheater and associated steam attemperation station. Forms of corrosion and fouling within these systems will vary depending on which unit process is affected and the process-side temperatures and impurities. In fact, low process-side temperatures can enhance fouling and dew point corrosion rates, reducing product throughput and asset life expectancy. Cooling or water/steam-side corrosion have been due to flow accelerated corrosion (FAC), oxygen pitting, steam collapse, under deposit corrosion (UDC), cracking due to corrosion fatigue (CF), stress corrosion cracking (SCC), or overheating (creep from deposition, departure from nucleate boiling, or steam stalling). Steam stalling can occur when excessive heat input
into a steam generating tube or rapid drop in outlet steam throttle pressure upsets occur; steam then fills a portion of the tube length and stops natural thermal syphon recirculation. Fouling is brought on by impurity deposition, whether it be from hardness salts or transported corrosion products/particulates in the feedwater. Should poor steam purity maintenance practices also exist (1), these impurities can cause fouling and corrosion within superheaters, turbine drives, and downstream process steam consuming unit process equipment.
There are also specific memorable failures within these types of systems. Here are a few examples: 1. Excess process heat input charge compared to design or missing baffles and/or insulation on the gas process side, leading to departure from nucleate boiling (DNB) and disrupting circulation to a point of steam stalling the tube steam water mixture flow. 2. For vertical units, forgetting to reinstall feedwater lines and associated baffles as per design into the process heat exchange unit, allowing too much cooling in one area and too little in another area of the tube sheet-to-tube weldment areas. This then causes deposit formation on the waterside at the tube-to-tube sheet, resulting in wick boiling and
UDC. It also causes the process gas areas to operate below 750 °F, with the potential for localized dewpoint corrosion and uneven expansion and contraction stresses of tube to tube sheet welds, which can fail due to corrosion fatigue. 3. Forgetting to reinstall tabulators and baffles on the process gas side that evenly distributes the gas charge for even cooling. Thus, avoiding the potential for the two preceding failures to occur over time. 4. Lack of vents or unopened vents on vertical process heat exchange shell-and-tube units with shell-side cooling. These vents are installed under the top baffle and are connected to the remote steam drum. They are used to evacuate accumulated steam below the baffle to enhance circulation and metal wetting and to avoid tube-and-tube sheet thinning from evaporative concentration of corrosive ions in the water phase at the steam phase interface without washout. Maintenance of the water quality and chemistry can be difficult because of accessibility and/or the lack of availability of the operations staff within the production unit. Process side or production and its control receives all the attention, the cooling and steam production side are orphans and receive little attention until the process side slows because of their poor performance. By this time, it is too late and the facility must take a forced outage. Let us now look at two case histories that have a combination of fouling and corrosion issues. These waste heat steam generation systems are examples of a complex system and a conventional cross-drum water tube boiler.
Case History 1 (Complex System) The operational design of these affected waste heat steam generators had not been previously obvious to identify or warn of a potential problem. That is, there were two mass balances associated with the steam production. The waste steam generation system consists of a feedwater preheater/gas cooler (20% of steam production) and a salt cooler (80% of steam production), with an associated 450 pounds per square inch gauge (psig) (440 to 480 operational range) remote steam drum, as illustrated in Figure 1. There are four such trains associated with each salt reactor. Both the salt and off gas entered the shell-and-tube vertical thermos-siphon steam generators at 427 °C (800 °F). The salt cooler has boiler water on the tube side, while the gas cooler has a mixture of feedwater and recycle steam drum water on the shell side. The feedwater is a blend of untreated condensate that is deaerated and then chemically adjusted in the deaerator storage section pumped forward to be blended with purchased chemically treated deaerated feedwater from a neighboring plant prior to entering the waste heat steam generation circuit. The makeup water was pretreated with clarified filtered softened water up until mid-2001, and then polishing with reverse osmosis (RO) was instituted. An upset in the pretreatment system had occurred in early 2003. A salt cooler failed in 2003. Another salt cooler failed in spring 2004, followed by another salt cooler and a gas cooler in the fall of 2004. Based on the 2003 upset in pretreatment and makeup/feedwater quality and the three heat exchanger failures, chemical cleaning of all the waste heat steam generator heat exchangers was performed by the end of 2004. Approximately three months later, another salt cooler in service for 11 months failed.
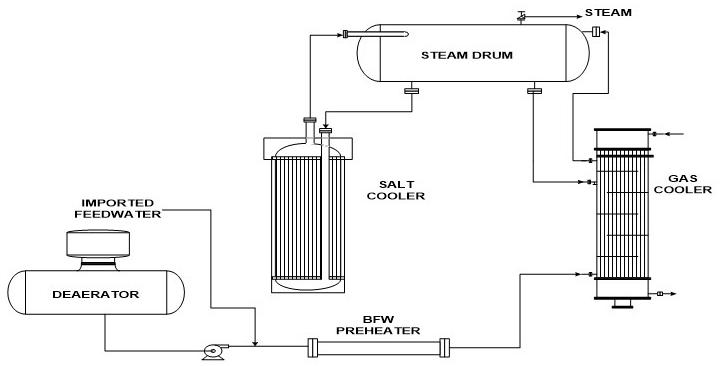
Figure 1: Generalized layout of steam generation system.
A full review of retained failed specimens, metallurgical reports, deposit analysis, chemistry logs, and additional sampling and testing was initiated. It had been suggested by other consultants that the failures were due to poor deaeration and chemical oxygen scavenging. They came to this conclusion because they found pitting in the gas cooler bundle that was believed to be caused by iron corrosion product generation and poor conditioning by the polymeric dispersant in use to transport corrosion products out of the boiler system. This was evidenced by salt coolers that had some tubes blocked by iron-containing deposits However reasonable and simple to correct, the metallurgical analysis and full deposit analysis as well as deposit morphology could not substantiate this as the root cause. It should be noted that prior to the failures, only sulfite was added to the site’s deaerator storage section, and it was later realized an increase in the site feedwater pH required improvements from the existing 6.0 to 7.0 range. This took time to implement. In addition, with variable imported feedwater iron values of 0.07 to 0.17 milligrams per liter (mg/L), it was decided to feed a polymeric iron dispersant to the site feedwater. This was implemented in late fall 2004. Let us look at the failure fingerprints that may have been misleading and the investigative action taken to arrive at a root cause and the validation outcome. The salt cooler metallurgical photographs reveal both deposit and attack, as well as the failure that was incurred at the bottom of the tube inlet near the first baffle, which is adjacent to the hot salt (800 °F, sodium nitrate/potassium nitrite [NaNO3/KNO2] mixture) inlet. Figure 2 shows a failed section below the baffle. On the right side is a piece of the tubing, while the left side shows localized corrosion beneath the cleaned deposit area. The whitish yellow material is from salt intrusion after failure and depressurization. Below the baffle area of failure, the tube was partially blocked with deposits at 50% diameter reduction. While the area above the baffle area of failure is completely blocked, as seen in Figure 3, an overall set of deposit probable combinations from SEM/ EDS analysis is provided in Table A.
It should be noted that these types of analysis are semiquantitative and that the deposit analysis of the unblocked areas had a 1% solution pH of 10.6, and the blocked tube portion had a 1% solution pH of 11.7. The failed gas cooler tube extracted from the upper section overview illustration can be found in Figure 4. A closer view of the fractured upper section near the hot gas tube sheet inlet reveals aggressive UDC attack. The deposit probable combination from the scanning electron microscopy/ energy dispersive X-ray spectroscopy (SEM/EDS) analysis of the deposit is presented in Table A and was found to have a pH of 10.6. Localized attack throughout the upper portion of the gas cooler tube between the tube sheet and baffle joint was observed after cleaning, as illustrated in Figure 5. The localized oxygen pitting corrosion, as noted earlier, was only seen in the lower entrance