technical features
applications, including monitoring of drinking water, domestic and industrial waste waters. Water samples were chosen from seven major water authorities around Australia to represent the wide variation in water quality included both surface and ground waters. A laboratory trial was conducted using standard laboratory procedures for UV254, colour, DOC and rrihalomerhane fo rmation potential (THMfp) measurements (Bennett and Drikas, 1993; APHA et al., 1998). As per rhe standard methods, sample filtration th rough 0.45 micron fil ter was performed. The comparison focussed on using the S::CAN Spectro::lyser™ in rhe on-l ine/in situ application without prior sample fil tration, as would be rhe case in real-rime monitoring.
forward prediction of coagulant dose (van Leeuwen et al. 2005). T his technique only requires very simple instrumentation and can be performed by the operators at the treatment plant.
0.7 0
0.6
Raw Water
0.5
:-
2
R
0.4
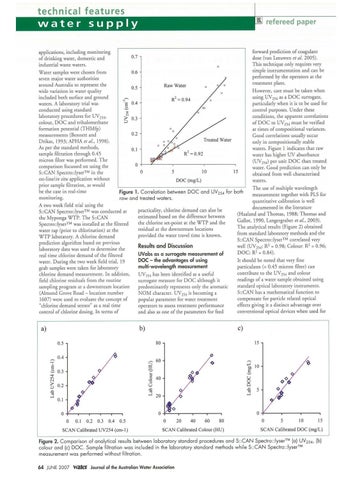
However, care must be taken when using UV254 as a DOC surrogate, particularly when it is to be used fo r control purposes. Under these conditions, rhe apparent correlations of DOC to UV25 4 must be verified at times of compositional variances. Good correlations usually occur only in compositionally stable waters. Figure 1 indicates that raw water has higher UV absorbance (UV 254) per unit DOC than treated water. Good prediction can only be obtained from well characterised waters.
= 0.94
!..,. 5 0.3 ~
0.2
Treated Water 0.1
2
R
= 0.92
0
5
0
15
10
DOC (mg/L)
The use of multiple wavelength measurement together with PLS for quantitative calibration is well documented in the literature (Haaland and Thomas, 1988; Thomas and Gallor, 1990, Langergraber et al., 2003). The analytical results (Figure 2) obtained from standard laboratory methods and rhe S::CAN Specrro::lyser™ co rrelated very well (UV2;f R2 = 0.98; Colour: R2 = 0.96; DOC: R2 = 0.84).
Figure 1. Correlation between DOC and UV 254 for both raw and treated waters.
A two week field trial using the S::CAN Specrro::lyser™ was conducted at the Myponga WTP. The S::CAN Spectro::lyser™ was installed at the filtered water tap (prior to chlorination) at the WTP laboratory. A chlorine demand prediction algorithm based on previous laboratory data was used to determine the real rime chlorine demand of the filtered water. During the two week field trial, 19 grab samples were taken for laboratory chlorine demand measurement. In addition, field chlorine residuals from the routine sampling program at a downstream location (Almond G rove Road - location number 1607) were used to evaluate the concept of "chlorine demand sensor" as a real rime control of chlorine dosing. In terms of
practicality, chlorine demand can also be estimated based on the difference between the chlorine set-point at rhe WTP and the residual at the downstream locations provided rhe water travel time is known.
Results and Discussion UVabs as a surrogate measurement of DOC - the advantages of using multi-wavelength measurement UV 254 has been identified as a useful surrogate measure for DOC although it predominantly represents only rhe aromatic NOM character. UV25 4 is becoming a popular parameter for water treatment operators to assess treatment performance and also as one of the parameters for feed
c)
b)
a)
Ir should be noted rhar very fine particulates(< 0.45 micro n filter) can contribute to the UV25 4 and colour readings of a water sample obtained using standard optical laboratory instruments. S::CAN has a mathematical fu nction to compensate for particle related optical effects giving it a distinct advantage over conventional optical devices when used for
15
0.5 ,-._
6 "" N "' <.)
'-'
> :)
0.4 0.3
"'
60
0
40
;:,
0
~ u
0
Cl ~
.D
"'
...l
0.1
0
0.1
0.2
0.3
0.4 0.5
SCAN Calibrated UV254 (cm-I )
10
E
'-'
u
0.2
.D
...l
s c....
...l
20
0
20
40
60
80
SCAN Calibrated Colour (HlJ)
5
0
5
10
15
SCAN Calibrated DOC (mg/L)
Figure 2. Compari son of analytical results between laboratory standard procedures and S::CAN Spectro:: lyser™ (a) UV254, (b) colou r and (c) DOC. Sample filtration was included in the laboratory standard methods whi le S::CAN Spectro::lyser™ measurement was performed without fi ltration .
64
JUNE 2007
Water
Journal of the Australian Water Association