PRODUCT FOCUS
Revit MEP An important note at this point is to take a look at the view scale of the 3D views that we have created and to dynamically set this view scale to ensure the proper placement and alignment of the view on the sheet. To set the view scale of a view as it relates to the sheet size, we can get the general size of the fabrication part that is being displayed in the view. This can be done by grabbing the length parameter, or it can be taken as the distance from the maximum to the minimum point of the bounding box that surrounds the part.
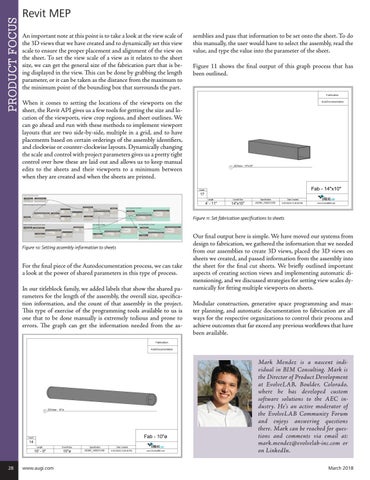
semblies and pass that information to be set onto the sheet. To do this manually, the user would have to select the assembly, read the value, and type the value into the parameter of the sheet. Figure 11 shows the final output of this graph process that has been outlined.
When it comes to setting the locations of the viewports on the sheet, the Revit API gives us a few tools for getting the size and location of the viewports, view crop regions, and sheet outlines. We can go ahead and run with these methods to implement viewport layouts that are two side-by-side, multiple in a grid, and to have placements based on certain orderings of the assembly identifiers, and clockwise or counter-clockwise layouts. Dynamically changing the scale and control with project parameters gives us a pretty tight control over how these are laid out and allows us to keep manual edits to the sheets and their viewports to a minimum between when they are created and when the sheets are printed.
Figure 11: Set fabrication specifications to sheets
Figure 10: Setting assembly information to sheets
For the final piece of the Autodocumentation process, we can take a look at the power of shared parameters in this type of process. In our titleblock family, we added labels that show the shared parameters for the length of the assembly, the overall size, specification information, and the count of that assembly in the project. This type of exercise of the programming tools available to us is one that to be done manually is extremely tedious and prone to errors. The graph can get the information needed from the as-
Our final output here is simple. We have moved our systems from design to fabrication, we gathered the information that we needed from our assemblies to create 3D views, placed the 3D views on sheets we created, and passed information from the assembly into the sheet for the final cut sheets. We briefly outlined important aspects of creating section views and implementing automatic dimensioning, and we discussed strategies for setting view scales dynamically for fitting multiple viewports on sheets. Modular construction, generative space programming and master planning, and automatic documentation to fabrication are all ways for the respective organizations to control their process and achieve outcomes that far exceed any previous workflows that have been available.
Mark Mendez is a nascent individual in BIM Consulting. Mark is the Director of Product Development at EvolveLAB, Boulder, Colorado, where he has developed custom software solutions to the AEC industry. He’s an active moderator of the EvolveLAB Community Forum and enjoys answering questions there. Mark can be reached for questions and comments via email at: mark.mendez@evolvelab-inc.com or on LinkedIn. 28
www.augi.com
March 2018