AutoCAD
Civil 3D 2010 and 2011 Step 1: In Prospector, right-click on the Volume Calcs surface and select Surface Properties. Step 2: Select the Analysis tab (see Figure 6).
Figure 4: The Surface Style dialog box is used to customize the display of a Civil 3D surface.
Step 4: Change the color Scheme to Reds. (The color scheme is what Civil 3D uses as a starting point when shading the surface.) Step 5: Change the “Group By” setting to Equal interval. (This setting will allow you to divide the total “height” of the surface into nice equal increments.) Step 6: Finally, select the Display tab and make sure the Elevations component is the only one allowed to be visible. Click OK to complete the style.
COLORIZING CUT AND FILL AREAS Now that our new style is finished, let’s assign it to the Volume Calcs surface. Start by jumping back to the Prospector tab, rightclick on the Volume Calcs surface name, and choose Select from the menu. Once the surface is selected, press CTRL+1 to open the Properties Palette and use the Style field to select the Cut-Fill Volumes style. Your drawing should now look similar to Figure 5.
Figure 6: The Analysis tab of the Surface Properties dialog box is where we can finalize our ranges and color choices.
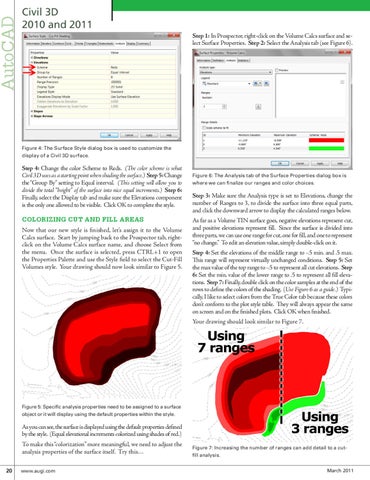
Step 3: Make sure the Analysis type is set to Elevations, change the number of Ranges to 3, to divide the surface into three equal parts, and click the downward arrow to display the calculated ranges below. As far as a Volume TIN surface goes, negative elevations represent cut, and positive elevations represent fill. Since the surface is divided into three parts, we can use one range for cut, one for fill, and one to represent “no change.” To edit an elevation value, simply double-click on it. Step 4: Set the elevations of the middle range to -.5 min. and .5 max. This range will represent virtually unchanged conditions. Step 5: Set the max value of the top range to -.5 to represent all cut elevations. Step 6: Set the min. value of the lower range to .5 to represent all fill elevations. Step 7: Finally, double click on the color samples at the end of the rows to define the colors of the shading. (Use Figure 6 as a guide.) Typically, I like to select colors from the True Color tab because these colors don’t conform to the plot style table. They will always appear the same on screen and on the finished plots. Click OK when finished. Your drawing should look similar to Figure 7.
Figure 5: Specific analysis properties need to be assigned to a surface object or it will display using the default properties within the style.
As you can see, the surface is displayed using the default properties defined by the style. (Equal elevational increments colorized using shades of red.) To make this “colorization” more meaningful, we need to adjust the analysis properties of the surface itself. Try this… 20 www.augi.com
Figure 7: Increasing the number of ranges can add detail to a cutfill analysis. March 2011