AutoCAD
by: Jeff Bartels
Civil 3D 2010 and 2011
Earthwork Volumes in Living Color
O ➲
ne thing that AutoCAD® Civil 3D® is known for is the speed with which it calculates earthwork. In fact, if you’ve already defined an existing and a proposed surface for your site, you can generate accurate cut/fill volumes in a matter of seconds. In addition to knowing “what” your earthwork calculations are, Civil 3D can also “show” you the areas of cut and fill in your design. It’s said that a picture is worth a thousand words. Likewise, a colorized cut/fill analysis is more descriptive than a single Net Volume calculation. (It’s also a great tool for spotting surface errors that might otherwise go unnoticed.) In this article I’m going to show you how to use Civil 3D to display your earthwork volumes graphically. I should also mention, in the interest of full disclosure, that the following instructions are 100 percent compatible with Civil 3D 2011 and 2010. Most of it will work with 2009 as well.
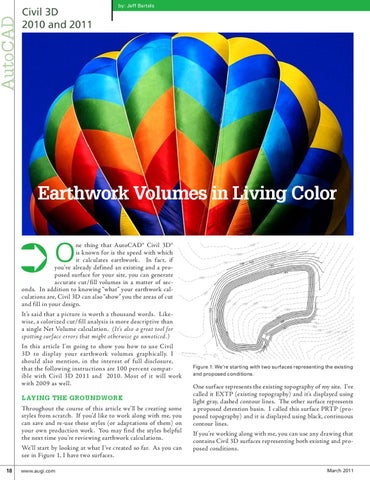
LAYING THE GROUNDWORK Throughout the course of this article we’ll be creating some styles from scratch. If you’d like to work along with me, you can save and re-use these styles (or adaptations of them) on your own production work. You may find the styles helpful the next time you’re reviewing earthwork calculations. We’ll start by looking at what I’ve created so far. As you can see in Figure 1, I have two surfaces. 18 www.augi.com
Figure 1: We’re starting with two surfaces representing the existing and proposed conditions.
One surface represents the existing topography of my site. I’ve called it EXTP (existing topography) and it’s displayed using light gray, dashed contour lines. The other surface represents a proposed detention basin. I called this surface PRTP (proposed topography) and it is displayed using black, continuous contour lines. If you’re working along with me, you can use any drawing that contains Civil 3D surfaces representing both existing and proposed conditions. March 2011