AutoCAD
Civil 3D 2011
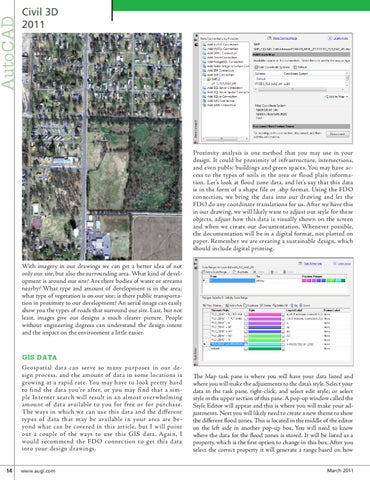
Proximity analysis is one method that you may use in your design. It could be proximity of infrastructure, intersections, and even public buildings and green spaces. You may have access to the types of soils in the area or flood plain information. Let’s look at flood zone data, and let’s say that this data is in the form of a shape file or .shp format. Using the FDO connection, we bring the data into our drawing and let the FDO do any coordinate translations for us. After we have this in our drawing, we will likely want to adjust our style for these objects, adjust how this data is visually shown on the screen and when we create our documentation. Whenever possible, the documentation will be in a digital format, not plotted on paper. Remember we are creating a sustainable design, which should include digital printing. With imagery in our drawings we can get a better idea of not only our site, but also the surrounding area. What kind of development is around our site? Are there bodies of water or streams nearby? What type and amount of development is in the area; what type of vegetation is on our site; is there public transportation in proximity to our development? An aerial image can easily show you the types of roads that surround our site. Last, but not least, images give our designs a much clearer picture. People without engineering degrees can understand the design intent and the impact on the environment a little easier.
GIS DATA Geospatial data can serve so many purposes in our design process, and the amount of data in some locations is growing at a rapid rate. You may have to look pretty hard to find the data you’re after, or you may find that a simple Internet search will result in an almost overwhelming amount of data available to you for free or for purchase. The ways in which we can use this data and the different types of data that may be available in your area are beyond what can be covered in this article, but I will point out a couple of the ways to use this GIS data. Again, I would recommend the FDO connection to get this data into your design drawings. 14 www.augi.com
The Map task pane is where you will have your data listed and where you will make the adjustments to the data’s style. Select your data in the task pane, right-click, and select edit style; or select style in the upper section of this pane. A pop-up window called the Style Editor will appear and this is where you will make your adjustments. Next you will likely need to create a new theme to show the different flood zones. This is located in the middle of the editor on the left side in another pop-up box. You will need to know where the data for the flood zones is stored. It will be listed as a property, which is the first option to change in this box. After you select the correct property it will generate a range based on how March 2011