vorite Map functions because it can quickly turn an ordinary map or drawing into something so much more powerful. A simpler explanation: It makes our drawings look good. It can even allow us to work in large data sets by turning off unneeded information or data. For instance, when you zoom out you do not need to see the fine details of your data, and only as you zoom in close enough to see this data does it need to be displayed in its full detail.
eral ways, and by default they usually create a grid system, which may not be our desired layout. Still, I have used them when I was not using a grid layout, so there are ways that we can use map books that better fit our needs. One of the advantages that map books give us is their ability to know how each map book fits with one another. In addition, the tool allows us to automate some of our sheet information, including legends.
Map import gives us the ability to work directly with GIS data—importing and exporting it from GIS to MAP and back again. This opens the door for us to be able to use an almost endless amount of data—data that can be found and downloaded, often for free, from the Internet. Many states, universities, and government agencies share this data freely. In some areas or states, you can create entire stat maps of roadways, county, or city boundaries, utility information, voting districts, and more, in a matter of minutes once the data has been downloaded or obtained. One of the most common formats that I have used for this function are ESRI shape files, but there are several file formats that can be inserted through this tool.
Christian Barrett is an AEC Applications Engineer at Applied Technology Group, North Little Rock, AR. He has over 10 years of Civil and Surveying industry experience as a CAD designer using Land Desktop & Civil 3D, and has been a CAD Coordinator at Multidisciplinary Engineering/Architectural Firms. He was the creator and author of Autodesk Users Group International’s (AUGI) Hotnews column “The Civil Side,” and is a Civil Engineering forum moderator for the AUGI organization. As a civil applications technician and trainer, Christian has guided many engineering firms in the implementation of Civil 3D for design and CAD management, National CAD Standards, and Building Information Modeling (BIM) workflows.
Figure 4: Tool 7 – Stylizing features
Tool 8 – Map Import
feature focus
Civil Engineering
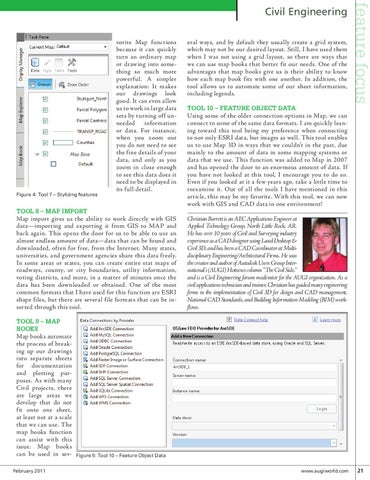
Tool 10 – Feature Object Data
Using some of the older connection options in Map, we can connect to some of the same data formats. I am quickly leaning toward this tool being my preference when connecting to not only ESRI data, but images as well. This tool enables us to use Map 3D in ways that we couldn’t in the past, due mainly to the amount of data in some mapping systems or data that we use. This function was added to Map in 2007 and has opened the door to an enormous amount of data. If you have not looked at this tool, I encourage you to do so. Even if you looked at it a few years ago, take a little time to reexamine it. Out of all the tools I have mentioned in this article, this may be my favorite. With this tool, we can now work with GIS and CAD data in one environment!
Tool 9 – Map Books
Map books automate the process of breaking up our drawings into separate sheets for documentation and plotting purposes. As with many Civil projects, there are large areas we develop that do not fit onto one sheet, at least not at a scale that we can use. The map books function can assist with this issue. Map books can be used in sevFebruary 2011
Figure 5: Tool 10 – Feature Object Data
www.augiworld.com 21