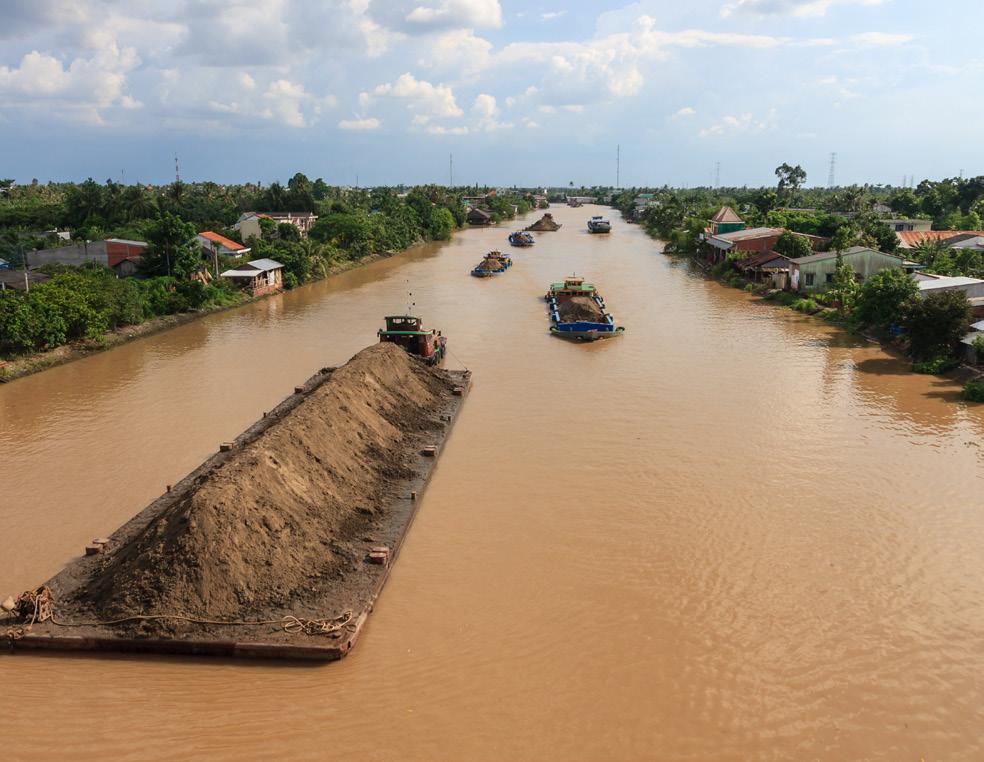
Increasing understanding and assessing impacts of development on social-ecological systems in the lower Mekong river basin by increasing access to integrated and visualized data, models, and decision-making tools.
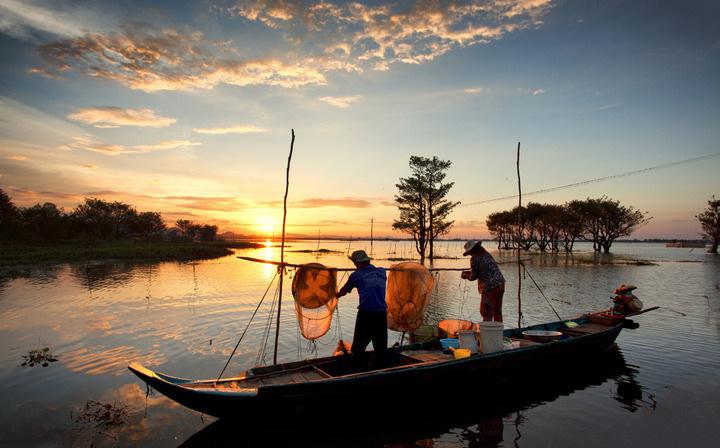
In the face of economic development pressure, better and more explicit understanding of the interactions between social and ecological systems of the Lower Mekong River Basin will benefit the understanding and decision making between citizens and local and national governments. In order to assist in local, natural resource decision making, the U.S. State Department, through their Mekong-U.S. Partnership, is partnering with the US Geological Survey (USGS) to increase the availability and predicative capacity of existing social, economic, groundwater, surface water, and other biophysical data. Policy makers and technical users will have the opportunity to gain greater understanding of potential decision making outcomes by exploring dynamically integrated data and models in an immersive, visualized, environment that reflects the priorities and perspectives of each stakeholder.
Methodology for Addressing the Issue
Under the guidance of the U.S. State Department, the USGS and Arizona State University, in cooperation with Mekong River Commission and assistance from Vietnamese and Cambodian university faculties, will build on existing regional research efforts while collecting and creating new information. Arizona State University’s Decision Theater® will integrate and conduct data analytics while visualizing available models and information in order to facilitate informed discussions and decision/policymaking. The Cambodia-Vietnam border area, from the Tonle Sap Great Lake to the sea, will be the initial geographic focus for groundwater, surface water, and socioeconomic data, information collection, and analysis.
The existing U.S. Army Corps of Engineers’ Shared Vision Planning (SVP), will be the first model adopted into the Decision Theater software framework. Ultimately, the existing USGS modular finite-difference flow model (MODFLOW), the macro-scale variable infiltration capacity (VIC) hydrologic model, and, a multi-year, daily time step, multi-crop simulation model (CropSyst) will be integrated into the overarching NexView project along with new data and information collected as part of the NexView program. Importantly, the NexView integrated framework will also include socioeconomic drivers and indicators (e.g. rice production and fishery catch). Using the Decision Theater integrated and visualized NexView, technical experts and policy makers alike will be able to manipulate and explore decision scenarios. The result will be a better understanding of the complex interrelated environment and social economic aspects of the Lower Mekong River Basin, as well as more informed stakeholder conversations regarding the consequences of decisions, before they are made.
Contacts

Jenna Shinen shinenjl@state.gov


This integrated and visualized social-ecological modeling approach, focusing on water resource management, is intended to increase international cooperation and informed decision making. Ultimately, it is intended to improve the livelihoods for the people living in and around the CambodiaVietnam border. Future efforts are expected to expand this pilot program’s geographic area of interest while identifying and filling information gaps, and adding other beneficial disciplines.
Matthew Andersen mandersen@usgs.gov
Jon Miller Jon.Miller@asu.edu
How does postsecondary attainment impact the state’s economy and workforce? What regions and individuals could benefit most from increased postsecondary attainment?
• Compare high school performance factors
• Identify barriers to graduation
The Decision Theater’s Achieve60AZ model analyzes the current state of post-secondary attainment across Arizona and calculates regional and state-wide outcomes of increased attainment.
• Explore possible interventions
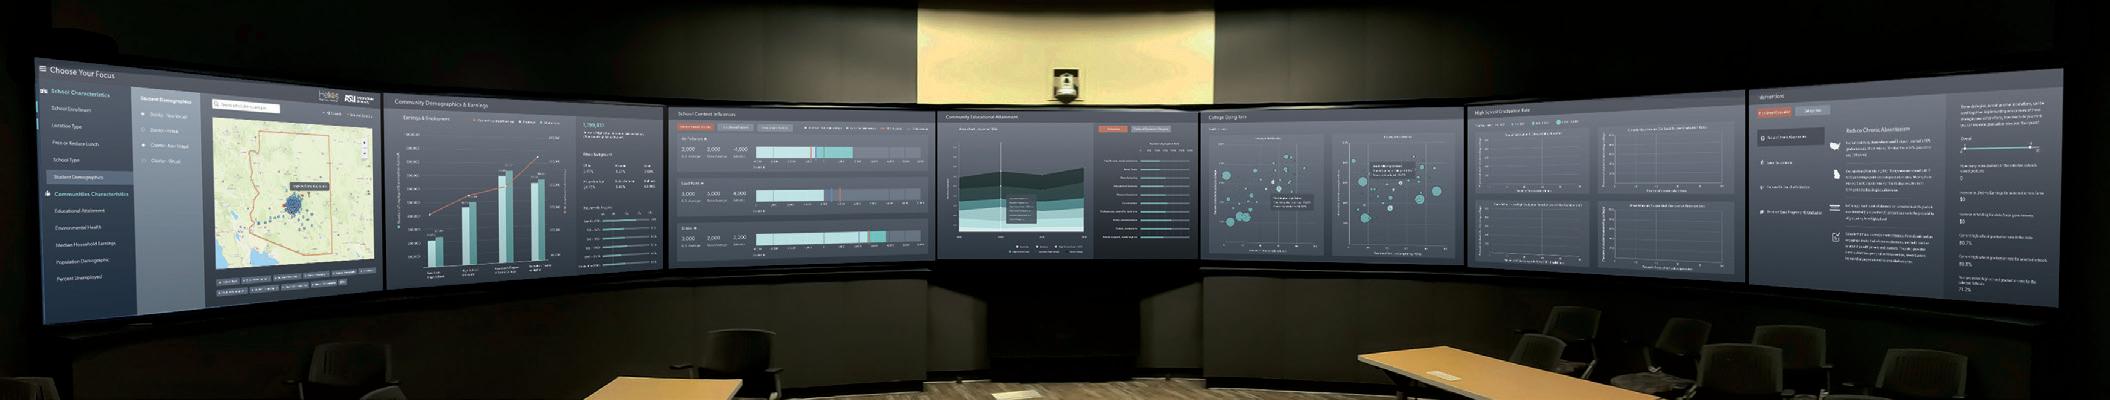
• Identify occupational vulnerabilities to automation
• Understand the economic impacts of post-secondary degree attainment
• Consider the future alignment of workforce availability and occupational demands
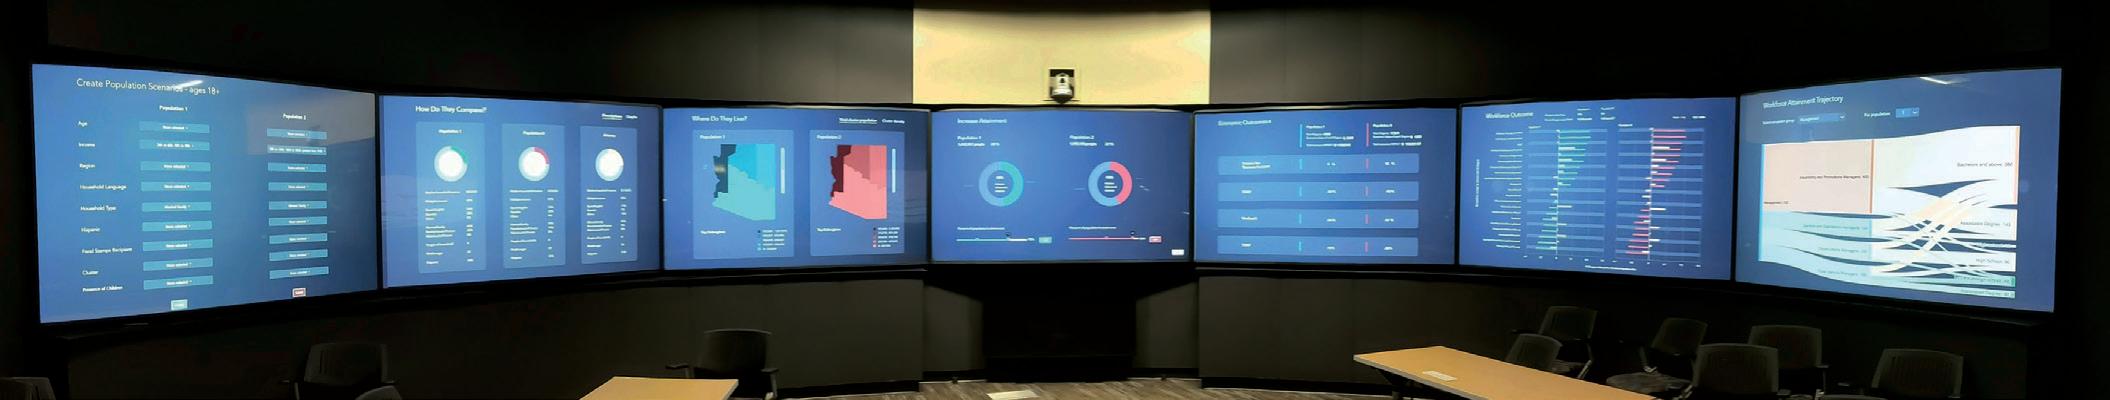
The Decision Theater’s education software models are developed in partnership with ASU’s Decision Center for Educational Excellence, Helios Education Foundation and the Arizona Board of Regents to support the goals of the Achieve60AZ Alliance.


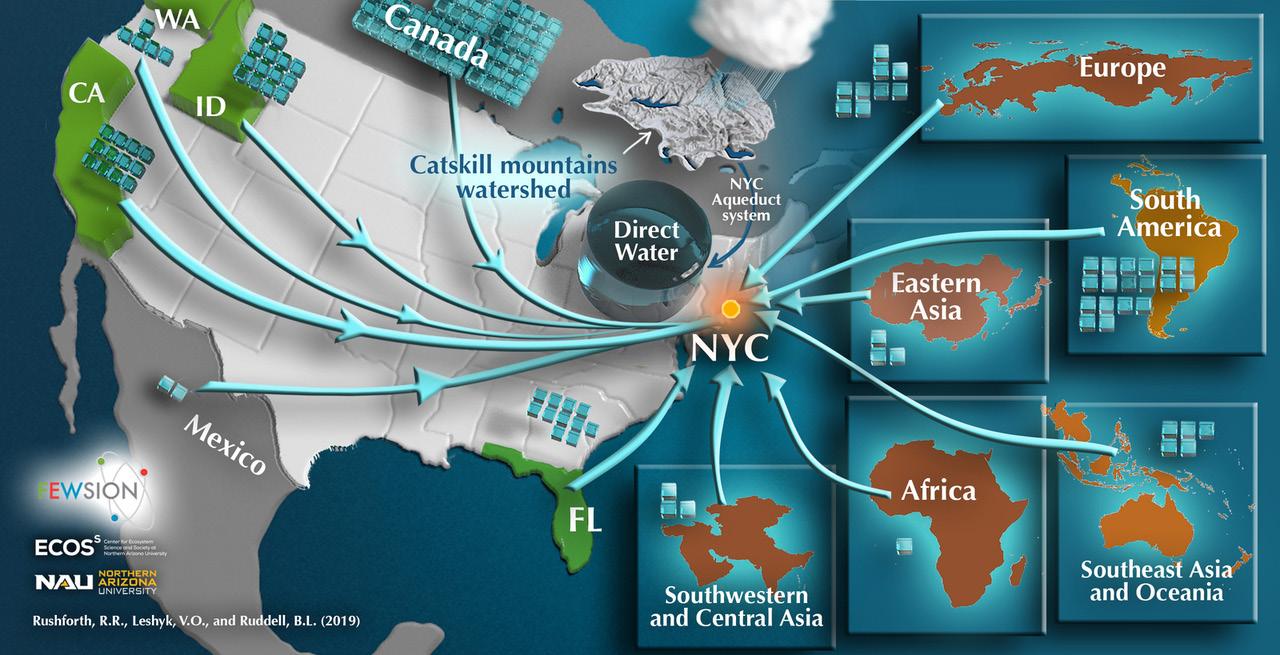
FEW-ViewTM Findings, what regions supply New York City’s FEW resources?
New York City is the world’s original Megacity, with a current population around 20 million people. The city sources food, energy and water from around the nation and world. It takes a country, and a planet, to supply it.
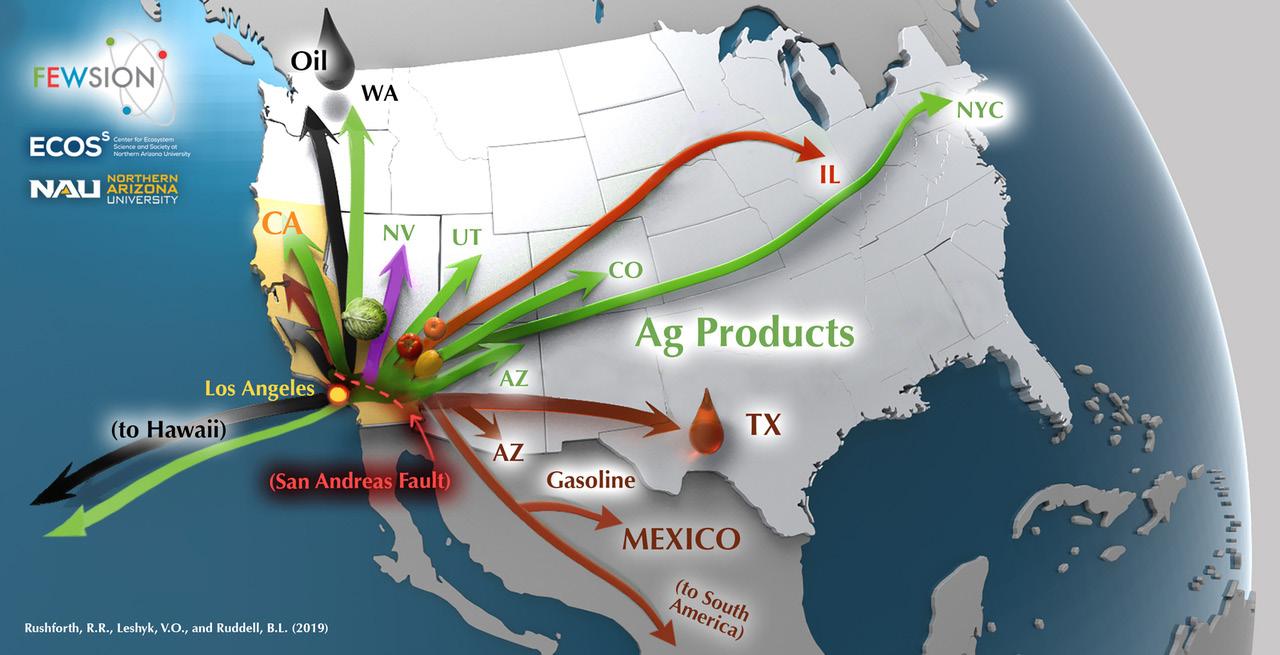
How could an L.A. earthquake affect global FEW supplies?
The San Andreas fault is a serious threat to Los Angeles. If highways, railroads and the Port of Los Angeles are seriously damaged, it could take years to regain the city’s major transportation hub. How much of your community’s supply chain passes through Los Angeles?
FEW-ViewTM Exploration
Users explore pre-set scenarios built by FEWSION™ researchers or set their own research questions to discover new findings. The tool’s benchmarking features present side-by-side comparisons of state and county commodity flows. Users can explore resilience, dependence and circularity analytics and export charts, data and insights in a PDF format.
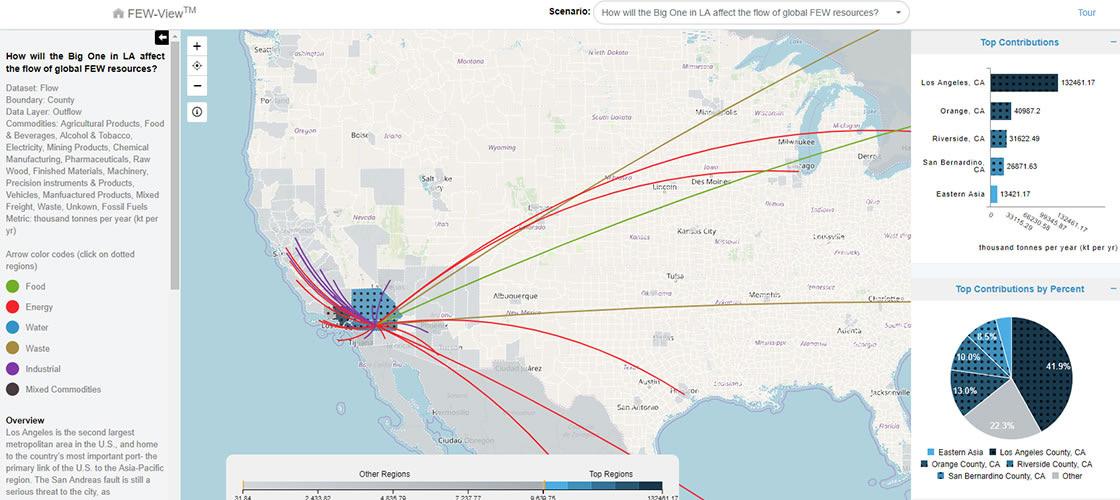
The core power of FEW-View™ rests in its backend computations. The tool processes millions of data points to display results in visual and consumable formats.
FEW-View™ is a web app built using modern JavaScript and PHP frameworks. It is an initiative of the FEWSION™ project, a collaboration between scientists at over a dozen universities. FEWSION™ was founded in 2016 by a grant from the INFEWS basic research program of the National Science Foundation (NSF) and the U.S. Department of Agriculture (USDA).
Follow the FEW exchange at fewsion.dtn.asu.edu
In Collaboration with


How has the earth’s land cover changed overtime?
What strategies can country leaders implement to revitalize degraded land?
What are the economic tradeoffs to interventions?
The Decision Theater environment allows groups with multiple perspectives and anchored positions to objectively and simultaneously examine data driven trade-offs and outcomes. Interacting with the model in the Decision Theater, participants are able to make their own discoveries and investigate possible futures, leading to more informed decisions.”
Rahul Salla Technical Director, The Decision Theater
Land degradation is a global challenge. Loss of productive land contributes to climate change, environmental hazards, food scarcity, economic and social turmoil, and the loss of biodiversity and ecosystem services. Without intervention, degraded land will continue to impact increasing numbers of humans, endangered species and the climate, and will present new challenges to stable governance.
Degradation’s widespread nature and regional intricacies present a challenge to implement restoration strategies tailored to the unique characteristics of an area.
The Decision Theater’s WorldEDIT informs leaders of existing land degradation trends and provides mechanisms to virtually experiment with proposed interventions. The tool assists in the development of mitigation strategies providing the greatest impact to people, species, and the climate while balancing economic investment and return.
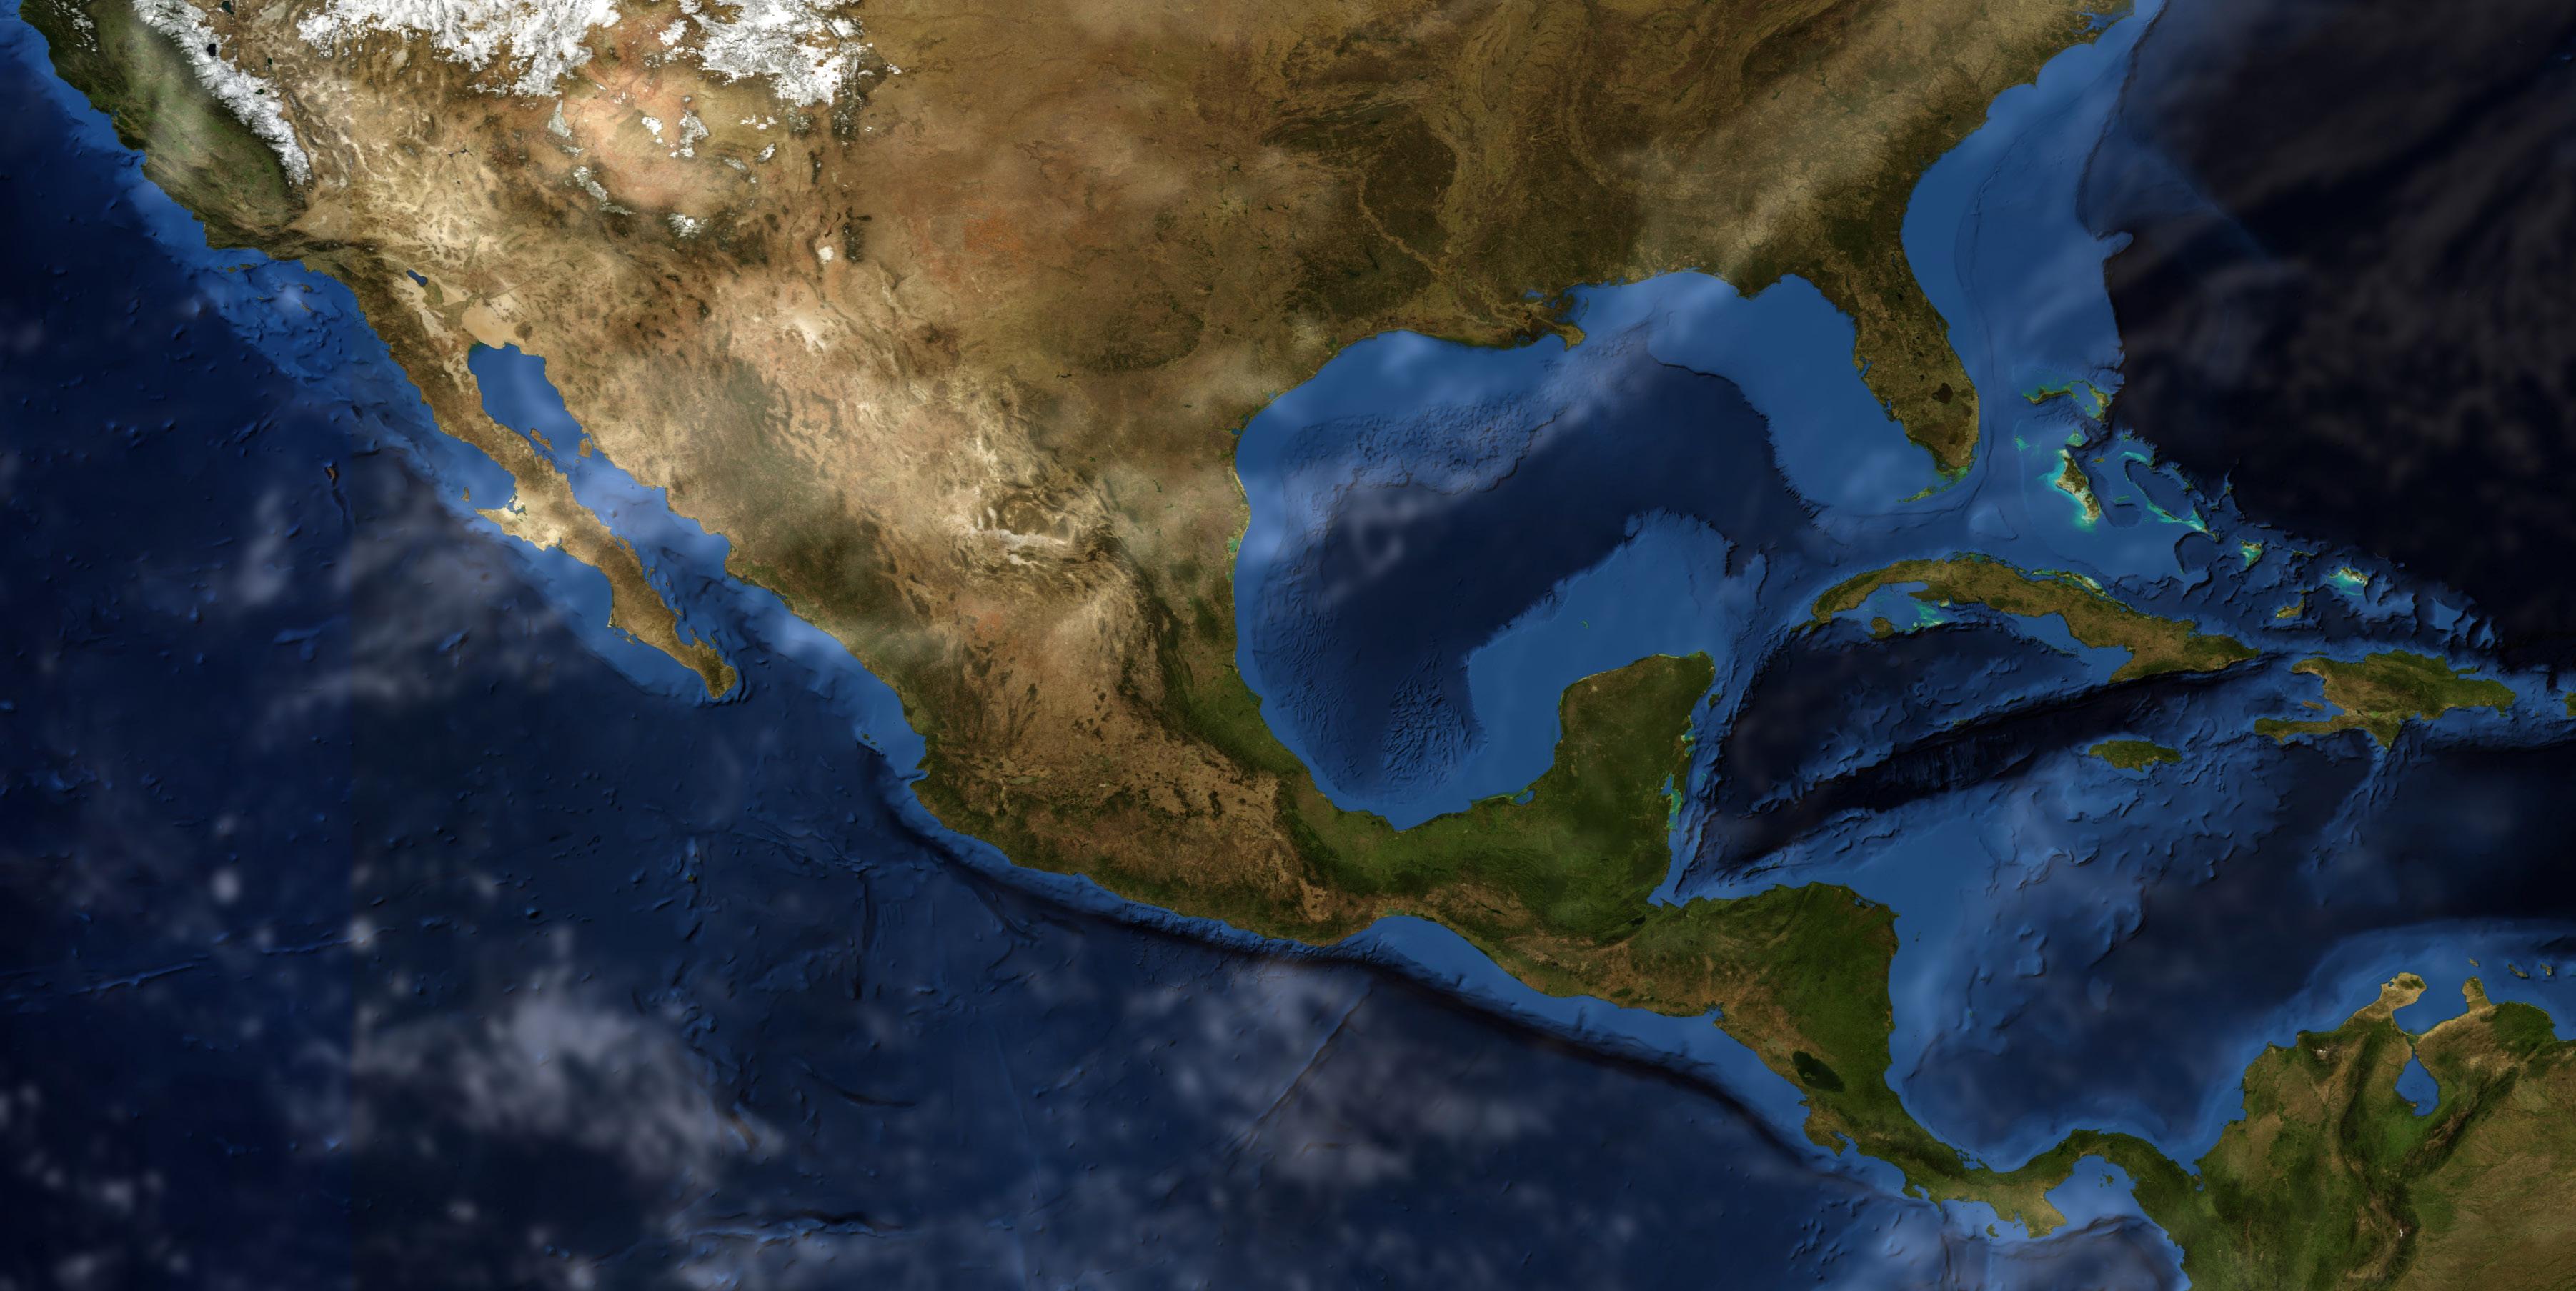
Mitigating marine biodiversity loss in coastal regions
Marine resources play an important role in the economies of coastal regions. Greater biodiversity contributes to a greater number of physical, biological, and non-extractive resources. The decline of marine plants and animals can lead to conflict over resources and adversely impact these regions. It is critical to understand how human activity affects marine life so that restoration and recovery initiatives can be made effectively. The Gulf of Mexico decision-support tool developed by the Decision Theater team allows stakeholders to examine specific areas within the Gulf, identify which species are in that area, and assess the risks for those species.
The Gulf of Mexico Marine Biodiversity Vulnerability tool demonstrates the species-based consequences of development and oil rig operation along the gulf coast. Decision Theater partnered with the Center for Biodiversity Outcomes in the ASU School of Sustainability to incorporate their research on species vulnerability into a visualized, usable software tool. The species vulnerability index, which powers this tool’s findings, gives a first-ever comprehensive ranking for life in the region and offers a new metric for decision makers to consider. Through geospatial informatics, stakeholders are able to fully visualize where vulnerabilities lie within the Gulf of Mexico. This enables them to better prioritize species, habitat, and ecosystem conservation and restoration when making operational planning decisions.
Decision-makers need to make decisions within resource constraints and regions. They need to know what species are in an area and what their vulnerability is to extinction or threats. There are so many questions you can ask of this data in terms of management and decision science to help facilitate decision making.”
Dr. Beth Polidoro
Associate Director of the Center for Biodiversity Outcomes ASU School of Sustainability
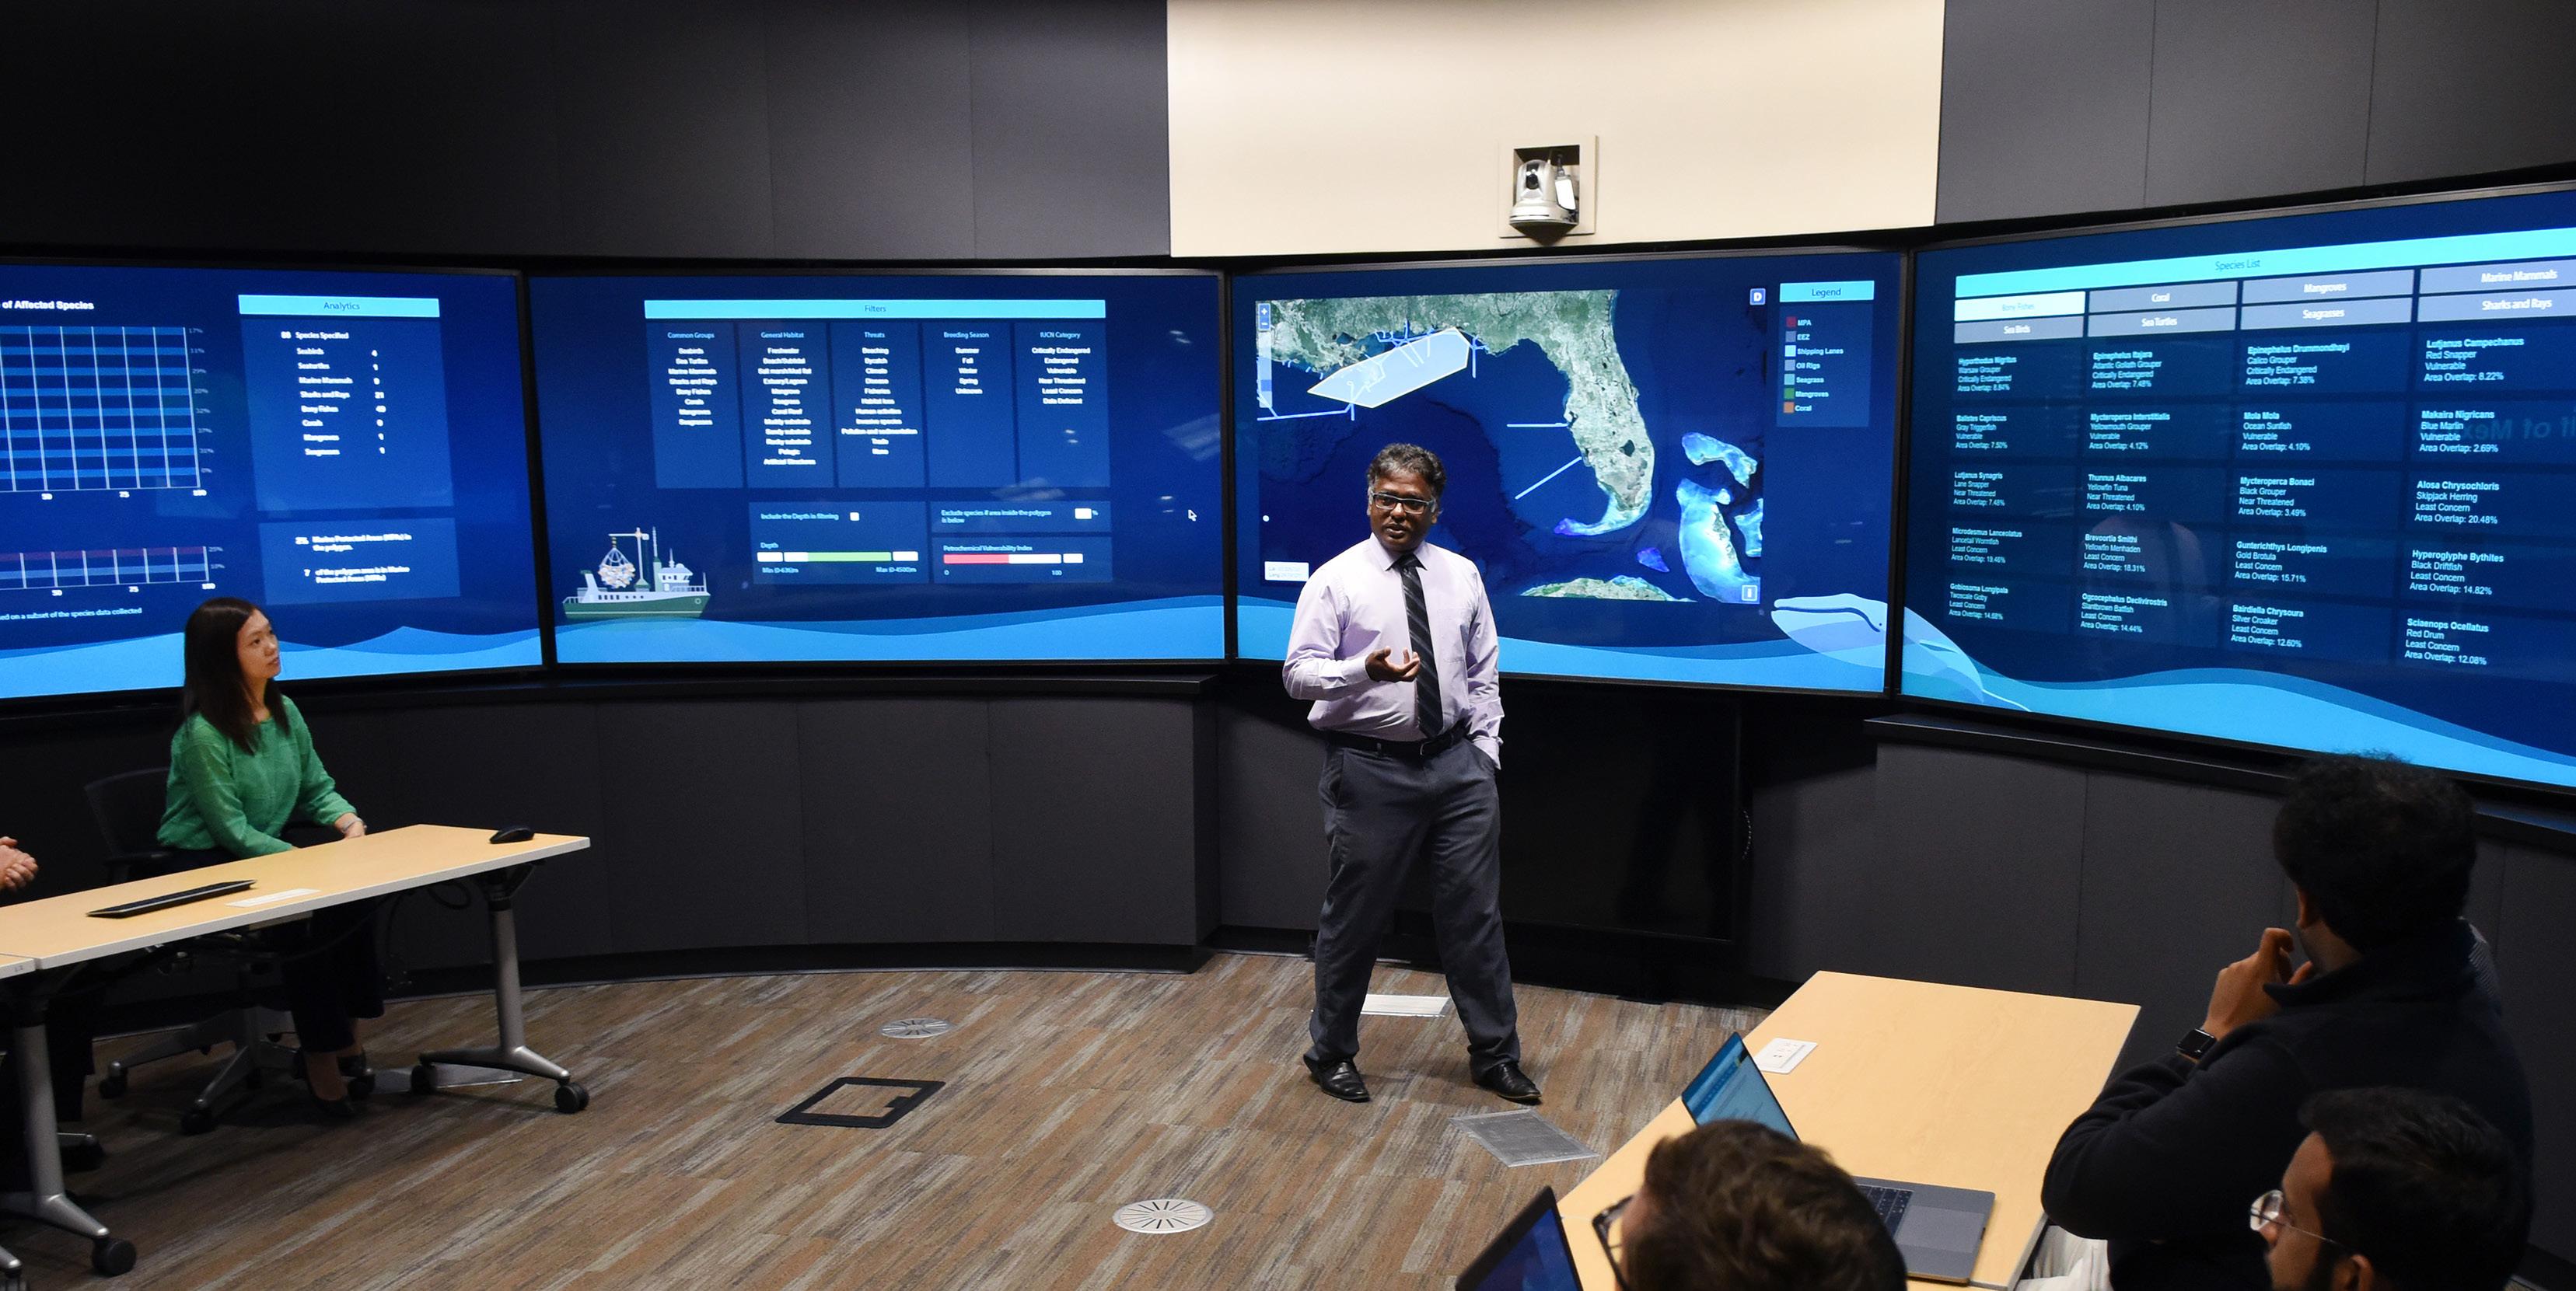
This tool maps Marine Protected Areas, existing oil rigs, and shipping lanes to demonstrate the species-based consequences of developing oil rigs along the gulf coast. A geospatial area can be selected from the map to show information for the species that live in that area, including their IUCN Red List Categories, population status, and distribution, use in trade, common threats, and conservation measures. Data filters allow stakeholders to strategize their course of action while maximizing biodiversity conservation in the selected region. The current iteration of the model serves as a prototype that allows researchers to demonstrate the value of this index to a wide audience of stakeholders in a format that allows them to interact with the data, play what if scenarios, and determine how this information could be used for their own decision-making purposes.
As research in the Gulf continues, new data can be incorporated into the tool’s framework to give a more complete view of the region. Information for a larger variety of species, as well as indexes for different vulnerabilities such as petrochemical exposure or the presence of microplastics, can be integrated into the tool. The species vulnerability index and decision-support research is not constrained to the habitats within the Gulf of Mexico region. Data and index rankings for resilience are available for an extensive range of species across the world, and the Decision Theater’s software framework can be repurposed and customized for diverse audiences. Researchers, stakeholders, and policy makers in other regions, such as the Persian Gulf, can work with the Decision Theater to develop a tool tailored to their environment’s unique nuances and needs.
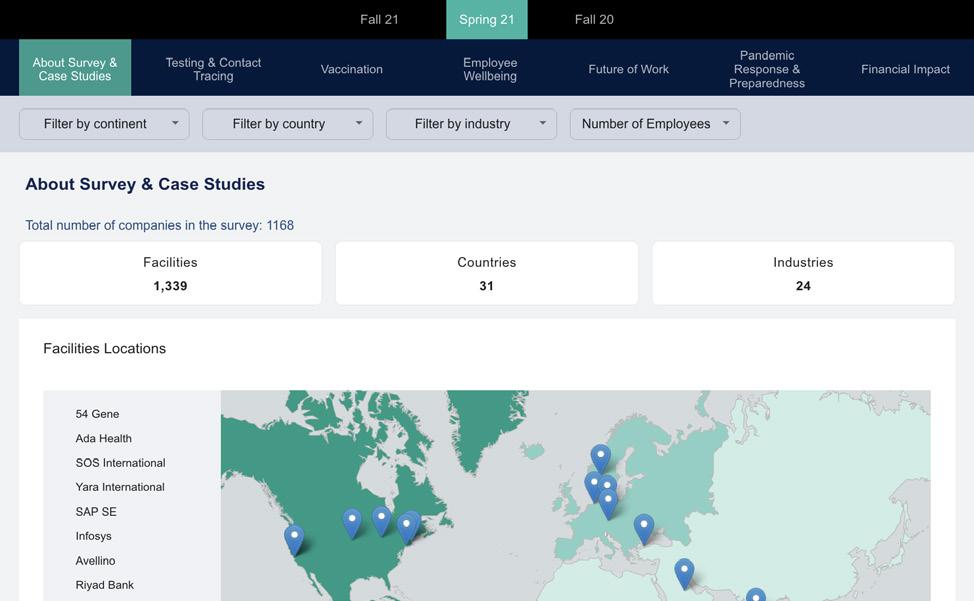
The COVID-19 Diagnostics Commons hosts a repository of information on COVID-19 research, testing methods, and workplace practices. This information has been collated and organized for individuals and organizations to move forward with evidence and data-based practices. The Commons is divided into several categories, including Workplace Commons and Testing Commons, both of which provide interactive dashboards for searchable information to suit the custom needs of wide-ranging audiences. The Workplace Commons presents data collected from an industry survey of more than 1,000 worldwide back-to-workplace policies, testing practices, and priorities. The dashboard synthesizes survey results for users to field categories such as type of workplace, facility safety measures, and financial impact.
The Workplace Commons dashboard filters by location and industry for users to further relate the available data to their own workplace applications and needs. The information here allows organizations to build and adjust their processes amid the pandemic according to the trials and errors of fellow workplaces around the globe.
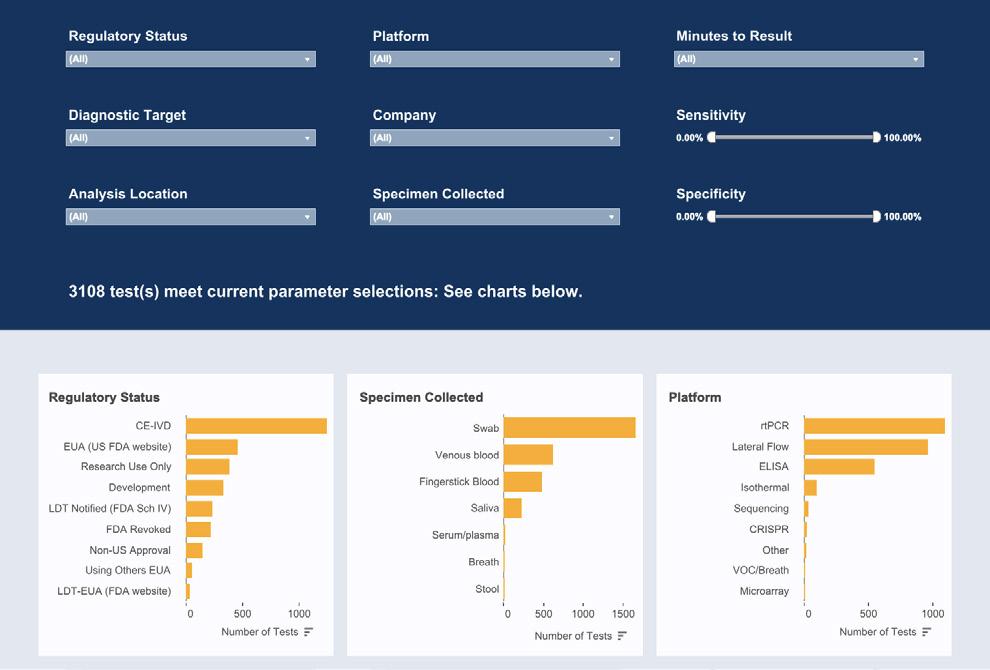
The Testing Commons dashboard gives users easy access to a searchable, interactive database of global COVID-19 tests, providing details on multiple parameters including test type, development maturity, technology, regulatory status, and country of origin. Testing Commons frequently updates to present current data and has gained national and international acclaim for its first of its kind value.
Additionally, ASU has hosted several webinars for COVID-19 practices, where Decision Theater’s contributions have been featured prominently. The extensive media references of the Diagnostics Commons by publications such as the Wall Street Journal, Washington Post, National Geographic, The Atlantic, The New York Times, Popular Science and many more are a testament to the value of a common repository for the global community.
The dashboards in Diagnostic Commons address the needs of today by synthesizing and visualizing complex data and research in a comprehensive format. In rapidly evolving situations such as the COVID-19 pandemic, Decision Theater can quickly develop helpful dashboards for any kind of data, including survey responses, that will help the public move forward in combatting evolving crises

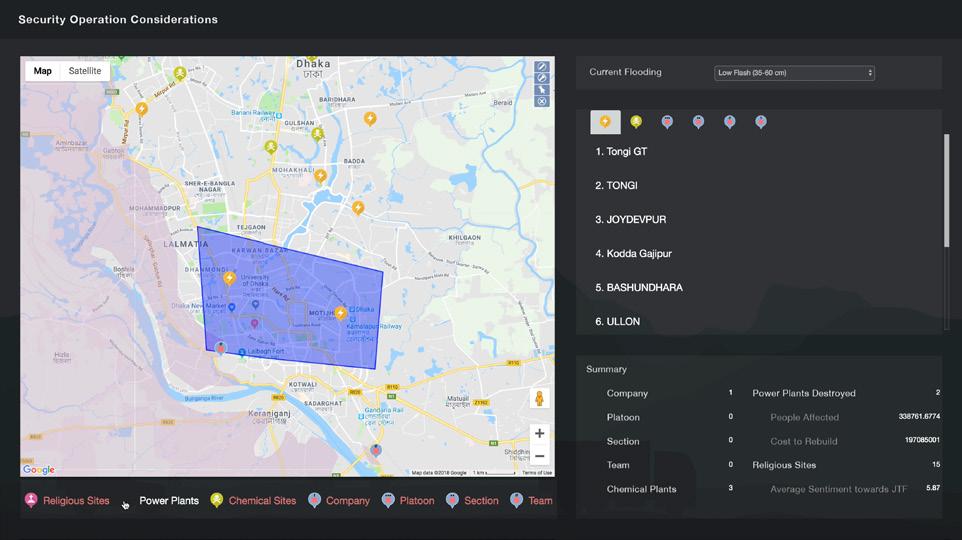
By integrating web-based map and weather services, this tool presents location data of nearby emergency services, current weather conditions, and available land cover.
A transportation and flooding model estimates travel time to emergency services by calculating regional flooding probability and its impact on transportation routes.
An agent-based model simulates possible security threats based on existing demographic and organizational data as well as communication patterns.
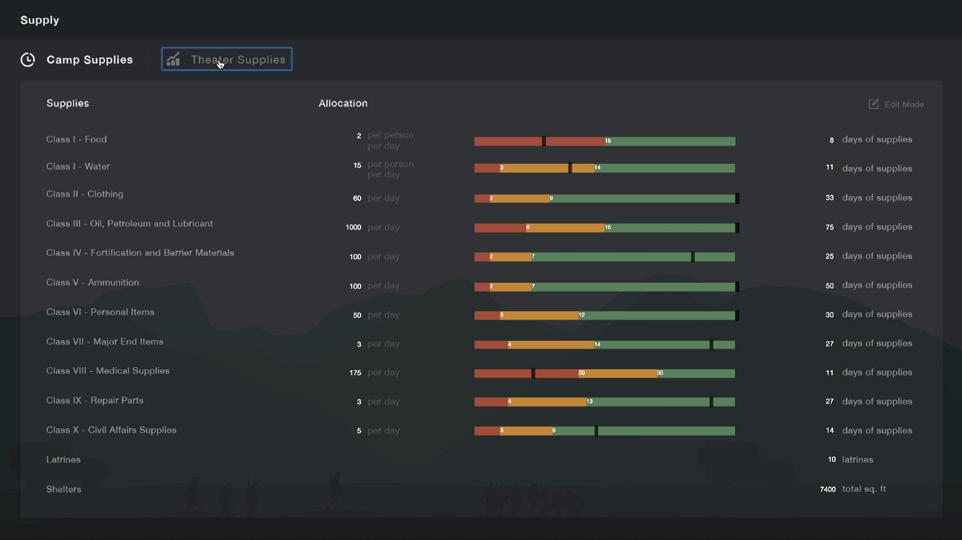
Operatives provide existing resource data to monitor the use and delivery of supplies to the region. Data on local affiliate organizations is organized through a network visualization graph to present their expertise, contact information, and relationship to other assistance organizations.
This data-ready model can be customized to inform new situational awareness needs, offering flexible solutions to a wide range of conflicts.
Each scenario is loaded in a flexible decision tree framework. Each player assumes their role as an advisor or Ambassador and follows the training’s events and action prompts.
• Full day training follows a crawl/walk/run approach
• Choices made in the game trigger customized flags and outcomes
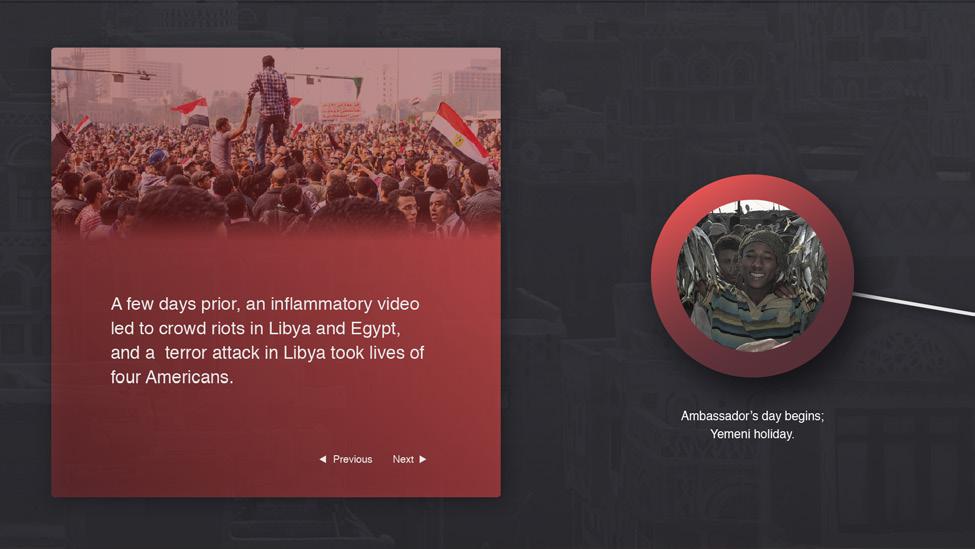

Each game is led by a trained facilitator,as well as a Senior Mentor with experience in the field. The Senior Mentor provides advice and feedback to the Ambassador trainee as needed throughout decision points in each scenario.
• Each game event opens opportunities for discussion and learning
• Trainees can return to key decision points and re-play outcomes throughout the game
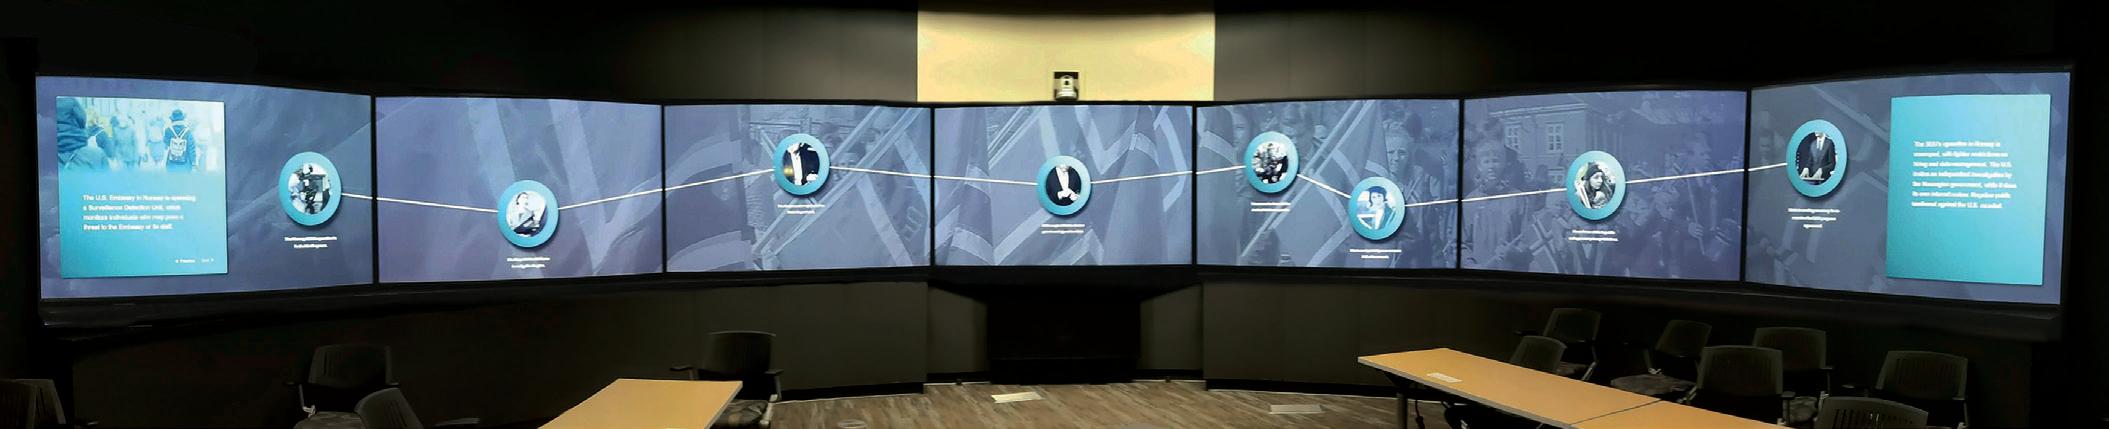
Training sessions conclude with a Reflection panel, where the choices the Ambassador trainee made in the game are summarized and discussed. Diplomatic Security Officers and newly assigned ambassadors have the opportunity to reflect on the decisions made and discuss alternative approaches in the future.
This model was developed by the Decision Theater’s team of software engineers, game designers, curriculum experts, and graphic artists in partnership with retired ambassadors and diplomatic security experts from the American Academy of Diplomacy.
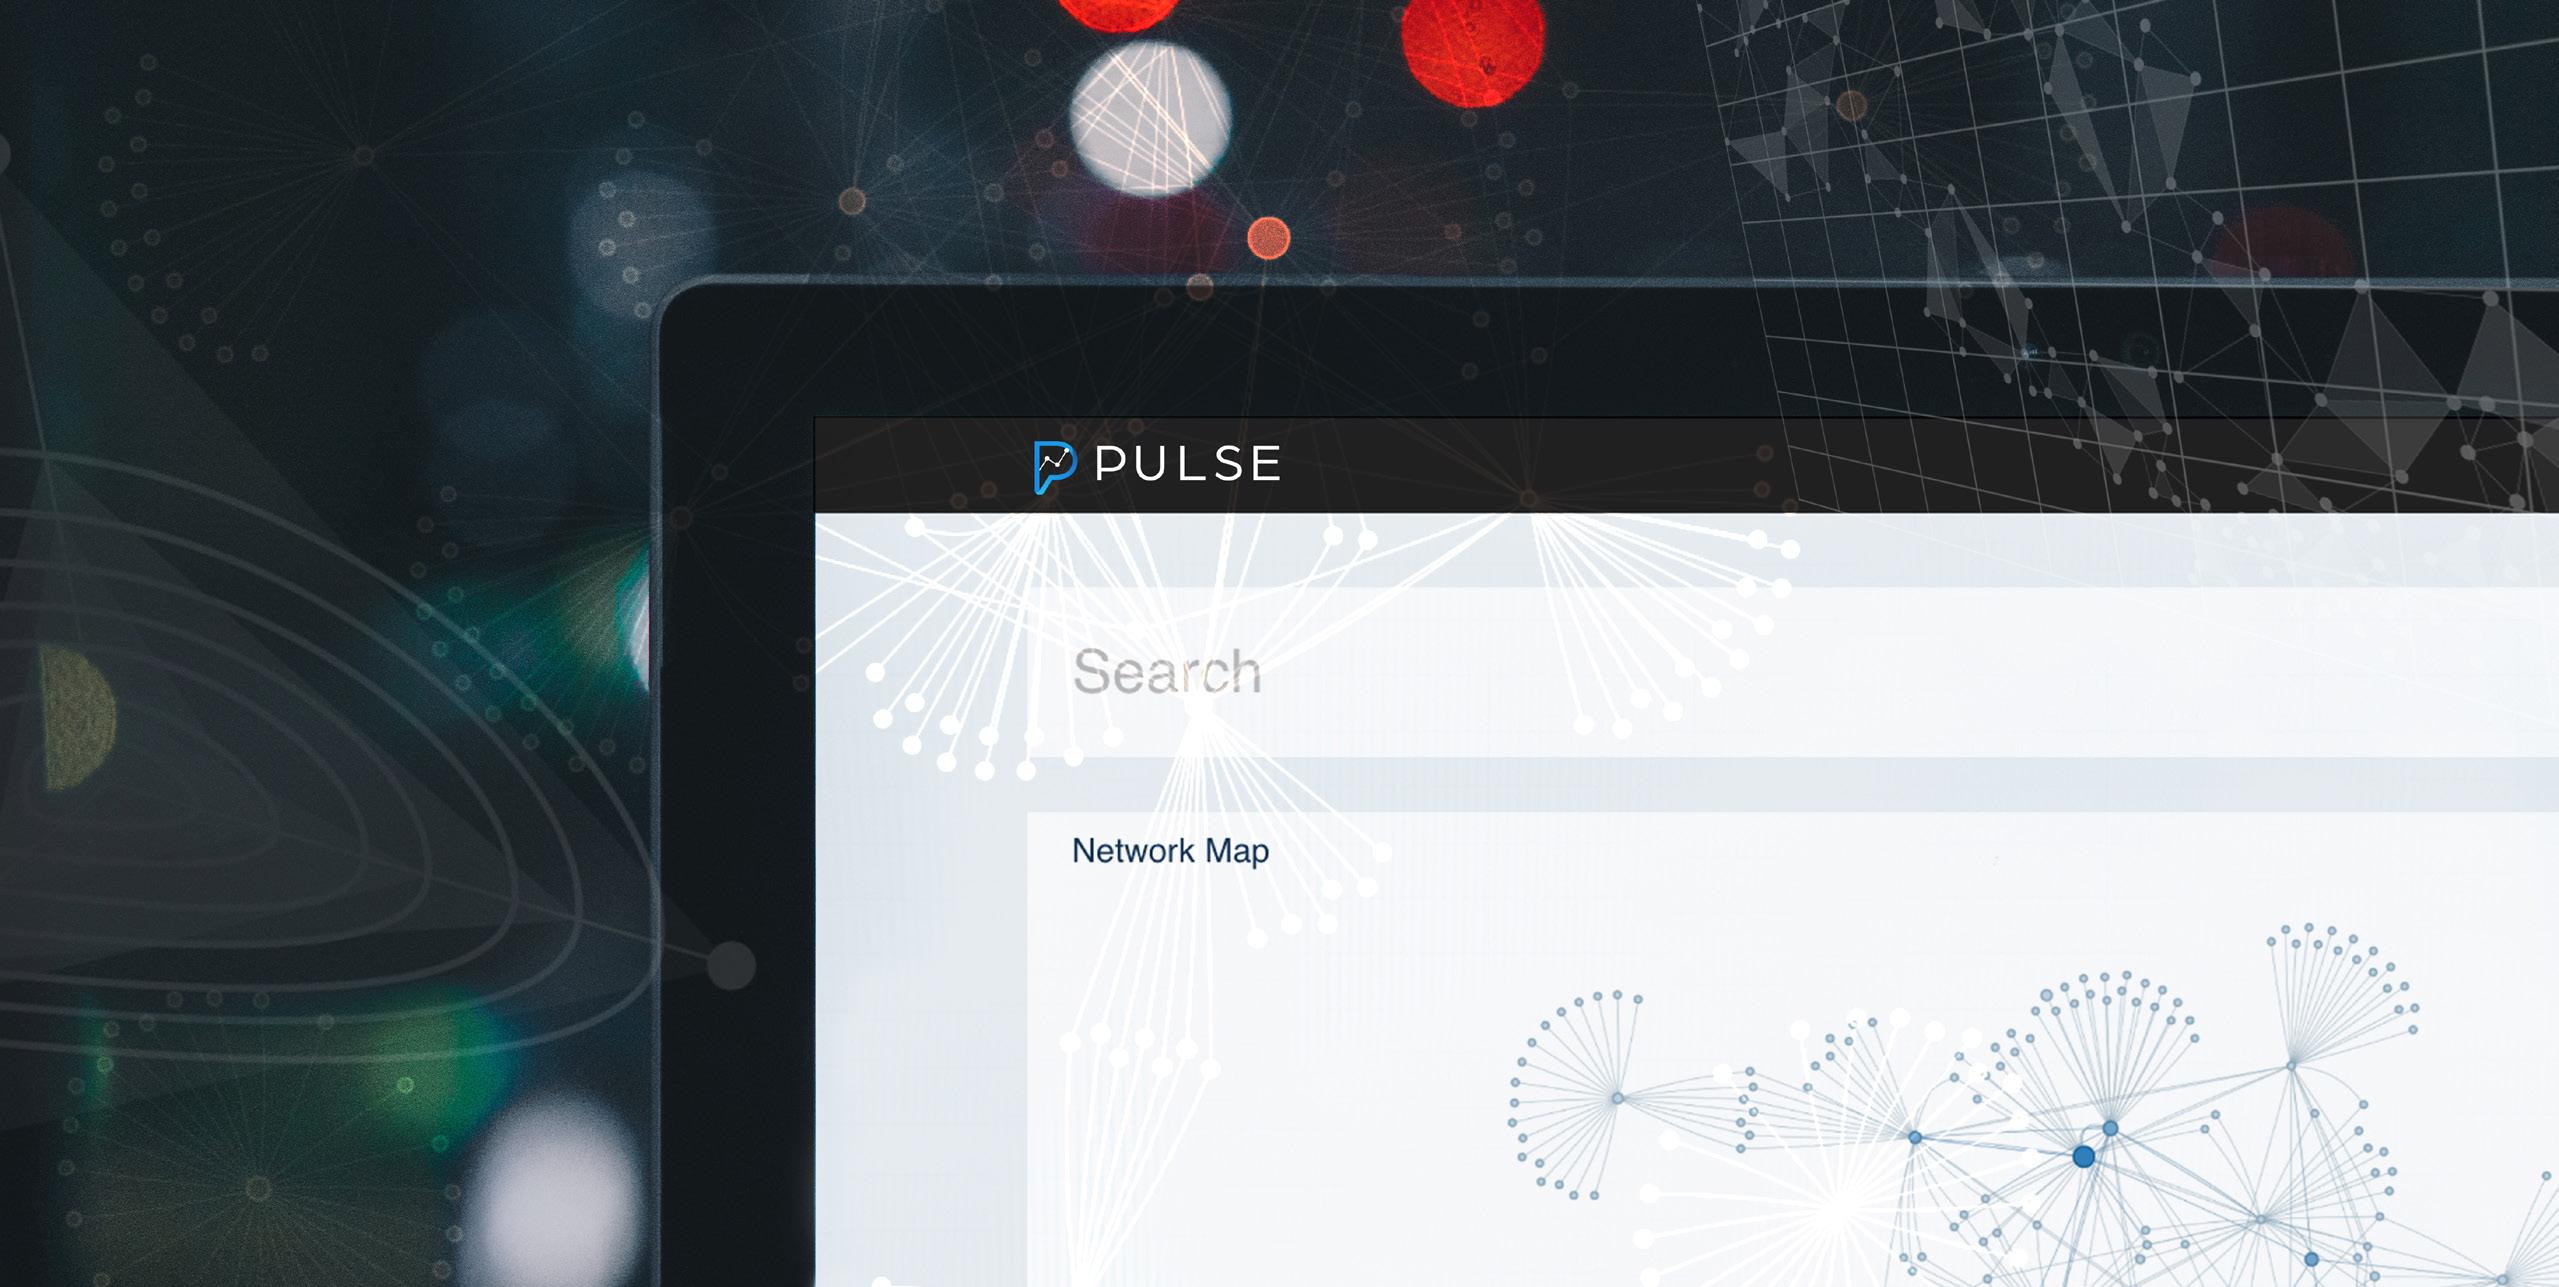
Uncover critical insights into digital networks with PULSE
The Decision Theater’s information integration and network analysis platform enables powerful custom research for web-based investigations. PULSE speeds through social media posts, journal publications, databases and more to capture key information and their implications, perform a variety of analyses, determine implications and visualize the results.
In the modern world, communication across social networking systems has become a primary form of expression, response and feedback. Individuals and organizations are constantly sharing mass amounts of new information and communicating across digital exchanges. Each tweet, Facebook post or Instagram story captures small pieces of life connected to user data, social network, and topics of conversation. Within the barrage of media posts exists undiscovered insight into prevailing public opinion. Websites, traditional databases, and other information sources are repositories of valuable data. PULSE navigates through the data chaos to extract meaningful information for action.
Findings derived from PULSE can be used for a variety of purposes depending on the needs of the user:
• Policy making based on public opinion
• Sales initiatives of a company
• Social science research
• Gauging interest for a product or idea
PULSE offers analytical technology to collect, categorize, analyze and visualize social network data as it is posted in real time.
To harness these investigative powers, users identify key terms, search parameters, and research objectives associated with their topic of study. Researchers at the Decision Theater help determine the mechanisms for analysis and implement appropriate algorithms to gather and sort information.
Data mining from traditional and non-traditional sources:
In Collaboration with

PULSE delivers visualized findings across a customdeveloped graphic dashboard. Decision Theater researchers work closely with users to identify appropriately tailored visualization techniques to communicate newfound insights.
The parameters, search terms and visual components change with each new project. However, ability to uncover granular insight while filtering out irrelevant data sustains across all applications.
Available data analytics:


Same construct; different space
The Decision Theater in Washington D.C. mirrors the architectural and technological setup of the Tempe facility, allowing for seamless transition between locations. As research teams in Tempe, AZ develop analytic software models, leaders in Washington D.C. Decision Theater facilities convene to gain better understanding of complex problems and weigh the advantages and disadvantages and consequences of alternative decisions.
The Power of the
Development of Decision Theater products occur in Tempe, AZ through collaboration between:
Complex, large-scale problems require creative and coordinated action. The stronger the networks of data-based, collaborative approaches grow, the more powerful and targeted the solutions.
Real-time synchronization
Information Technology experts in the Washington D.C. facility drive the audio/visual needs, leverage Decision Theater-Tempe developed and integrated models to engage Washington based influencers and decision makers. High speed internet connections provide access to high performance computing and browsers that synchronize, in real-time, shared content and engagements between decision makers, researchers, stakeholders in Tempe and global members of the Decision Theater Network nodes.

Deliberative Facilitation in Washington, D.C
Interactive software models stream from Tempe servers directly into the Washington D.C. Theater for:
Policy experimentation for complex problems
Remote engagements over shared findings
The integration between ASU Tempe Decision Theater and Washington D.C. serves as a model for other Decision Theater Network nodes around the world. As a partner of the Decision Theater Network, universities and organizations throughout the United States and the globe have the power to build and utilize similar or custom design capabilities for their unique purposes.
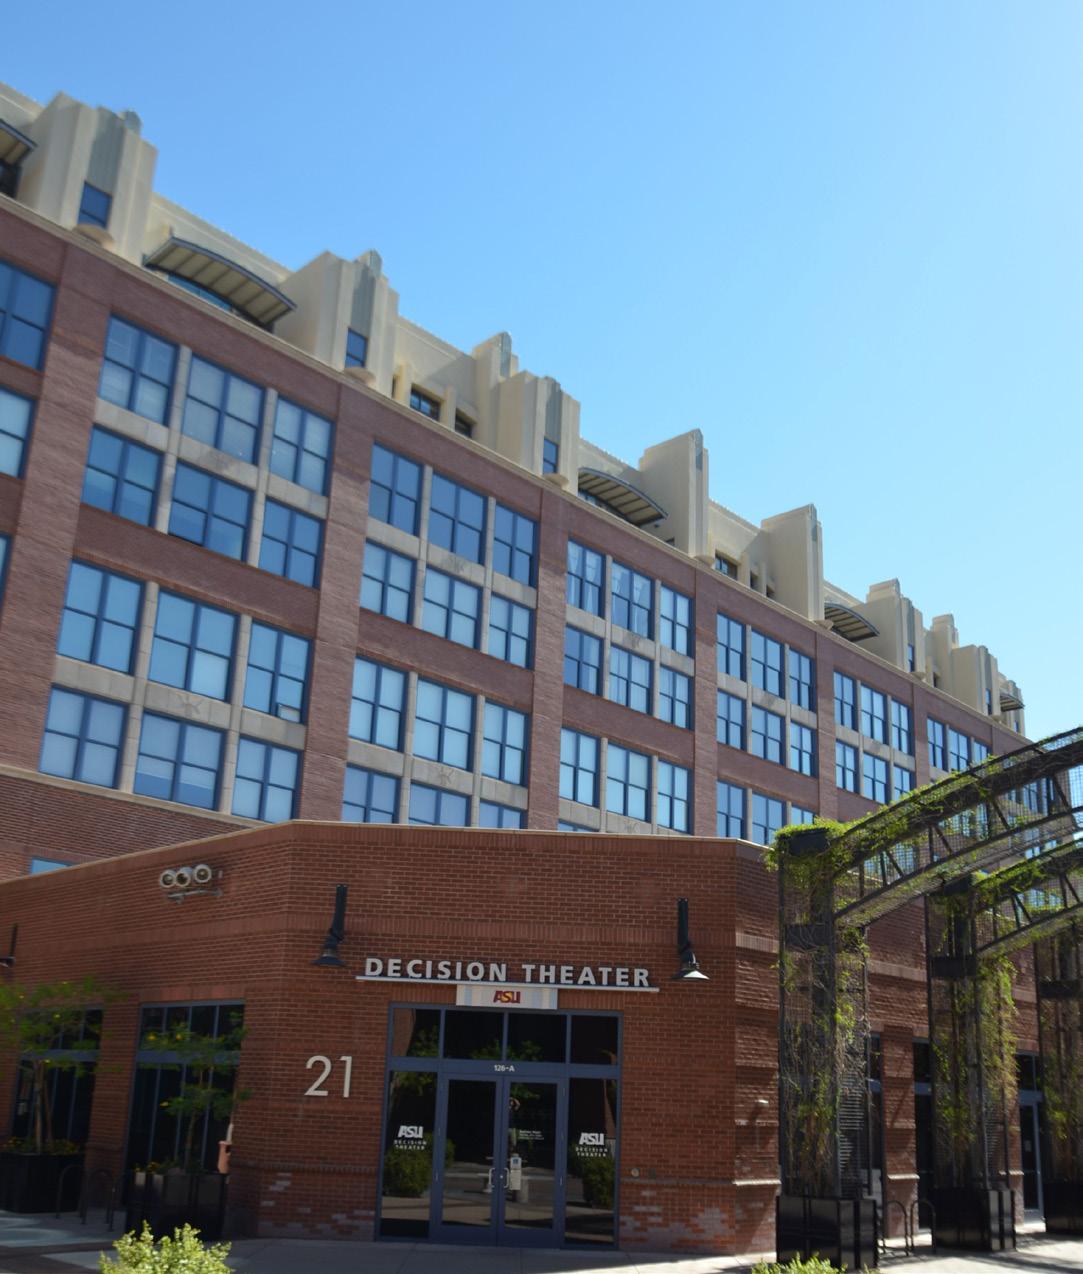
The Arizona State University (ASU) Decision Theater (DT) is a university resource supporting and enabling research activities through data visualization, predictive modeling, and expert multi discipline and stakeholder analytics.
The creativity and innovation Decision Theater brings to each project elevates the possibilities, and brings ideas alive.”
Dominique Roe-Sepowitz Associate Professor, ASU School of Social Work
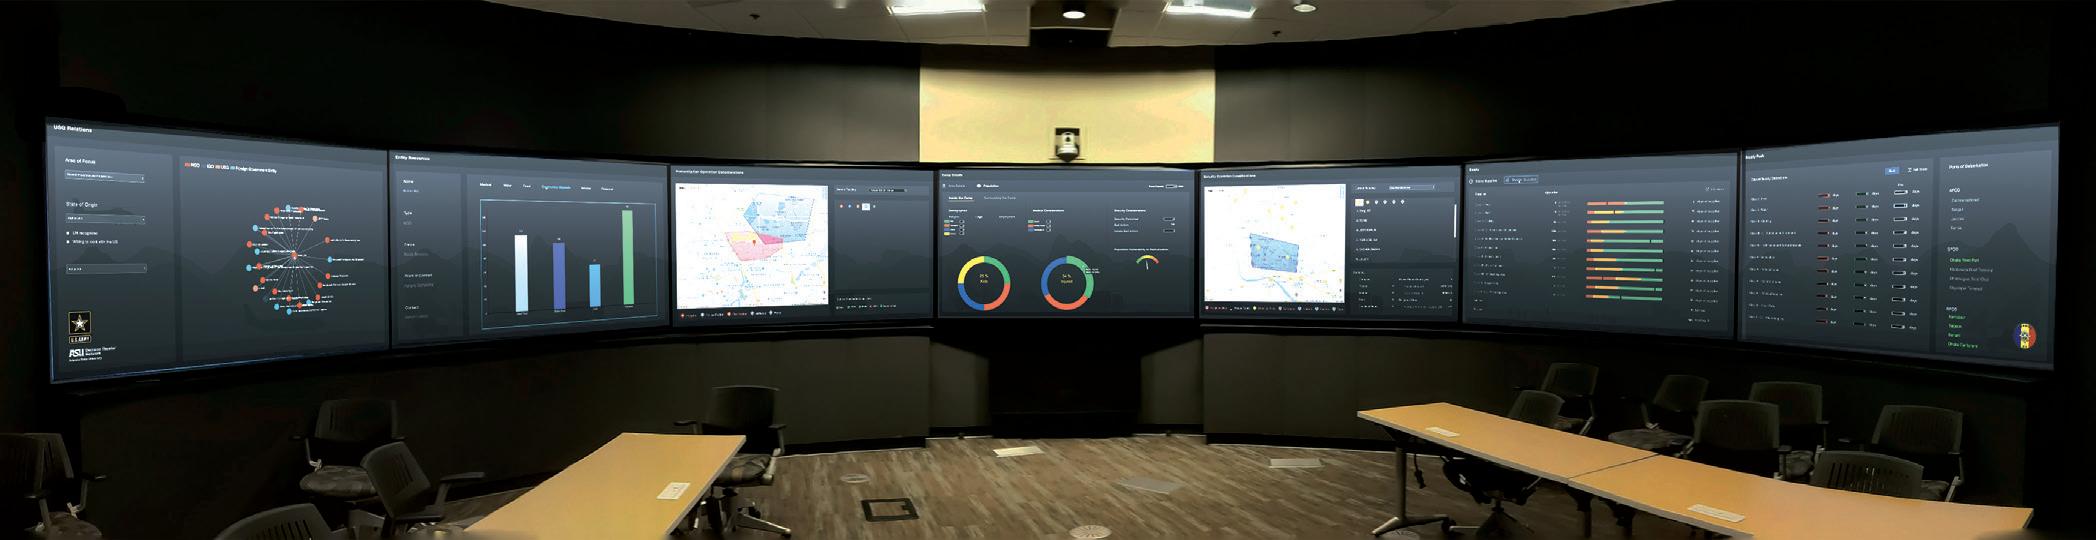
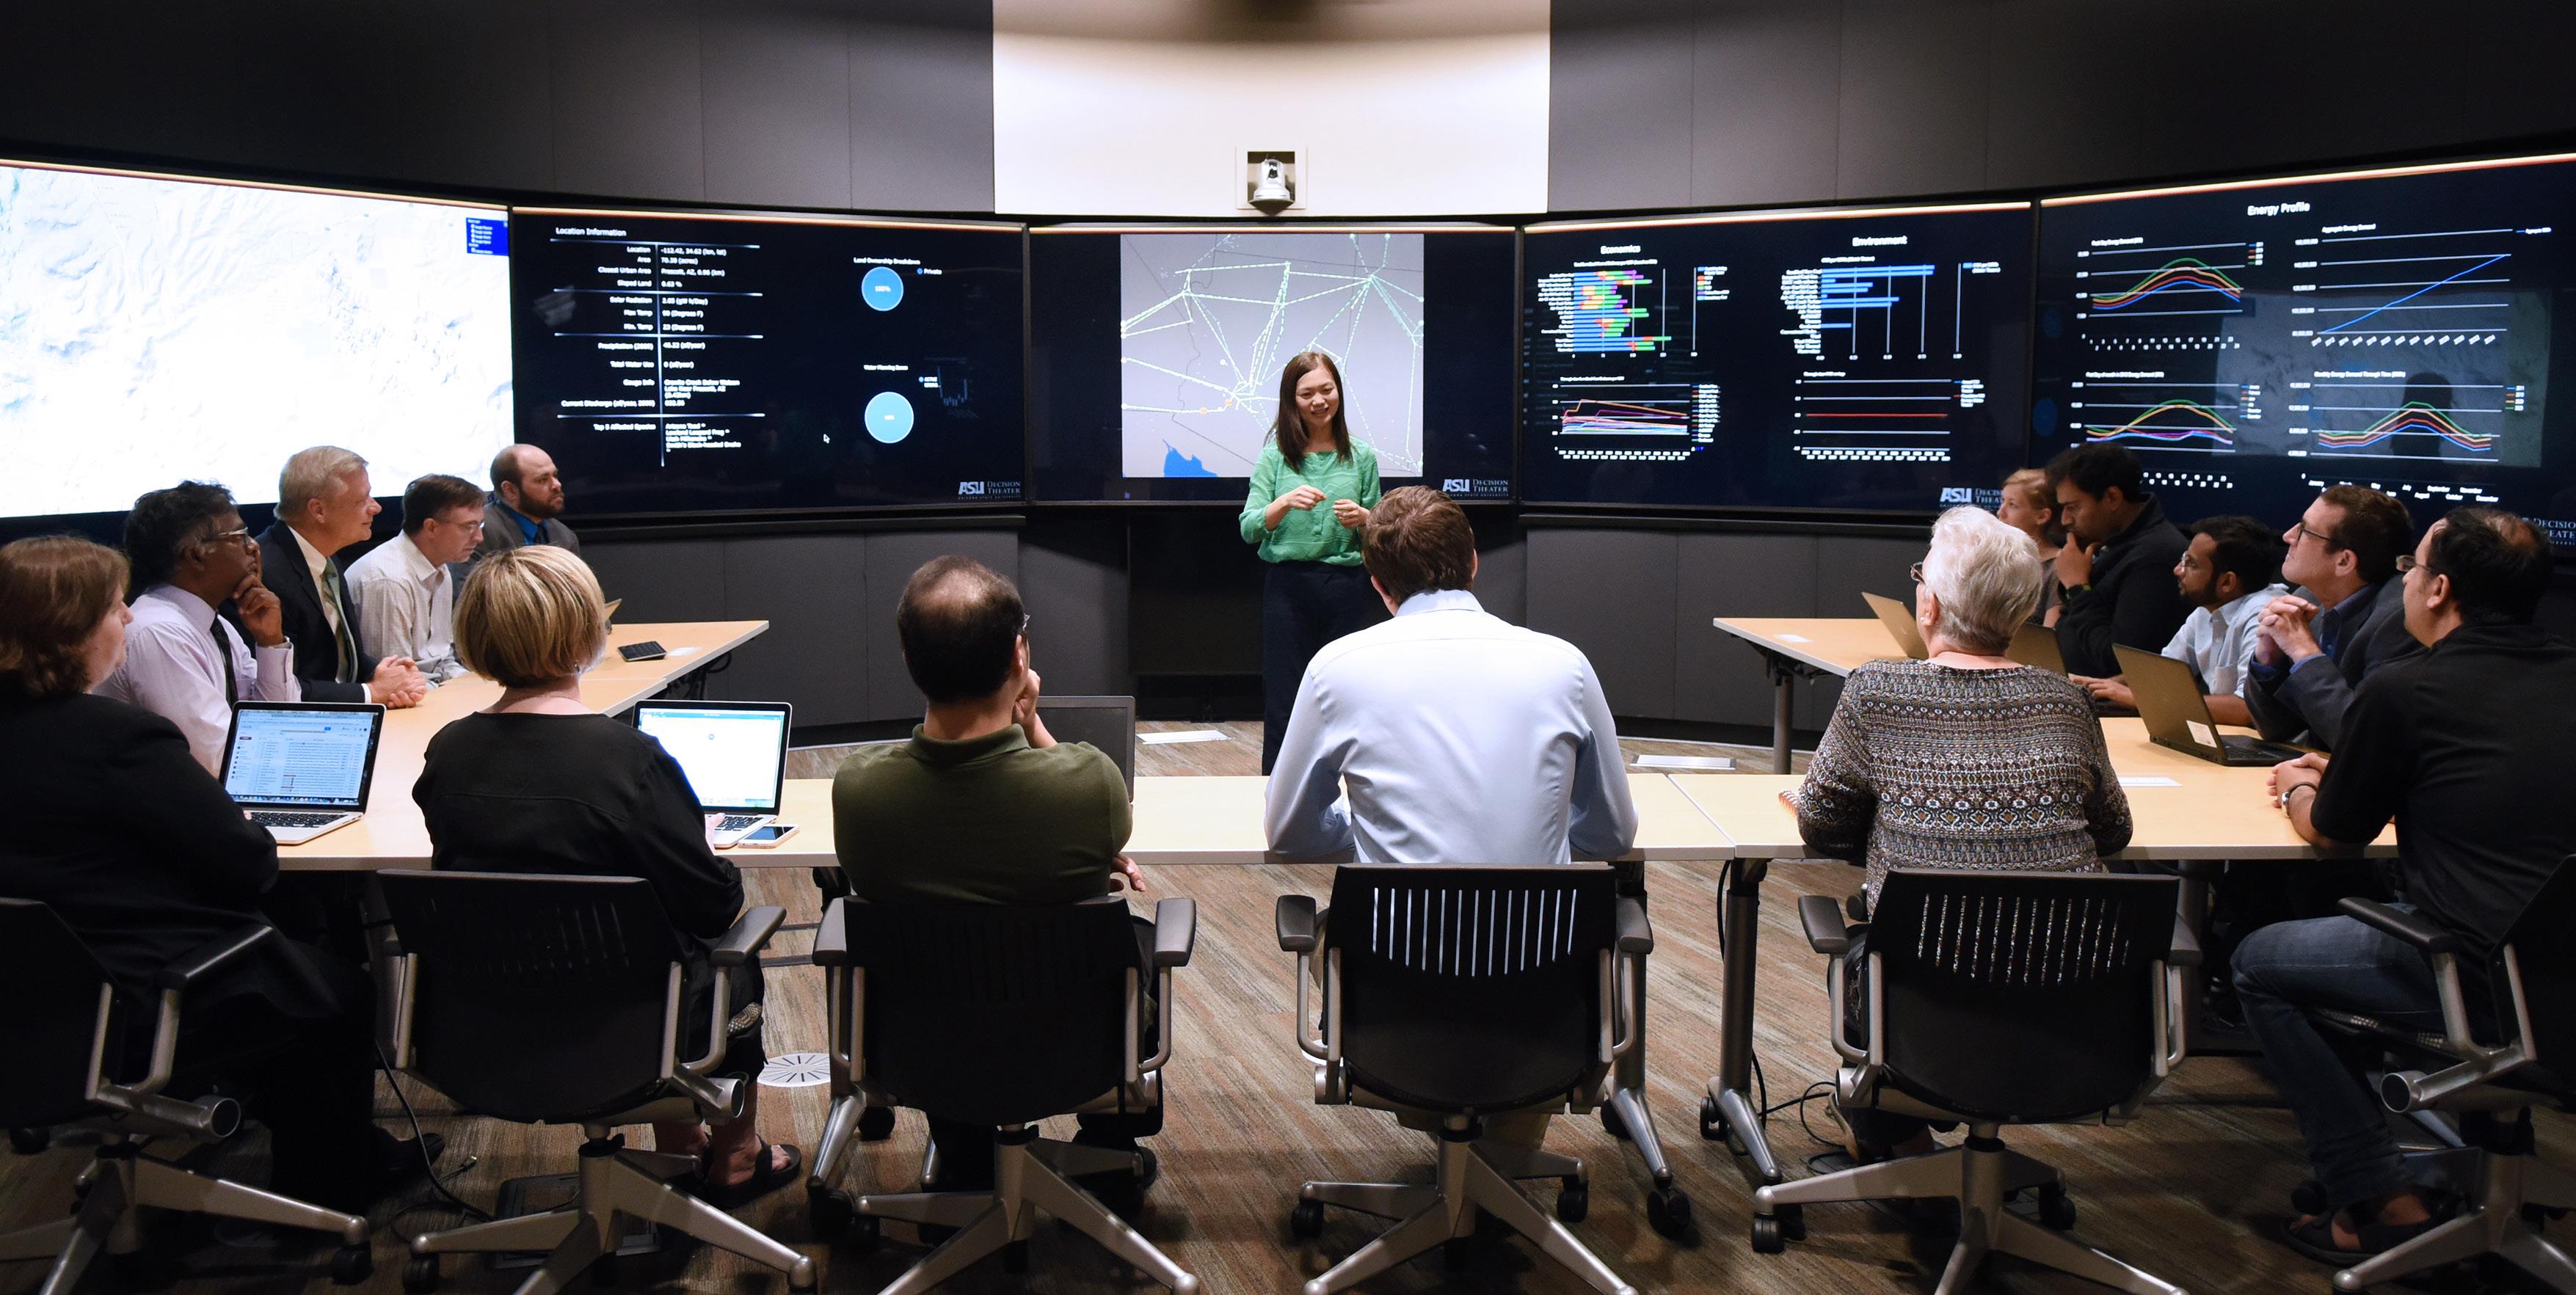
Complex systems by their nature are multi-dimensional and cross domain boundaries. System problems cannot be easily understood or solved by looking at it through a single prism that does not consider consequences to all aspects of the problem. While research and practical knowledge on interrelated functions exists, it is often challenging to communicate contextualized relationships to non-expert audiences or decision or policy makers. DT applies an integrated, visualized, data, and mathematical model approach to portraying and analyzing the functions of a system, conducting predictive analysis, and communicating to leaders, practitioners and community members.
From fundamental research to real-world application, ASU DT staff develops custom modeling and simulation tools with unique visualization capabilities to create a common understanding of complex problems. Clients are able to test theories and forecast the outcome of prospective decisions. The collaborative, immersive, and interactive environments created at ASU DT affords researchers and other organizations unparalleled abilities to make decisions in a range of disciplines and environments, often in timesensitive environments, that incorporate multiple streams of real-time information. Economic policy, health care delivery, emergency preparedness, and disaster response are just some examples of the large scale, dynamic systems where key decisions have long-term ramifications.
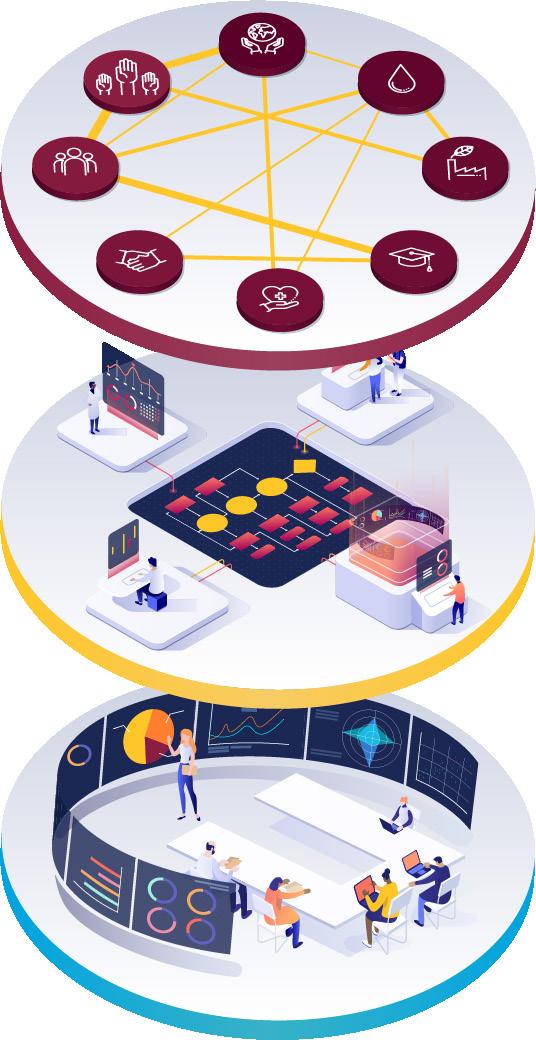
What makes ASU DT different is how we uniquely combine project teams’ technical capabilities using team science and decision science strategies, with specific subject matter expertise to capture project objectives, requisite data, system requirements, and required design elements for each individual project. As depicted in Figure 1, we seek to understand complex problems (the first plane of Figure 1). We integrate newly created or utilize existing models and data databases to represent real world problems (Figure 1, second plane). We conduct data analytics to gain unique insights and perform predictive analytics. But to truly create understanding and informed decision makers, we go further. As depicted on the bottom plane of Figure 1, we visualize the integrated models and data in order to convene engagements of technical experts, stakeholders, and policy makers. Our goal is better decisions made by better, more informed decision makers.
ASU DT analysts and modelers work directly with individual researchers and mulitple groups of stakeholders from project initiation to completion and beyond. The process is iterative and user-led, which results in targeted custom model design and development, followed by highly relevant and scalable visualizations. ASU DT delivers products directly to the endusers after complete evaluation and provides thorough training. ASU DT is committed to high-performance and facilitates individual sessions, demonstrations, and working group discussions across the life-time of model development.