VALUE Added Statement –
for the year ended 30 June 2006
Net revenue Other operating income Less purchased materials and services Value added from operations Investment income Total value added
2006 R’million 3 449 2 (1 890) 1 561 73 1 634
95,5 4,5 100,0
2005 R’million 2 815 5 (1 540) 1 280 38 1 318
97,2 2,8 100,0
508 280 114 166 182 — 664 139 53 472
31,1 17,1 6,9 10,2 11,1 — 40,7 8,5 3,3 28,9
399 200 99 101 191 282 246 130 30 86
30,3 15,2 7,5 7,7 14,5 21,4 18,6 9,8 2,3 6,5
1 634
100,0
1 318
100,0
%
%
Value distribution Employees Providers of capital Finance costs Capital distribution/dividend paid to shareholders Governments BEE partners Reinvested in the Group Depreciation and amortisation Deferred tax Income retained in the business Total value distribution
Value added statistics Number of full-time employees Revenue per employee Value added per employee Wealth created per employee
R’000 R’000 R’000
2 144 1 609 728 762
1 950 1 443 512 532
164 11 5 2 182
177 8 4 2 191
94 94 188
74 147 221
Monetary exchanges with government Current taxes (including STC) Customs and excise duty RSC levies Rates and similar levies Gross contribution to central and local governments
Additional collections on behalf of government Employees’ taxes Net VAT paid
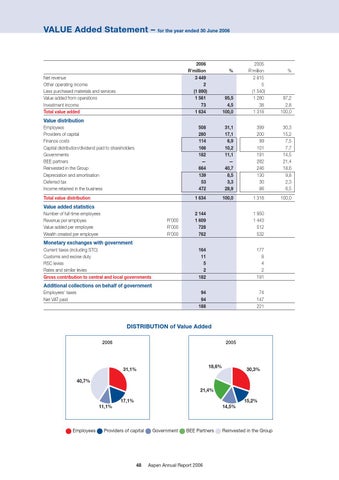
DISTRIBUTION of Value Added 2006
2005
18,6%
31,1%
30,3%
40,7% 21,4% 17,1%
15,2%
11,1%
Employees
14,5%
Providers of capital
48
Government
BEE Partners
Aspen Annual Report 2006
Reinvested in the Group