ASETEK A/S - ANNUAL REPORT 2017
(USD 000’s)
Revenue 2017
2016
Denmark
317
133
Hong Kong
23,096
28,219
Taiwan
18,856
9,051
USA
6,337
6,390
All others
9,588
7,128
TOTAL 58,194
50,921
Condensed income statement - years ended December 31,
Non-current assets 2017
53,227
4,967
-
58,194
45,752
5,169
-
50,921
Cost of goods sold
33,459
3,766
-
37,225
27,482
3,689
-
31,171
19,768
1,201
- 20,969
18,270
1,480
-
19,750
3,128
6,559
2,616
12,303
GROSS PROFIT Operating costs ADJUSTED EBITDA
2016
Depreciation in operating expense
12,921
6,833
Share based compensation
USA
2,180
2,223
Financial income (expenses)
China
81
15
TOTAL
15,182
9,071
INCOME (LOSS) BEFORE TAX
3,777 - 15,991
8,474
2,847
15,098
-
(913)
(913)
-
-
-
-
(7,273) (1,934) 6,784
15,142
(5,079)
(2,616)
7,447
1,033
1,397
-
2,430
806
1,644
-
2,450
348
813
436
1,597
77
137
114
328
-
-
(1,258)
(1,258)
-
-
322
322
14,610
(9,483)
(3,628)
1,499
14,259
(6,860)
(2,408)
4,991
Condensed balance sheet - as of December 31,
2017
2016
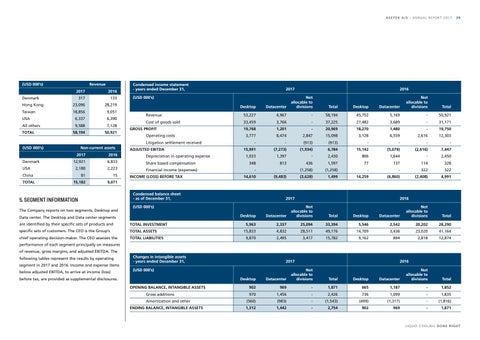
Data center. The Desktop and Data center segments
(USD 000’s) Not Not allocable to allocable to Desktop Datacenter divisions Total Desktop Datacenter divisions
are identified by their specific sets of products and
TOTAL INVESTMENT
specific sets of customers. The CEO is the Group’s
TOTAL ASSETS
chief operating decision-maker. The CEO assesses the
TOTAL LIABILITIES
The Company reports on two segments, Desktop and
Total
Revenue
Denmark
5. SEGMENT INFORMATION
2016
(USD 000’s) Not Not allocable to allocable to Desktop Datacenter divisions Total Desktop Datacenter divisions
Litigation settlement received (USD 000’s)
2017
39
Total
5,963
2,337
25,094
33,394
5,546
2,542
20,202
28,290
15,833
4,832
28,511
49,176
14,709
3,436
23,020
41,164
9,870
2,495
3,417
15,782
9,162
894
2,818
12,874
performance of each segment principally on measures of revenue, gross margins, and adjusted EBITDA. The following tables represent the results by operating segment in 2017 and 2016. Income and expense items below adjusted EBITDA, to arrive at income (loss) before tax, are provided as supplemental disclosures.
Changes in intangible assets - years ended December 31,
2017
2016
(USD 000’s) Not Not allocable to allocable to Desktop Datacenter divisions Total Desktop Datacenter divisions OPENING BALANCE, INTANGIBLE ASSETS Gross additions
Total
902
969
-
1,871
665
1,187
-
1,852
970
1,456
-
2,426
736
1,099
-
1,835
Amortization and other
(560)
(983)
-
(1,543)
(499)
(1,317)
-
(1,816)
ENDING BALANCE, INTANGIBLE ASSETS
1,312
1,442
-
2,754
902
969
-
1,871
L I Q U I D C O O L I N G D O N E RI G H T