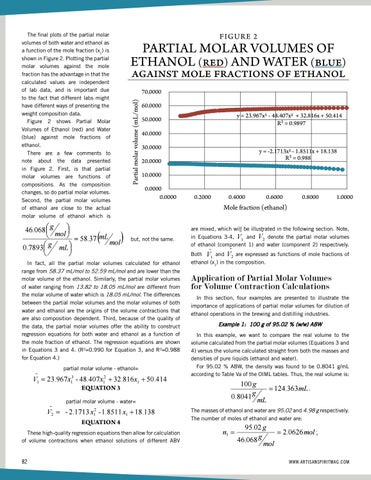
Figure-2 Partial Molar Volumes of Ethanol (red) and Water (blue) aga The final plots of the partial molar ethanol. F I GUR E 2 volumes of both water and ethanol as Figure-2 Partial Molar Volumes of Ethanol (red) andand Water (blue) against mole f Figure-2 Partial Molar Volumes ofto Ethanol (red) Water (blue) against mo a function of the mole fraction (x1) is There are a few comments note about the data presented in Figureethanol. ethanol. shown in Figure 2. Plotting the partial molar volumes are functions of compositions. As the composition chan ( of Ethanol ) about (in Figure-2. ) fraction Figure-2 Partial Molar Volumes (red)the anddata Water (blue) against mole molar volumes against the mole There are a few comments note presented is volumes. Second,tothe partial molarthe volumes of ethanol are closeFirst, toFirs the There are a few comments to note about data presented in Figure-2. fraction has the advantage in that the ethanol. molar volumes are are functions of compositions. composition changes, so do g As the molar volumes functions of compositions. As the composition changes, so calculated values are independent 46.068 mol volumes. Second, the partial molar volumes of ethanol are close to the actual mo a few comments to note about the data presented in Figure-2. First, is that pa of lab data, and is important due There are mL volumes. Second, the is partial molar volumes of.37 ethanol are close to the 70.0000 58 but, not theactual same ethanol which molchanges, g g to the fact that different labs might molar volumes are functions of compositions. As the composition so do partia g mL 46.068.068 .7893 0mol have different ways of presenting the volumes. Second, 60.0000 the partial 46 58 mol mL molar volumes of.37 ethanol are close to the molar volu but,but, not theactual same. ethanol which is mL 58 . 37 not the same. ethanol which is weight composition data. mol g y = 23.967x3 48.407x2 + 32.816x + 50.414 mol gthe g mL volumes calculated for ethanol range from .7893 mL 50.0000 In46fact, partial Figure 2 shows Partial Molar .0680all 0mol .7893 molar R2 = 0.9897 58.37 the molar mL Volumes of Ethanol (red) and Water ethanol which is mL/mol and are lower but, not theofsame. than volume the ethanol. Similarly, 40.0000 mol g (blue) against mole fractions of In fact, all the partial range from 58.37 mL/ mLmolar 0all .7893 partial volumes volumes ofmolar water ranging calculated fromcalculated 13.82for to ethanol 18.05 mL/mol are from different from In fact, the for ethanol range 58.37 the volumes ethanol. 30.0000 mL/mol and are lower than molar volume of the ethanol. Similarly, the partia which is 18.05 mL/mol. between the partial y = differences -2.1713x2 - 1.8511x + 18.138 mL/molwater and are lower than the molarThe volume of the ethanol. Similarly, themo pa There are a few comments to R2 = 0.988 volumes of water ranging from 13.82 to 18.05 mL/mol are different from the mol In fact, all the partial molar volumes calculated for ethanol range from 58.37 mL/mol to molar volumes of both water and ethanol are the origins of the volume note about the data presented volumes of water ranging from 13.82 to 18.05 mL/mol are different from the 20.0000 water which is 18.05 mL/mol. The differences between thethe partial volume in Figure 2. First, is that partial mL/mol and are lower than the mL/mol. molar volume ofThird, the ethanol. Similarly, themolar partial molar also composition dependent. because of quality of the data water which is 18.05 The differences between the partial molar volu Partial Molar Volumes of Ethanol (red) and Water (blue) against mole fractions of 10.0000 molar volumes are functions of volumes molar volumes of both water and ethanol are the origins of the volume contractio ofmolar watervolumes ranging of from 13.82 to 18.05 mL/mol are different from the molar volu volumes offer the ability to construct regression equations for both wa both water and ethanol are the origins of the volume contr compositions. As the composition also composition dependent. Third, because of the quality of the data, the partia is composition 18.05 mL/mol. The differences thethe partial molar volumes and t function ofdependent. the fraction of ethanol. The regression equations are 0.0000 ar Volumes of Ethanol (red) and Waterwater (blue)which against mole fractions ofmole also Third, between because of quality of the data, the pa changes, so do partial molar volumes. 2 2 volumes offer the ability to construct regression equations for both water and eth 0.0000 0.2000 0.4000 0.6000 0.8000 1.0000 e a few comments to notemolar aboutvolumes the data presented inof Figure-2. is that partial molar both4.water and ethanol are the origins of the for volume contractions tha and (RFirst, =0.990 for Equation 3, and R =0.988 Equation 4.) volumes ability to Second, the Molar Volumes of partial Ethanol (red) and Water (blue) againstoffer molethe fractions of construct regression equations for both water and function of the mole fraction of ethanol. The regression equations are shown in umes are compositions. thecomposition composition changes, soThird, do partial also because of the quality of the data, the partial molarE Mole fraction (ethanol) of functions ethanol areofclose to the actualAs functiondependent. of the mole fraction ofmolar ethanol. The regression equations are shown 2 2 2 ments to note about the data presented in Figure-2. First, is that partial and 4. (Rthe for 3,regression Rof=0.988 for Equation 4.)water volume molar of ethanol whichofisethanol 2the partial molar volu me -and ethanol 2equations V=0.988 x13both - 48.407 32.816 x1 a Second,molar the partial volumes are close to actual molar volume volumes offer ability toEquation construct ethanol and 4.=0.990 (R =0.990 for Equation 3, and R forfor Equation 4.)x1 and 1 23.967 These high-quality regression equations then allow for calculation of volume con unctions of compositions. As the composition changes, so do partial molar comments to note about the data presented in Figure-2. First, is that partial function of the mole fraction ethanol. Theberegression equations are shown in Equatio g will are of mixed, which illustrated in the following section. Note, - 3which 46.068volumes high-quality These regression equations then ethanol solutions ofvolume different ABV are mixed willx 2be2illustrated in50.414 the allow follow e partial molar arecomposition close to the actual molar of 2 2 3 2 mol of ethanol partial molar volu me ethanol V 23.967 x 48.407 32.816 x are functions of compositions. As mL the changes, so do partial molar and 4.but, (R =0.990 for Equation 3, for 4.) 1partial 1 V 1 denote 1 x x inme Equations and the molar volumes partial molar volu meR3-4, -=0.988 water 23.967 VEquation - -2.1713 xx11 - 1.8511 partial molar volu - and ethanol x 48.407 32.816 50.414 2 1 1 18.138 but, not not the same. 1 1 58.37 the same. which isg ethanol solutions of different ABV are mixed which mol molar of ethanol (component 1) and (component 2) respectively. the partial of ethanol are close to in theEquations actual molar volume g volumes Vof2- denote V1 and 6d, .068 Note, 3-4, thewater partial molar volumes of ethanol (c mL 0 . 7893 mol - 3 2 2 mL 2 Both and are expressed as functions of mole fractions partial molar volu me water V 2.1713 x 1.8511 x 18.138 partial molar volu me ethanol V 23.967 x 48.407 x 32.816 x 50.414 V V Note, in Equations 3-4, and denote theEquati parti but, not the same. g 58.37 1 1 x - 1.8511 1 1 x2 18.138of 1 1 partial molar volume - water 2 V21 - 2.1713 46.068 mol 1 1 g V V and water (component 2) respectively. Both and are expressed as function ethanol (x ) in the composition. mol the partial molar volumes calculated for ethanol 2 1 1 mL 893 In fact, allvolumes 58mL/mol .37 mL but, the same. sl thepartial molar calculated for not ethanol rangethan from 58.37 mL/mol to 52.59 V and water (component 2) respectively. Both range from 58.37 to 52.59 mL/mol and are lower the mol 2 1 and fractions ofme ethanol ) inVthe 1 g mL molar volu - water(x composition. - 2.1713 x1 - 1.8511 x1 18.138 Equati 7893 2 molar volume nd0.are lower than the molar volume ofpartial the Similarly, partial of Partial Molar Volumes molar of the ethanol. Similarly, the ethanol. partial molar volumes theApplication fractions of ethanol (x1) in the composition. l molar calculated for range 58.37 mL/mol to 52.59 ofranging water ranging 13.82 to 18.05 mL/molfrom are different different from for Volume Contraction Calculations of watervolumes fromfrom 13.82 to ethanol 18.05 mL/mol are from the molar volume of Application of Partial Molar Volumes for Volume Contraction Calcula er than the molar volume of the ethanol. Similarly, the partial molar the molar volume of water which is 18.05 mL/mol . The differences Application of Partial Molar Volumes artial for ethanol range 58.37 mL/mol to 52.59 ich is molar 18.05 volumes mL/mol. calculated The differences between thefrom partial molar volumes and thefour examples In this section, are presented to illustrate the for V between theto partial molar volumes and the molar volumes ofmolar bothfour In this section, examples are presented to illustrate the importance of applic nging from 13.82 18.05 mL/mol are different from the volume of importance of applications of partial molar volumes for dilution of lowerof than the molar volume of are the the ethanol. Similarly, the partial molar that are umes both water and ethanol origins of the volume contractions water and ethanol are the origins of the volume contractions that In this section, four arebrewing presented illus partial molar volumes for dilution operations inindustries. the andtodistill 5er mL/mol. The differences between the partial molar volumes andethanol the operations the brewing andexamples distilling ranging from 13.82Third, to 18.05 mL/mol are different the volume of ofin ethanol position dependent. because of the quality the data, the partial molar are also composition dependent. Third, because of of thefrom quality of molar partial1:molar volumes for dilution of ethanol opera oth water and ethanol are theregression origins of equations the volumefor contractions that 100 g of 95.02 % (w/w) ABW 18.05 mL/mol. differences between the volumes andare theExample offer the ability to water ethanol as aABW the data,The theconstruct partial molar volumes offer thepartial ability molar to both construct Example 1: 100 g ofand 95.02% (w/w) pendent. Third, because of the quality of ethanol thethe data, partial molarIn in regression equations forare both water and as athe function of shown this example, we to compare the real volume to the of both water and ethanol the origins of volume contractions that are the mole fraction of ethanol. The regression equations are Equations 3 want Example 1: 100 g of 95.02% (w/w) ABW In this example, we want to compare the real volume to the volume fr bility to construct regression equations for both water and ethanol as a the mole fraction of ethanol. The regression equations are shown 2n=0.990 calculated from the partial molar volumes (Equations calculated 3 and dependent. Third, 3, because the quality of the data, molar for Equation and R22of =0.988 for Equation 4.) 2 the partialvolume In example, we want compare theand real volum in Equations 3 and 4.regression (R =0.990 for Equation 3, and R =0.988 4) versus calculated straight fromto both thestraight masses volumes (Equations 3the 4)this versus the volume calculated from both ethanol. The equations are shown Equations 3as hefraction abilityforof toEquation construct regression equations formolar both waterin and ethanol a& volume 4.) 2 densities of pure liquids (ethanol and water). molar volumes (Equations 3 & 4) versus the volume densities pure liquids (ethanol water). 2 Equation 3, -and R =0.988 for Equation 4.)equations mole fraction of ethanol. regression are shown in Equations 3% ABW,3and olar volu me ethanol V1 The 23.967 x13 - 48.407 xand x1 of 50.414 Equation 1 32.816 For 95.02 the density was liquids found to (ethanol be 0.8041and g/mL partial molar volume ethanol= and densities of pure water). 2 3, and R =0.988 for Equation 4.) 0 for Equation according Tablefound Va of the tables. Thus, real volume For 95.02% ABW, the densityto was toOIML be 0.8041 g/mLthe according tois:Table Va 2 -3 - ethanol V 23.967x1 - 48.407x1 232.816x1 50.414 Equation 3 For 95.02% olar volume - 1water V2 - 2.1713 x1 - 1.8511 x1 18.138 Equation 4 gABW, the density was found to be 0.80 100 EQUATION 3 tables. Thus, the real volume is: 3 2 124.363 mL . The masses of etha lume - ethanol- V1 23.967x1 - 48.407x1 32.816x1 50.414 Equation 3 100 g g 2 0 . 8041 tables. Thus, the real volume is: 124 e - water V2 - 2.1713 x 1.8511 x 18.138 Equation 4 mL partial1 molar volume1 - water= g 0.8041 mL 95 and 5 g respectively. number of moles of ethanol water are: The massesThe of4ethanol and water are 95.02 and 4.98and g respectively. lume - water V2 - 2.1713 x12 - 1.8511 x1 are 18.138 Equation are 95 and 5 g4respectively. The number of moles of ethanol andgwater are: The number of moles o 95.02 g .98 EQUATION 4 2.0626 mol ; n2 0.2764 mol ; mole fractio n1 95.02 g g 4.98g g 46 . 068 18 . 015 2.0626 mol ; n2 n1 mol These high-quality regression equations then allow for calculation mol 46.068 g 18.015 g of volume contractions when ethanol solutions of different ABV m this composition is calculated as x1=n1/(n1+nmol 2), or x1=0.8818. Using both equation x this composition is and calculated as be x1=n 1/(n1+n 2), or determine the partial molar volumes for ethanol water to 58.145 and 14.8 82 WWW.ARTISANSPIRITMAG.COM determine the partial molar volumes ethanol an respectively. The volume for 100 g of 95.02% ABW calculated usingfor partial molar respectively. The volume for 100 g of 95.02% ABW Partial molar volume (mL/mol)
PARTIAL MOLAR VOLUMES OF ETHANOL red AND WATER blue against mole fractions of ethanol