While ArTISAN SPIrIT makes every effort to ensure accuracy in our content, the information is deemed reliable but not guaranteed. We urge our readers to consult with professional service providers to meet their unique needs.
At ArTISAN SPIrIT, we take the opportunity to enjoy many different craft spirits and adult beverages. However, it’s also our responsibility, and yours, to always drink responsibly. Know your limit, and never drink and drive.
ArTISAN SPIrIT’s number one goal is to share and celebrate the art and science of artisan craft distilling. But please remember to follow all the laws, regulations, and safety procedures. Be safe, be legal, and we can all be proud of the industry we love.
THANK YOu TO ALL Our SPONSOrS.
Our mission at Artisan Spirit Magazine is to share and celebrate the art and science of artisan craft distilling. We are humbled by the support of our sponsors. With their help, we can further our common goals of supporting creativity, innovation, and integrity within the industry we all love so much.
The American Spirits Exchange is a national importer and distributor serving the alcoholic beverage industry (spirits, wine, and beer). We provide domestic and international companies with access and support to the U.S. market. Regardless of your size — from micro, craft distiller to publicly traded multinational — our focus fuels your growth. Our flagship Foundations™ program provides companies with access to the U.S. market. We handle your business-to-business functions from start to finish: permitting, brand approvals, purchase order processing, invoicing, and compliance.
Every element of Cage and Sons equipment is designed and crafted to provide you with the very best distilling experience at an affordable rate because we know that bottom line matters, but so does function. At Cage and Sons, adequate is never an option, and we continue to develop and design new high functioning, cutting-edge distillation systems that enhance the distillation industry. Cage and Sons works every day to bring you the very best distillation systems for the very best value.
For nearly 50 years, CF Napa Brand Design has set the standard for alcohol beverage branding.
Led by Owner & Creative Principal David Schuemann for the past 22 years, we focus on translating brand ethos visually, never using a one size fits all approach for projects. The result is a bespoke solution rooted in strategy and, most importantly, a design that sells.
CF Napa’s expertise lies in the intricacies of our process — from project conception to conclusion, our team brings a strategic yet thoughtful eye to every detail. We understand the market and target audiences on a global stage. We balance listening with leading to execute a design that the client loves, and the consumer buys again and again.
The Distilled Spirits Council of the United States (DISCUS) is the leading voice and advocate for distilled spirits in the United States. Representing producers and marketers of distilled spirits, DISCUS advocates on legislative, regulatory, and public affairs issues impacting the distilled spirits sector at the local, state, federal, and international levels; promotes the distilled spirits sector, raising awareness and opening markets in the United States and around the globe; and encourages responsible and moderate consumption of distilled spirits as part of a healthy adult lifestyle based on evidence-based research and policy. DISCUS also powers Spirits United, a grassroots platform for the distilled spirits industry. Spirits United is comprised of a community of advocates united with a common goal: to ensure adult consumers can enjoy distilled spirits where they want, how they want, and when they want. Learn more at distilledspirits.org and spiritsunited.org.
Haskell is a diversified Architecture, Engineering, and Construction (AEC) firm with the resources to serve our clients across more than a dozen unique markets. Our worldwide team offers an unmatched depth of expertise, leveraging 2,600 subject matter experts across more than 20 design disciplines. With a dedicated beer, wine, and spirits team, Haskell provides integrated solutions for clients, specializing in sustainable facility design and complex manufacturing systems. Our team brings years of industry experience to breweries, wineries, and distilleries of all sizes. Whether it’s a turn-key can line, engineering expertise for a winery, or the design of a distillery, our team will work alongside you to determine the right solution.
Learn more at www.Haskell.com.
We’ve been in this industry for over 100 years, during which time we’ve learned a thing or two about what makes a great barrel to age great spirits. Our R&D team and account managers have hundreds of barrels currently in experimentation. Partnering with distillers, we think outside the box to develop new products that push your vision forward.
Our Mission: To craft world-class oak barrels and other cooperage products so our employees, customers, and communities flourish.
With an impressive legacy spanning over 30 years in the printing and label domain, Jack Vogel stands as a respected authority in the Spirits industry. For the past 23 years, he has been a steadfast and trusted advisor, contributing significantly to the evolution of label standards and practices. Jack's journey includes leadership roles at top label printers within the Spirits sector. Having transitioned into an independent consultant, he continues to channel his wealth of knowledge towards empowering brands to achieve excellence. As an original founding sponsor and advisor to organizations such as ADI (American Distilling Institute), ACSA (American Craft Spirits Association), and Artisan Spirit, Jack has played a pivotal role in shaping industry standards. At the core of Jack's professional philosophy is the belief in industry education as a catalyst for stability and growth. By imparting knowledge and insights, he contributes to the overall advancement of the Spirits label landscape.
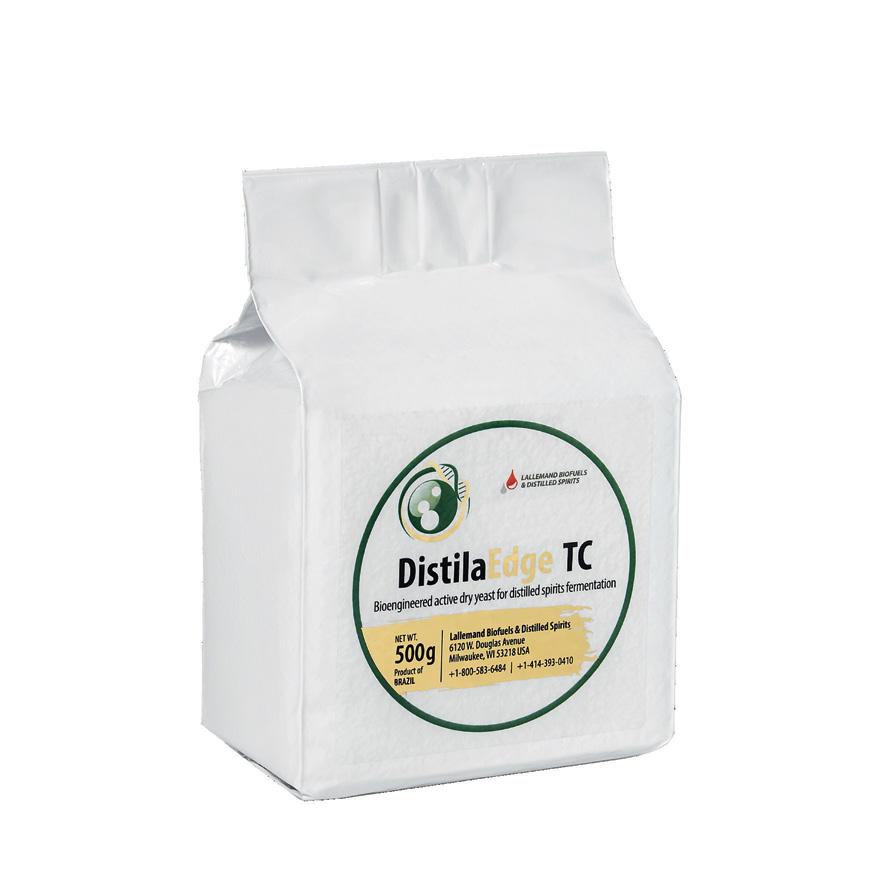
Lallemand Biofuels & Distilled Spirits is the industry leader in supplying fermentation products and valueadded services to the distilled spirits industry. We specialize in the research, development, production, and marketing of yeast and yeast nutrients as well as a solid belief in education of the distilled spirits industry.
A vital part of the alcohol production process, fermentation products from Lallemand Biofuels & Distilled Spirits have been designed and selected to create value by tailoring objective solutions to distillery needs.
Moonshine University is located in Louisville, Kentucky on the Beverage Campus with its sister company, Flavorman. Moonshine University offers a variety of classes for enthusiasts, entrepreneurs, industry professionals, and those seeking careers in the distilling industry. Our distillery was designed as part of our classroom, and all classes incorporate hands-on learning and sensory evaluation in order to provide a complete and comprehensive education. In addition to its knowledgeable instructors, Moonshine University hosts a range of renowned industry experts for specialized instruction and training.
For more than 40 years, Phoenix Packaging has worked to realize each client’s unique vision to best represent their story through their unique branding imagery. We provide our clients with options from around the world in a variety of materials such as glass, ceramic, plastics, paper, aluminum, and more. We help to coordinate everything from bottle design, manufacturing, decoration, and logistics. Our goal is to produce your packaging vision to help you achieve success.
Responsibility.org is a national not-for-profit that aims to eliminate drunk driving and work with others to end all impaired driving, eliminate underage drinking, and empower adults to make a lifetime of responsible alcohol choices. Responsibility.org is funded by the following distillers: Bacardi USA, Inc.; Brown-Forman; Campari Group; Constellation Brands; DIAGEO; Edrington, Hotaling & Co.; Mast-Jägermeister US, Inc.; Moët Hennessy USA; Ole Smoky, LLC; Pernod Ricard USA; Suntory Global Spirits; and William Grant & Sons. For more than 33 years, Responsibility.org has transformed countless lives through programs that bring individuals, families, and communities together to inspire a lifetime of responsible alcohol choices. To learn more, please visit www.Responsibility.org.
Since 2013, Statesville Contract Distilling has been producing award-winning, quality spirits at scale and doing it sustainably. Combining the artistry of distilling with cutting-edge technology and unparalleled customer service, we offer a diverse range of standard and custom new fill whiskeys, extensive aged barrel inventory, warehouse barrel storage, private label production, and co-packing for more than 150 brands globally. Partner with us to create spirits you can't get anywhere else, that you'll be proud to call your own. To learn more about our proven track record, visit statesvillecontractdistilling.com or call us at (704) 798-3447.
Stave & Thief Society was founded in 2014, and is the first bourbon certification program recognized by the bourbon industry and the only to be recognized by the Kentucky Distillers Association as its “Official Bourbon Education Course.” The programs were developed by professional distilling and spirits educators and advised by a panel of experts in the bourbon and hospitality industries to provide a premium, standardized bourbon education that is accessible and holds real value.
For over 60 years Tapi USA has produced cork stoppers and a wide variety of bottle closures. Family-owned and operated since its inception, our company continues to develop new products and enter new markets. Tapi USA is proud to support the growth of the artisan distillery industry and is honored to be the Bottle Closure Sponsor for Artisan Spirit Magazine.
Total Wine & More is the country’s largest independent retailer of fine wine, beer, and spirits. Our strength is our people. We have over 5,000 associates, who must demonstrate comprehensive beverage knowledge before they are invited to join our team. After coming on board, all of our team members undergo an extensive initial training program. We believe that an educated consumer is our best customer. We want to demystify the buying experience for our customers so they will feel confident in choosing the bottle that is perfect for them. Total Wine & More works closely with community and business leaders in each market it operates to support local causes and charitable efforts.
BeNeFACTOr SPONSOrS
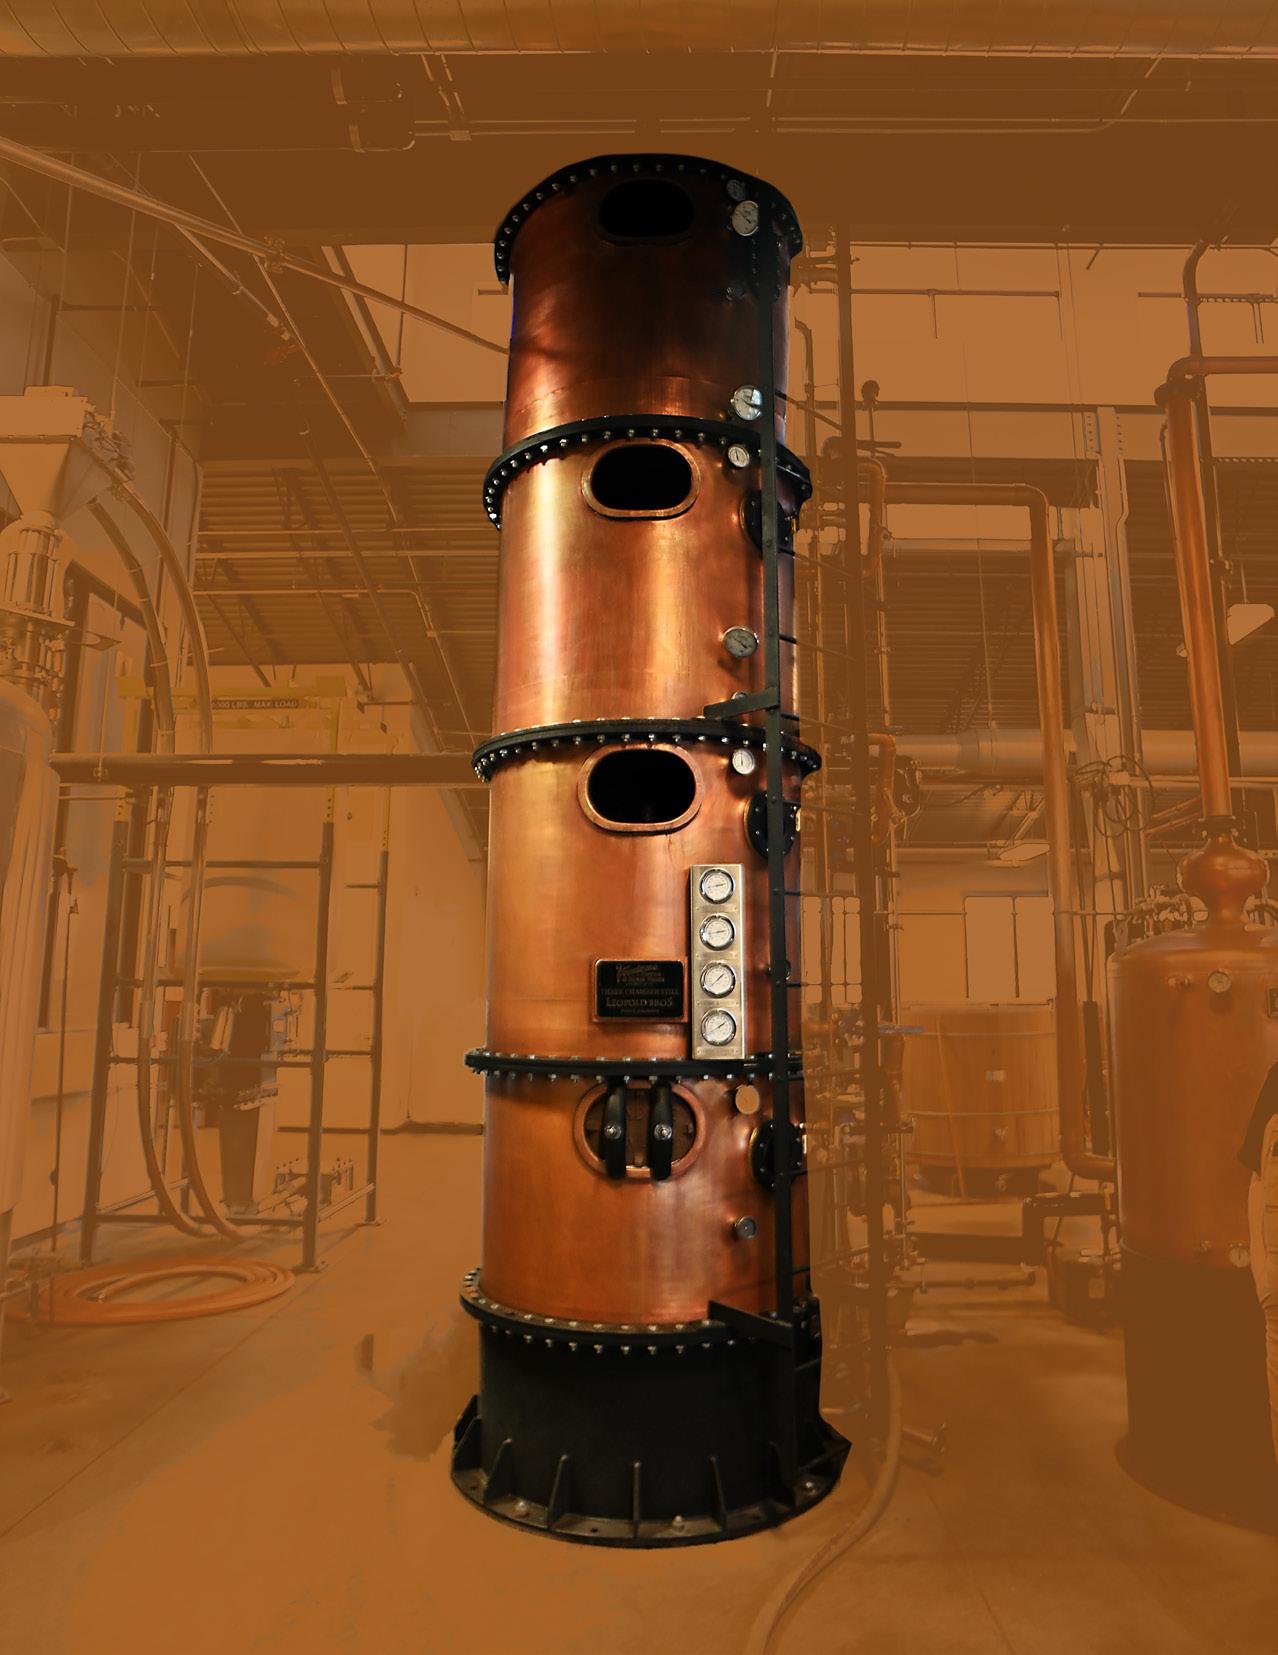
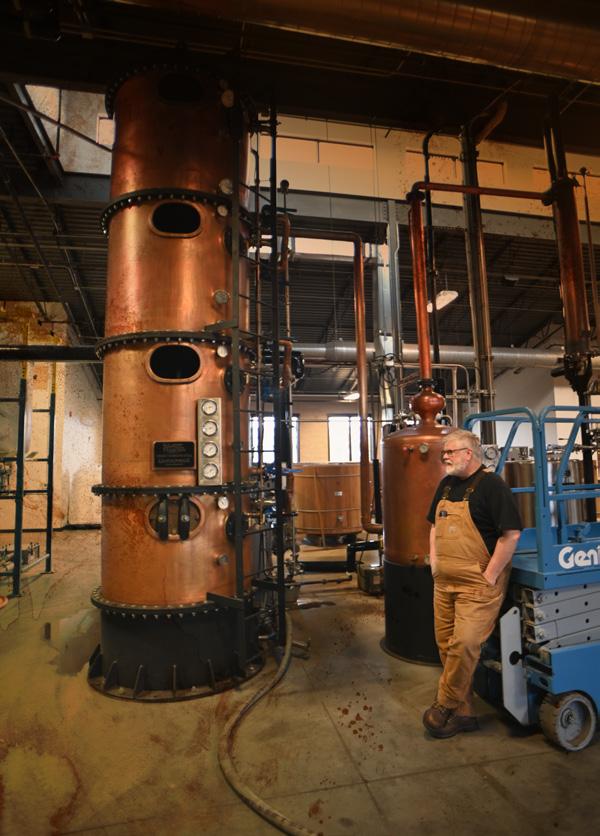
Led by Director of George Dickel & Luxury American Whiskey, Nicole Austin, the team at Cascade Hollow Distilling Co. continues the tradition of producing award-winning whisky at our historic distillery with high standards of authenticity and craftsmanship. George Dickel is behind some of the most beloved whisky of our time including Dickel Bourbon, George Dickel x Leopold Bros Collaboration Rye, award-winning Bottled in Bonds, the Cascade Moon series, and a variety of luxury variants like the rare, premium offering — Dickel Bourbon Aged 18 Years. Learn more about the incredible history and creativity that lives at Cascade Hollow at GeorgeDickel.com.
A LeTTer FrOm THe eDITOr:
Well friends, here we are — Summer 2025 — and if you're still standing, still fermenting, still filing TTB reports on time, then take a breath and know that you are not alone. There’s chaos, sure. But as someone much more dramatic than me once said, chaos is a ladder.
In this issue, you’ll find people climbing that ladder. You'll also find those who are building their own. From deep dives into market trends to technical breakdowns on equipment, geosmin, and ethyl carbamate, this one’s packed. And of course, we spotlight the humans behind the spirits, those oddball alchemists and the organizations representing them as they fight the uphill battles in boardrooms and on Capitol Hill.
Our friends at DISCUS were in D.C. this spring, pounding the pavement and making noise about tariffs, shipping rights, and the Dietary Guidelines (yes, that’s still a thing). ACSA welcomed a new board of directors and is charging hard toward USPS shipping reform and market access improvements. Meanwhile, the James B. Beam Institute hosted over 1,400 attendees and shared some jaw-dropping research on warehouse airflow and oak genome mapping. And ADI? They’re turning San Antonio into a distiller’s playground this August with their 22nd annual conference.
On the Society of Spirit (SOS) front, the Discord channel has been buzzing with conversations about equipment upgrades, software pain points, and that delightful dumpster fire known as distributor consolidation. But most exciting of all, the SOS board is heading to the University of Kentucky to hold a roundtable on the future of distilling education and safety. If you’ve got opinions (and we know you do), now’s the time to speak up.
And over on the Still Talking podcast, we dropped an interview with DISCUS president Chris Swonger. We tackled serious trade talk, some Capitol Hill inside baseball, and yes — a healthy amount of nonsense. I tried to get Chris to curse. He didn’t. But he spelled it out, and I’ll take what I can get.
Lastly, keep an eye on the Journal of Distilling Science. Dr. Gary Spedding is cooking up some fantastic content, and while I’m not ready to spoil it, let’s just say he is a busy man.
To the messy, brilliant, stubbornly optimistic folks who make this industry tick, thank you. Your work matters. Your challenges are real. And your stories deserve to be told, even when the future feels uncertain.
As always, we’re honored to be here doing just that.
Cheers,
Brian Christensen
(509) 944-5919 /// brian@artisanspiritmag.com /// PO Box 31494, Spokane, WA 99223
UPDATES FROM GUILDS AND ASSOCIATIONS WITHIN STATES, ACROSS THE NATION, AND BEYOND!
QUARTERLY GuILD & INDuSTrY REPORTS
The summer of 2025 finds the spirits industry at a critical juncture — one where innovation, advocacy, and scientific progress are pressing forward even as legislative, trade, and economic pressures continue to mount. From packed conferences and cutting-edge research labs to Capitol Hill fly-ins and evolving board leadership, the pulse of the industry is still strong, but at times chaotic.
As global trade tensions escalate and domestic markets shift, guilds and associations are doubling down on education, safety, market access, and regulatory reform. We’re seeing meaningful advances in standardization efforts, deepening scientific inquiry into materials and maturation, and a growing commitment to community, transparency, and resilience.
Across every organization there is a shared recognition: The future of spirits in America will be built by those willing to collaborate, adapt, and advocate.
The road ahead may be uneven, but the folks walking it are damned determined. And that’s the kind of stubborn optimism we should all support
Brian Christensen Editor, Artisan
AMERICAN CRAFT SPIRITS ASSOCIATION
It’s a tremendous honor to announce the 2025-2026 ACSA Board of Directors, elected in April, and I am beyond privileged to be leading the board as its president for the next year, following in the footsteps of Kelly Woodcock and all of her talented predecessors. I’m excited to work with our talented board to continue ACSA’s vital work — improving our regulatory landscape and strengthening the sense of community we all need to thrive in this challenging industry. I’m also thrilled to be working alongside fellow rum producer Jaime Windon, the newly elected vice president. Jaime is the founder and president of Lyon Rum in St. Michaels, Maryland and a tireless advocate for the legislative and regulatory priorities of the entire craft spirits community. The same is true for our new secretary/treasurer, Tom Bard,
co-founder of The Bard Distillery in Graham, Kentucky. He bears the distinction of being a direct descendent of William Bard, the founder of Bardstown, Kentucky. Windon has been a member of the board since 2023 and Bard since 2024.
Additionally, I am very pleased to welcome the newest members of our Board: Murphy Quint of Cedar Ridge Distillery in Swisher, Iowa; Caitlin Bartlemay of Hood River Distillers in Hood River, Oregon; Tara Bomberger of Freeland Spirits in Portland, Oregon; Orlando Lima of Bainbridge Organic Distillers on Bainbridge Island, Washington; and Alex Villicana of Re:Find Distillery in Paso Robles, California. We’re also welcoming back to the board former board president Mark Shilling, now of Maverick Distilling in San Antonio, Texas.
We’d also like to extend our gratitude to
outgoing board members Lucy Farber (St. George Spirits, Alameda, California), Amber Pollock (Backwards Distilling, Casper, Wyoming, and outgoing board vice president) and Mark A. Vierthaler of Whiskey Del Bac in Tucson, Arizona. Departing board member and outgoing secretary/treasurer Jeff Kanof will remain as Ex-Officio member.
The national digital election was administered with the help of the election’s chair, Reneé Bemis of Driftless Glen Distillery in Baraboo, Wisconsin, and Jeff Wuslich of Cardinal Spirits in Bloomington, Indiana.
We have our work cut out for us in these greatly challenging times for small distilleries. We are fortifying our efforts to advance our top priorities: expanded market access, regulatory relief, and changes to an anti-competitive marketplace at both the state and federal levels.
AMERICAN DISTILLING INSTITUTE
The American Distilling Institute is gearing up for our 22nd annual Craft Spirits Conference and Expo this August 24-27 at the Henry B. Gonzalez Convention Center in San Antonio, Texas, a UNESCO City of Gastronomy. We’re looking forward to four full days of workshops, tours, breakout sessions, panels, and the largest trade show floor in the industry. Highlights include a keynote address by Alexandre Gabriel and dozens of panels on topics ranging from distillery finance and pitching to distributors to technical nuances of spirits production. There will also be a welcome tasting at the Marriott Riverwalk and a Texas-themed closing event at the Grotto at the Convention Center, complete with live music and a Riverwalk boat tour. New this year, we’ll also be hosting a Texas-focused cocktail competition on the show floor hosted by Eric Kozlic, host of The
Modern Bar Cart podcast and principal of Direct Fire Consulting. Five bartenders will make five cocktails featuring the spirits of five Texas distilleries — and 500 attendees will judge the results.
We’re also excited about the many ticketed workshops we’re offering this year. A fullday whiskey summit with a packed roster of speakers, interactive events, and networking opportunities will be essential for producers and connoisseurs of this popular category. Nancy Fraley will also offer two sessions of her popular Nosing for Faults workshop, and Reece Sims of Flavor Camp will lead a workshop about Texas whiskeys. There will be a ticketed American single malt tasting, as well as the ever-popular full-day Distillery Safety Boot Camp. You can get conference and workshop tickets online on our website, distilling.com, plus access to our discounted
DISTILLED SPIRITS COUNCIL OF THE UNITED STATES
It was great to see more than 450 spirits industry leaders and supply chain
partners gathered in Washington, D.C., for the DISCUS annual conference where they
We are encouraged by the recent introduction of the bipartisan USPS Shipping Equity Act by U.S Rep. Dan Newhouse (R-WA) and Rep. Suhas Subramanyam (D-VA). The legislation allows the U.S. Postal Service to ship alcoholic beverages to consumers. If the bill passes, it will provide access to another important delivery option for small distillers in the U.S. We will continue to urge Congress to pass the bill, as well as support our other top government priorities.
It will be an extremely busy year ahead, and all of us on the board and throughout ACSA’s membership are rolling up our sleeves and getting to work.
hotel room block at the Marriott Riverwalk San Antonio and discounts on United and Southwest tickets.
Beyond the conference, we’ll host Nancy Fraley’s sought-after Blending, Maturation, and Warehousing workshop at Ironroot Republic Distillery in Denison, Texas, once again in December 2025. This workshop is an unparalleled opportunity to gain practical, hands-on experience with some of the most challenging aspects of spirits production under the guidance of one of the industry’s leading experts. This workshop always sells out, so don’t delay your registration. We also have a packed roster of engaging webinars all year long — check out our events page for more.
Have a great summer, and hope to see you in San Antonio.
Erik Owens
President,
American Distilling Institute
were able to network, share ideas, and drive innovation. The conference also included a Capitol Hill fly-in, where attendees met directly with members of Congress and their staff to discuss pressing issues facing the spirits industry.
Conference sessions covered topics such as the future of the spirits marketplace, tariffs, the Dietary Guidelines for Americans, sustainability in the industry, and more. Featured speakers included U.S. Rep. Morgan McGarvey (D-KY) and representatives from the U.S. Department of Agriculture, the Mexican embassy, and the European Union.
This year’s conference was a huge success not only for the great cocktails and conversations shared by attendees, but also for the effective advocacy we carried out on Capitol Hill. Holding the conference in D.C. was perfect for our industry leaders to gather and build for the future by engaging top lawmakers.
We Need Toasts Not Tariffs!
According to our most recent export report, distilled spirits were exported from 43 states in 2024. Nearly 85 percent of U.S. spirits exports go to countries that have eliminated tariffs on all U.S. spirits, and approximately 98 percent of spirits imports originate from countries that have eliminated tariffs on U.S. spirits. Continued access to global markets creates jobs, supporting rural and urban communities.
Unfortunately, our industry has been embroiled in trade disputes with many of our top trading partners unrelated to our sectors. The damage to the U.S. hospitality sector resulting from tariffs on spirits will have lasting, negative impacts.
Right now, Spirits United is running a petition with the Toasts Not Tariffs Coalition
to collect signatures for a letter to the Trump administration requesting #ToastsNotTariffs! Add your voice at www.spiritsunited.org.
USTR Highlights Spirits Sector’s Concerns in 2025 Report on
Foreign
Trade Barriers
The Office of the U.S. Trade Representative (USTR) recently released its annual report on foreign trade barriers for 2025. Each year, DISCUS submits a comprehensive compilation of the major trade barriers confronting the U.S. distilled spirits sector to USTR. It is important that DISCUS submits these detailed trade barriers to USTR, as it provides a baseline for USTR to understand the priority trade issues impacting the U.S. spirits industry.
USTR’s 2025 foreign trade barriers report includes 24 trade barriers in 15 markets that were raised in the DISCUS submission. Specifically, USTR included the following markets and issues: Argentina: tariffs; Brazil: discriminatory taxes; Canada: provincial liquor boards and translations; China: retaliatory tariffs; Costa Rica: discriminatory taxes; EU: packaging; Ireland; Ecuador: tariffs; India: tariffs, customs valuation and standards; Indonesia: tariffs, discriminatory taxes; Malaysia: tariffs, discriminatory taxes, and standards; South Africa: tariffs; Thailand: tariffs; Taiwan: discriminatory taxes; Turkey: discriminatory taxes and retaliatory tariffs; Vietnam: tariffs and special consumption tax.
Updates From the States
Spirits-based ready-to-drink (RTD) cocktail legislation is moving forward in several states including tax reductions in Hawaii,
JAMES B. BEAM INSTITUTE FOR KENTUCKY SPIRITS
2025 Conference Sets Attendance Record
This annual event brings Kentucky’s spirits industry together to share best practices, explore new discoveries, and advance the global growth and sustainability of the American whiskey industry. The 2025 event smashed attendance records with more than 100 talks
and 1,400 attendees from around the world. In addition to extensive programming on grains, mashing, fermentation, distillation, and maturation, one key session highlighted the industry’s latest advancements in our understanding of geosmin defects in grain and water. Dr. Seth DeBolt, Dr. Don Livermore,
New York, Ohio, and Oregon and retail expansion in Alabama, Texas, and Oregon. We successfully eliminated a tax threat in New Mexico and are supporting direct-to-consumer shipping legislation moving in Iowa and Illinois. If you would like to help get legislation on RTDs passed in your state, let us know!
Responsibility.org Urges Consumers to Drive Responsibly This Summer
As we look forward to warm summer days and vacations, it’s essential to remember the importance of responsible behavior behind the wheel. The period between Memorial Day and Labor Day is often considered the 100 deadliest days on the road due to the historically high number of traffic fatalities. According to the National Highway Traffic Safety Administration, an estimated 12,429 people were killed in drunk driving crashes involving a driver with an illegal blood alcohol content or BAC (.08 or greater) in 2023, and these crashes are 100 percent preventable. Responsibility looks great on each of us, so remember that if you have plans that involve an alcohol beverage, always plan for a safe ride home and never drive drunk or impaired. Learn more about how alcohol affects your BAC — including your actions, behaviors, and capabilities, by downloading and using the Virtual Bar app. Have your friends and family do the same. Have a safe and responsible summer!
Chris R. Swonger President & CEO, Distilled Spirits Council of the United States
Dr. Gosia Chwatko, and Dr. Nicole Kfoury each presented their latest findings. Together, they addressed best practices in the prevention, detection, and remediation of geosmin defects. We look forward to seeing you all again March 16-18, 2026, to share more of this year’s important discoveries in distilled spirits.
Standardization of Methods
The Beam Institute is looking for partners to support the standardization of methods in
the distilling industry. In addition to forthcoming organizational partnerships, we are looking for experienced distilling chemists to commit time to developing these methods. Interested parties should reach out to harmonie.bettenhausen@uky.edu
The Latest from Our Research Team Direct questions to brad.berron@uky.edu.
> “Impact of Bourbon Continuous Column Operations on Ethyl Carbamate Levels.” Berron, B. J.; Brown, J.; Gambrell, J.; Cantrell, T.; McIntosh, M.; Wilson, S. A.; Gollihue, J.; Bettenhausen, H. M., Journal of the American Society of Brewing Chemists 2025, 1-7.
Ethyl carbamate levels in whiskey are strictly enforced in Canadian and European markets. The Beam Institute collaborated with distillers from across Kentucky to measure the impact of distillation configuration and cleaning on the level of ethyl carbamate in new make spirit. Samples were collected at Castle & Key Distillery, then EC was measured at the lab at Bardstown Bourbon Company. This report is freely available online.
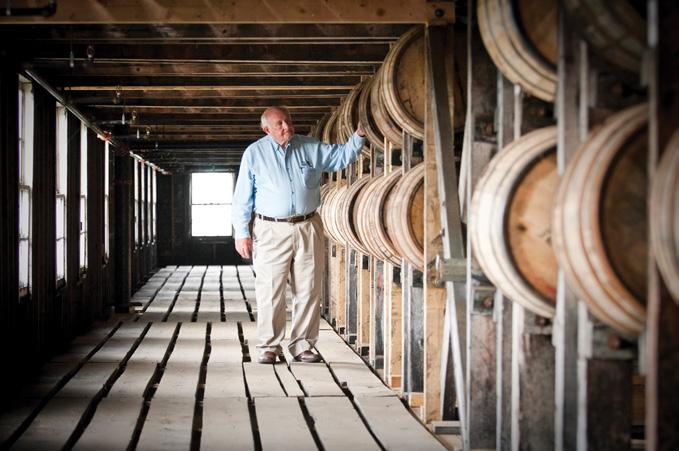
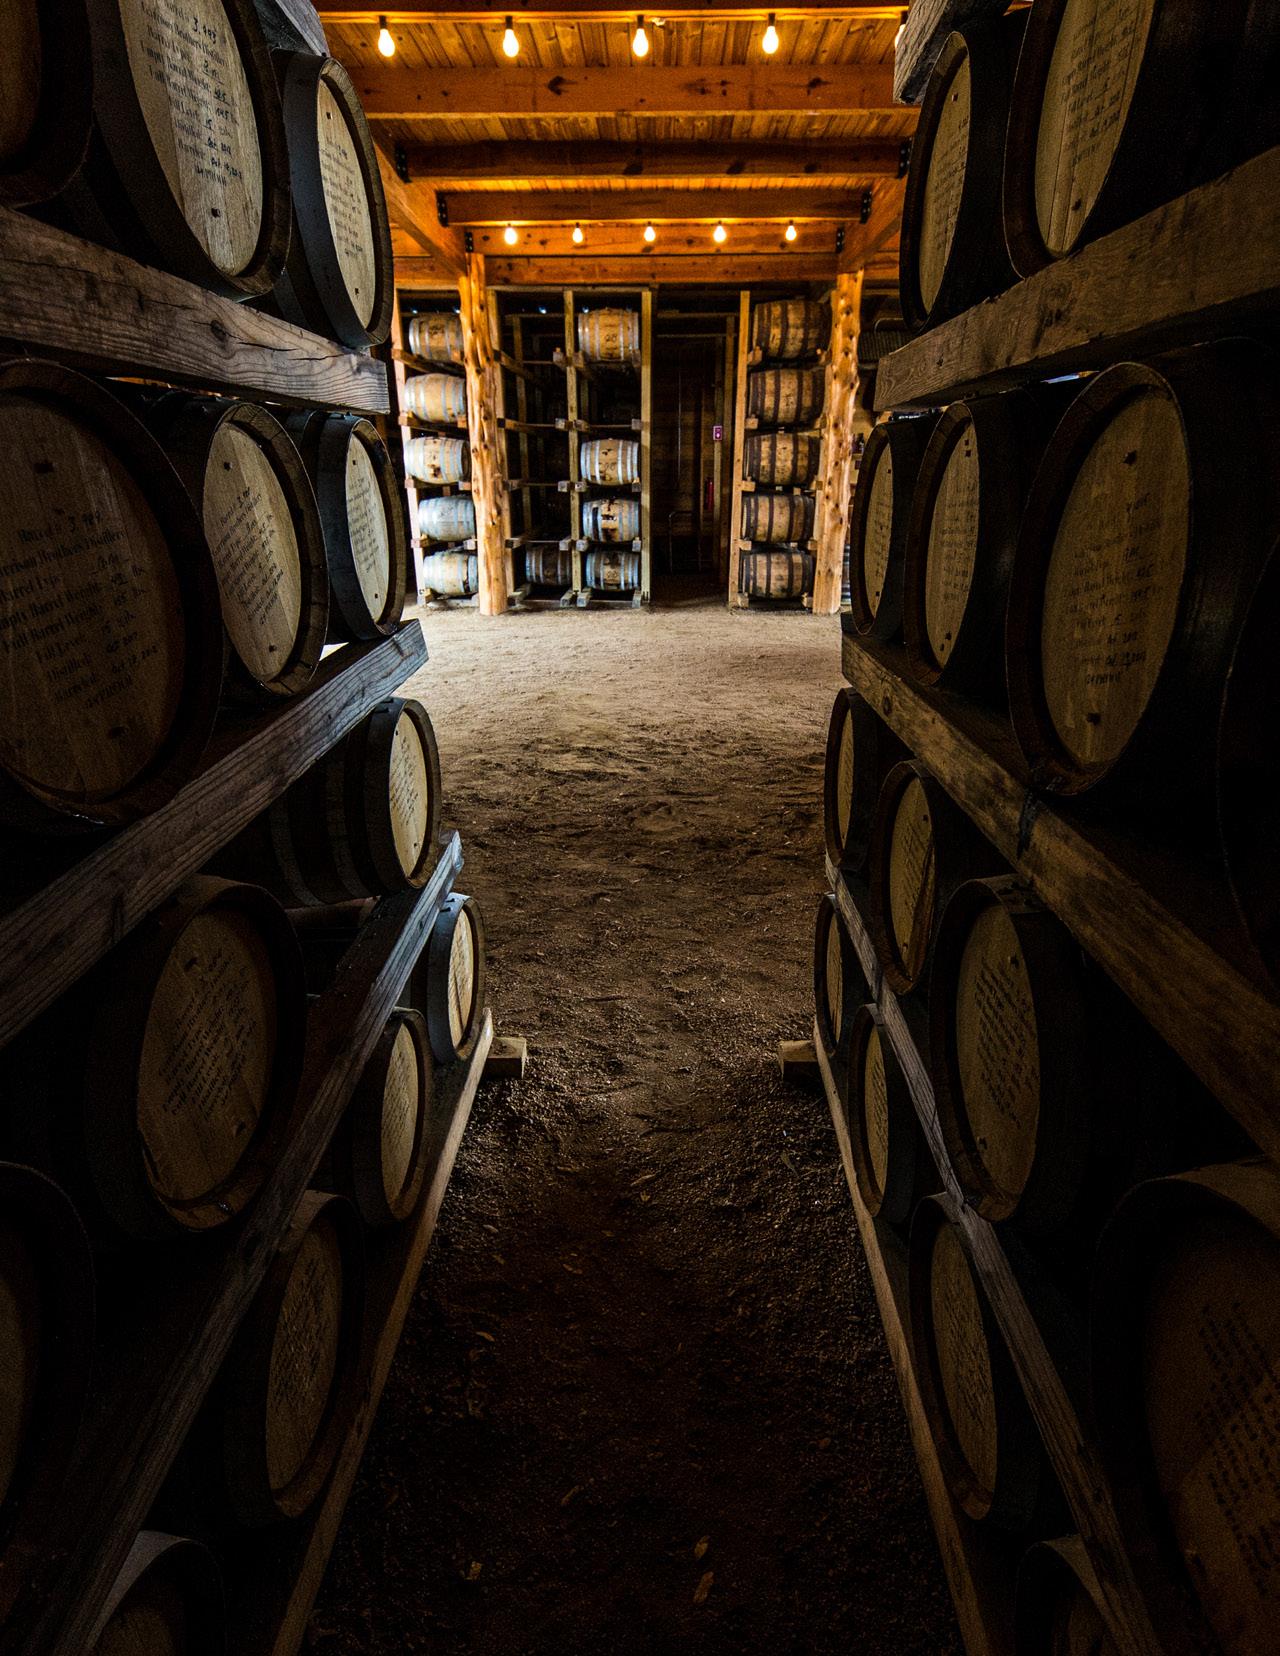
> “Reducing Product Loss Through Ventilation in Bourbon Maturation Warehouses.” Schafrik, S. J.; Long, M. W.; Wedding, Z. E.; Diddle, B. M.; Agioutantis, Z., Sustainability 2025, 17 (2), 699.
The maturation environment has a strong effect on the character and quantity of whiskey products. This work provides the first public analysis of airflow in rickhouses using natural ventilation. Researchers applied analysis tools from the mining industry to safely measure the movement of air through the various zones in a maturation warehouse. This work is freely available online.
> “A haplotype-resolved reference genome of Quercus alba sheds light on the evolutionary history of oaks.” Larson, D. A.; Staton, M. E.; Kapoor, B.; Islam-Faridi, N.; Zhebentyayeva, T.; Fan, S.; Stork, J.; Thomas, A.; Ahmed, A. S.; Stanton, E. C.; Houston, A.; Schlarbaum, S. E.; Hahn, M. W.; Carlson, J. E.; Abbott, A. G.; DeBolt, S.; Nelson, C. D., New Phytologist 2025, 246 (1), 331-348.
American white oak casks are critical to the maturation of distilled spirits around the globe. Catastrophic disease and insect events have devastated chestnut and ash species. A team including the University of Kentucky, University of Tennessee, and US Forest Service (USFS) took a first step in safeguarding the future of American white oak. With additional industry support by Independent Stave Company and Maker’s Mark, the team mapped the genome of the American white oak to allow researchers to quickly identify subpopulations resistant to future threats. This work is freely available online.
Brad J. Berron
James B. Beam Institute for Kentucky Spirits, Chemical and Materials Engineering, University of Kentucky, Lexington, Kentucky
IS YOUR GUILD OR ASSOCIATION MISSING? Don’t miss out on this opportunity to reach a national audience of distillers and suppliers! Share your latest victories, recruit supporters, request suggestions to solve your latest challenges, and inspire fellow groups. Email brian@artisanspiritmag.com to get involved!
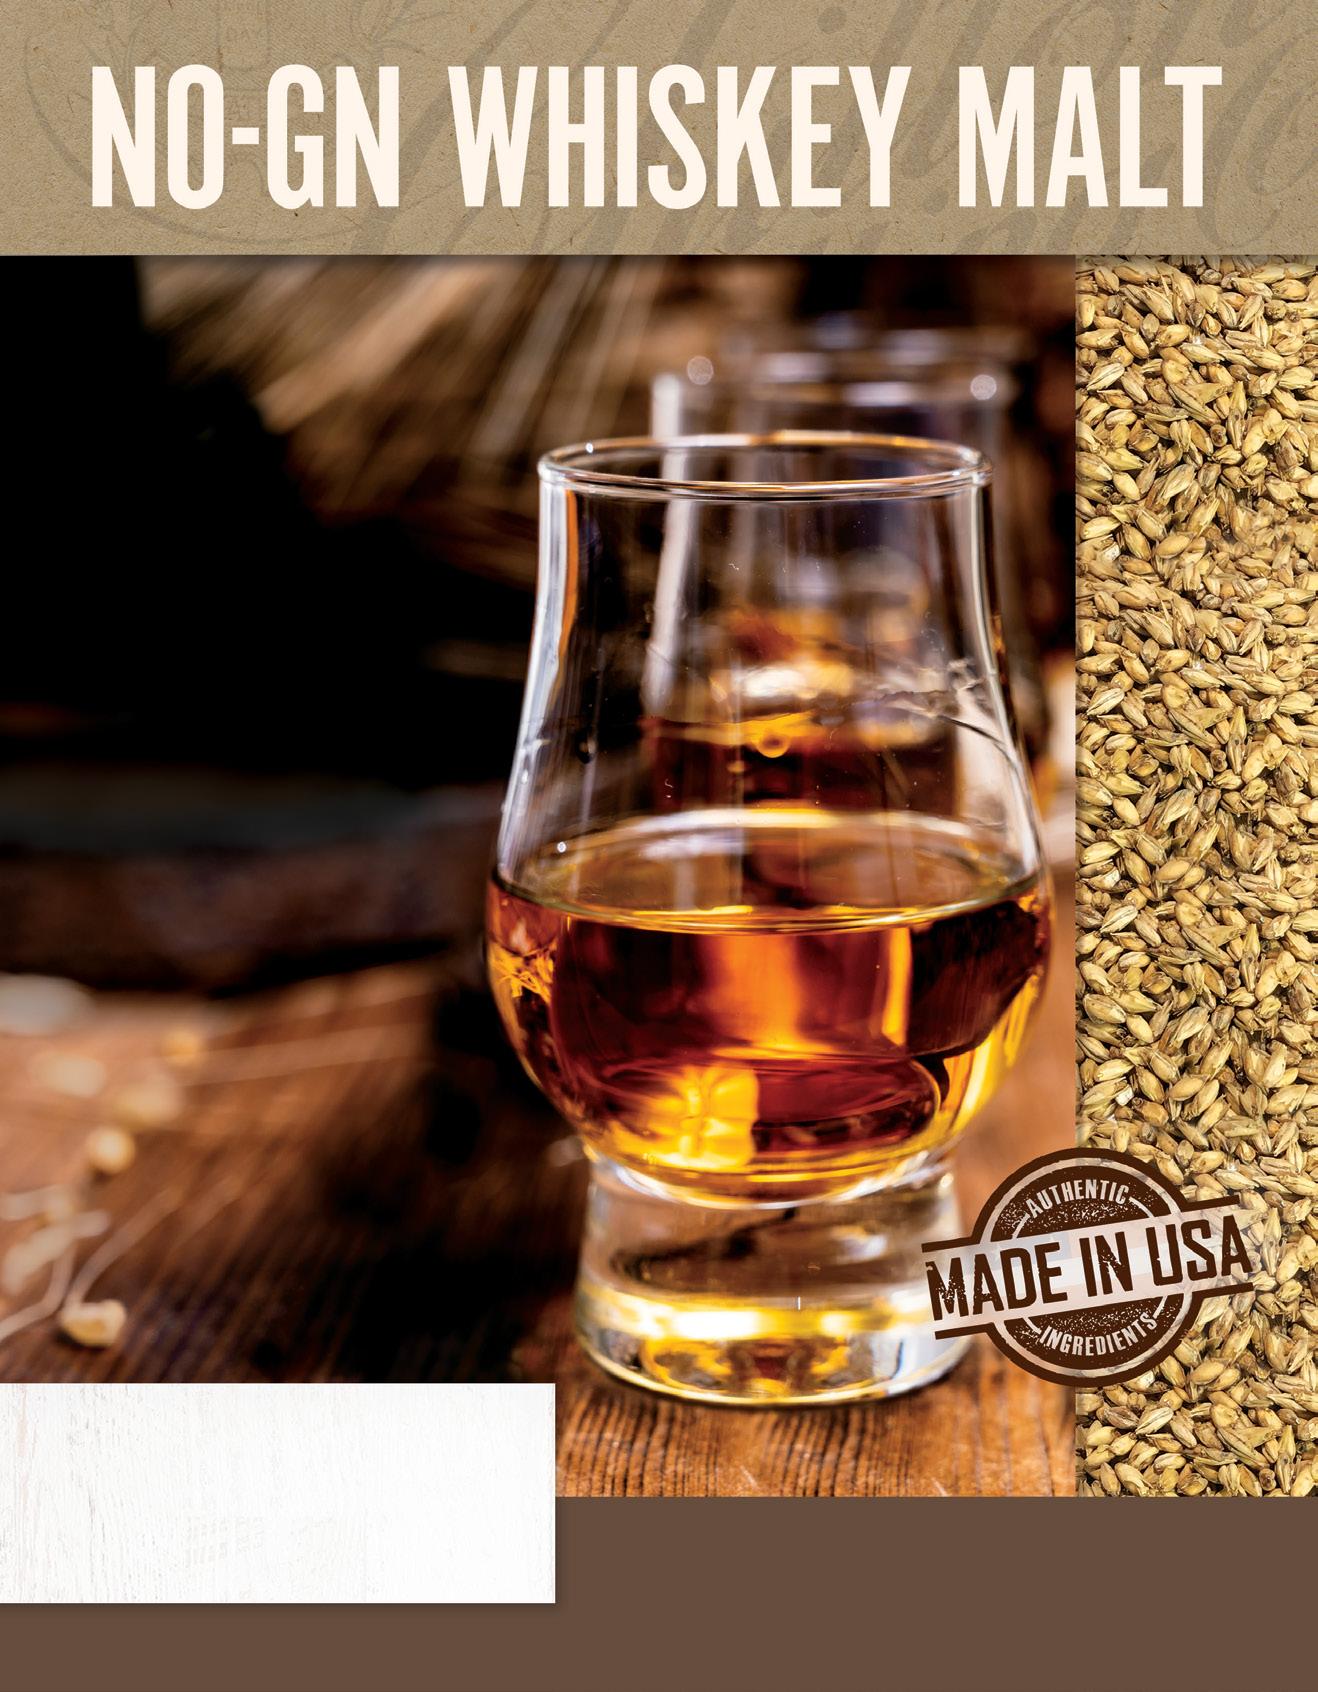
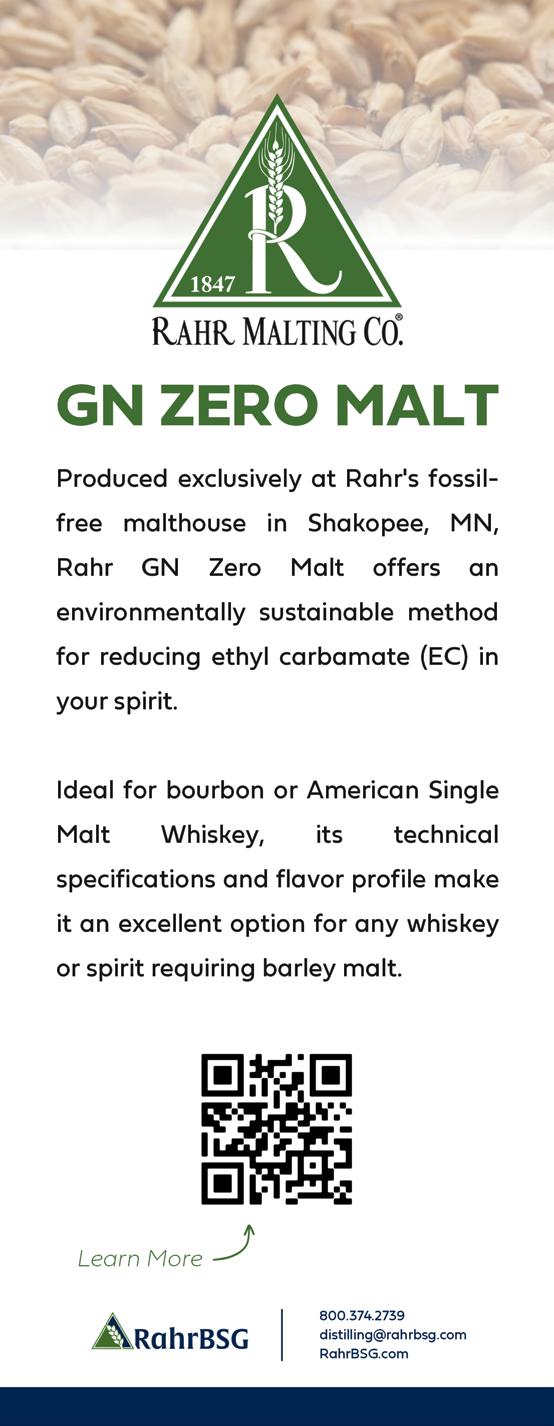
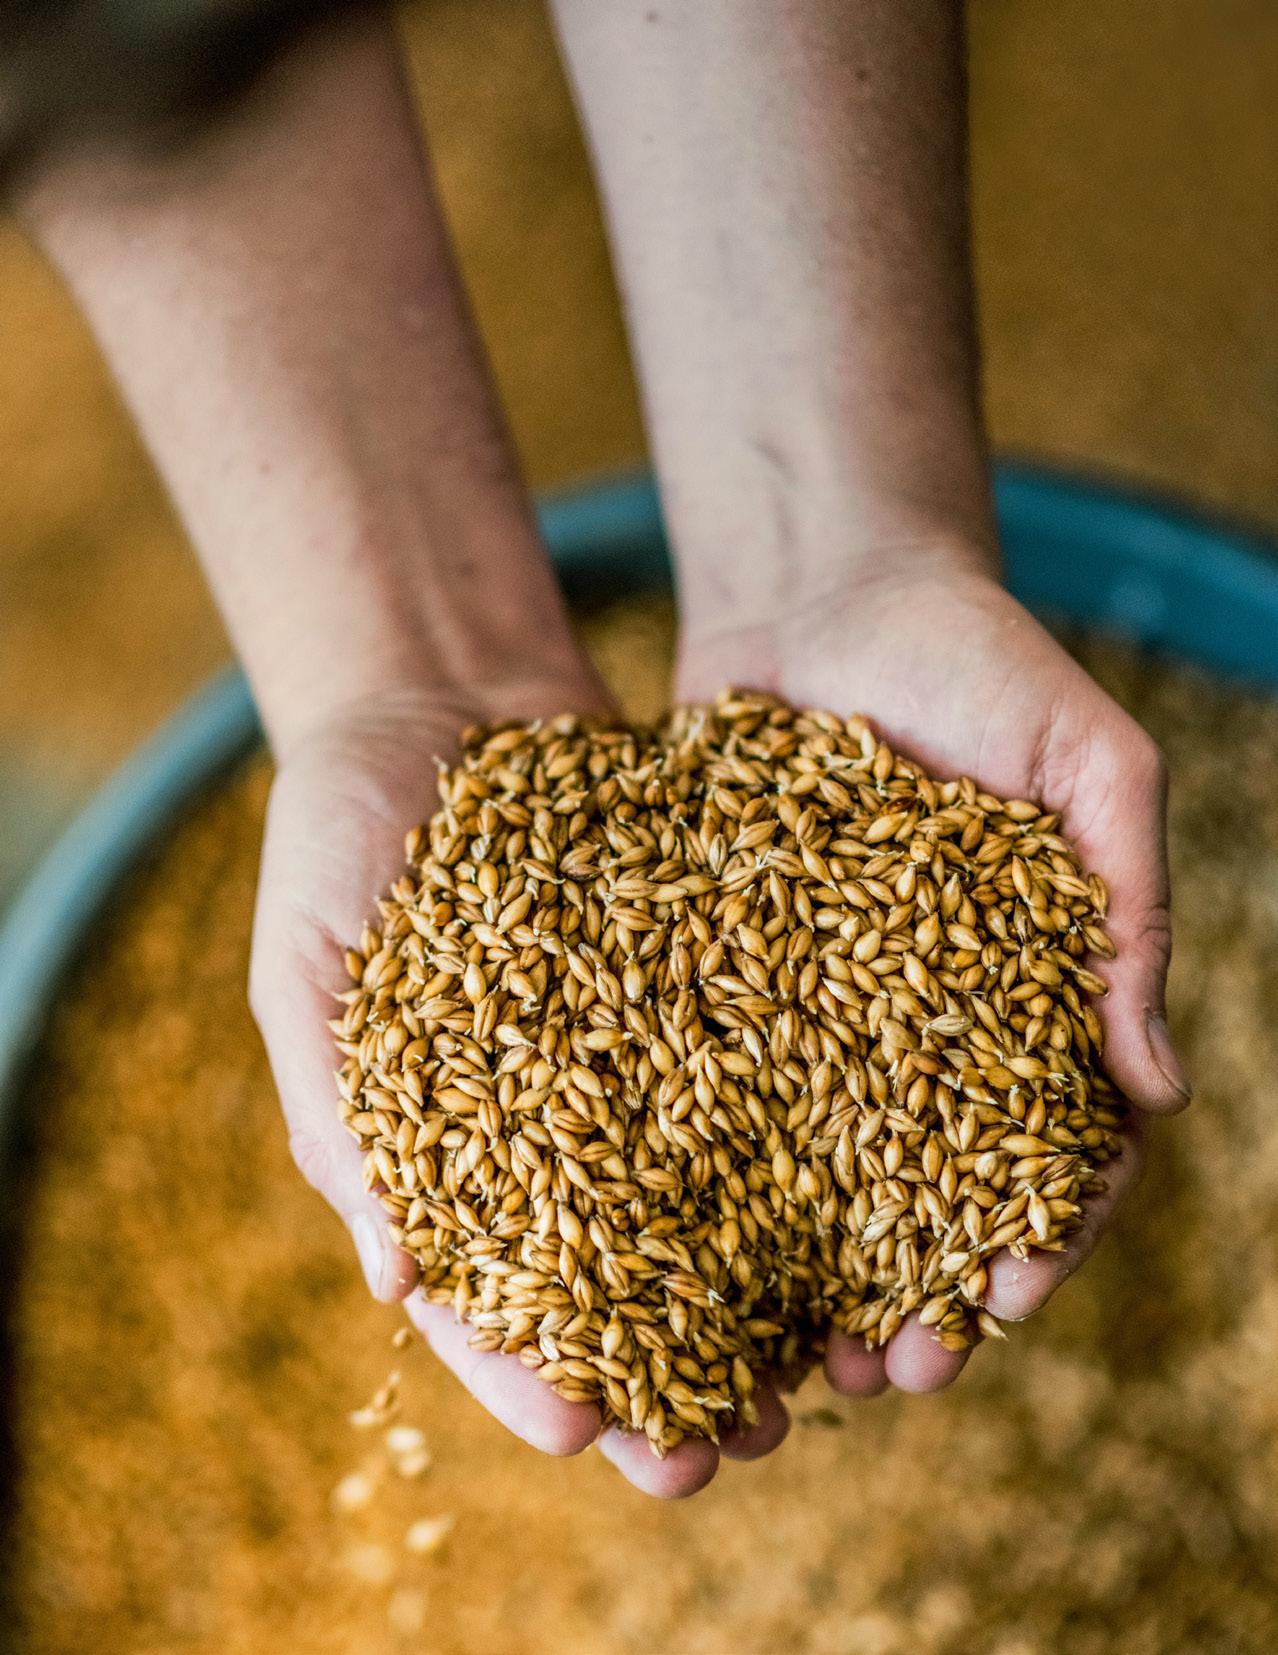
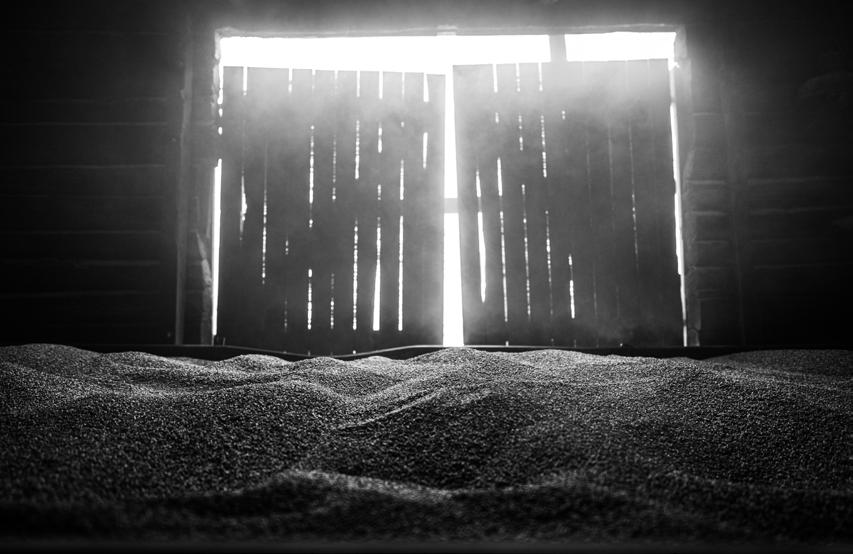
No-GN barley, assuring low levels of Ethyl Carbamate
Designed for all-malt whiskeys
Sweet & bready, with notes of honey
Available in whole kernel and flour
The recent trade policies of the United States, along with the associated rhetoric, have caused what can only described as chaos in the global economy. One of the many industries that has been significantly affected is the global spirits industry. This is because the United States is both the largest economy in the world and largest alcohol beverage market. As such, United States trade policies have a significantly larger impact on the distilled spirits industry globally than they might have on some other industries.
In addition, the negative rhetoric coming out of Washington toward the United States’ largest trading partners has resulted in retaliatory tariffs against U.S. spirits and a variety of other non-tariff trade barriers. Among other things, American products including bourbon and other American-produced alcohol beverages are being pulled from Canadian and Mexican shelves as a result. Canada’s government has specifically called out bourbon in response to the imposition of the new U.S. tariffs and associated rhetoric. So have many others.
In short, these trade policies and related rhetoric are
sales in the alcohol beverage industry are significantly down across all categories and tiers.
TARIFF C H A O
harming America’s brand.
President Trump has a very different view of tariffs and other non-tariff trade policies from any other U.S. president in recent history, believing that they should be used as leverage to negotiate better “deals” for the U.S. While it remains to be seen if this approach will be beneficial to the United States in the long term, what is certain is that there are short-term effects and uncertainty that is causing significant pain within the beverage alcohol industry on a global basis.
Everyone’s hope is that these tariffs and other non-tariff trade barriers will be short-lived. However, the resulting chaos is severely impacting the alcohol beverage ecosystem at a time when
As a result, businesses within the alcohol beverage ecosystem must become more proactive in managing potential supply and international trade-related risks and implement mitigation strategies when and wherever possible.
A few key steps to begin doing so include:
▶ Mapping your company’s global supply chain
▶ Compiling supplier commodity data and spend by country
▶ Compiling customer commodity data and revenue by country
Once a company begins to proactively visualize and track the types of data listed above, a company can begin to assess the tariff and non-tariff costs and risks to their business in the current environment.
It should be noted here that even companies that don’t import or export should do this type of analysis given the current circumstances. This is because, while your company may not be engaged in international trade, your suppliers (and customers) likely are.
Written by STEPHEN GOULD
Duties, Tariffs, and Taxes
The terms “duty” and “tariff,” for the purposes of this discussion, mean essentially the same thing. These are taxes that are charged on the importation or exportation of materials, products and (at times) technologies. They should not be confused with the term “freight tariff,” which refers to the price a shipping company charges to transport goods from one place to another. Further, while the term “duty” can be used for exports, it is far more commonly used for imports.
A duty or tariff is essentially a value-added tax, in that it is assessed on the valuation of goods at one point in time as they move through the supply chain. That valuation includes all the added value from all prior points in the supply chain to that point in time. So, the value of a bottle of spirit when it enters the customs territory of a county is typically used to assess the import duty or tariff, despite the fact that it will typically have a higher value once it has cleared customs and all associated freight, duties, tariffs, taxes, and other costs have been paid.
It is important to note that, as with any other tax, a duty or tariff is an added cost that the importer must pay. Those costs are typically passed through the supply chain to the consumer the same as all other taxes assessed on goods or materials in the supply chain.
Another thing to consider is that a duty or tariff can be thought of as an additional excise tax, one that only applies to imports. In fact, in some countries both types of taxes will be structured exactly the same.
In the U.S., the main differences between import tariffs and federal alcohol excise taxes are:
▶ A duty or tariff is collected by the U.S. customs authority, the U.S. Customs Service, while U.S. excise tax is collected by a part of the U.S. Treasury called the Alcohol and Tobacco Tax and Trade Bureau (TTB).
▶ The majority of U.S. tariffs are assessed on an ad-valorum basis (aka an ad-valorum tariff). In other words, they are assessed as a percentage of the U.S. dollar value of the goods at the time of import. In contrast, U.S. alcohol excise tax is assessed on the volume of alcohol. This is known as a specific basis (aka a specific tax or tariff). Further, individual states will have different excise tax structures, just as other countries will.
▶ The majority of U.S. tariffs are assessed at the same ad-valorum rate regardless of the quantity of goods imported. In contrast, U.S. alcohol excise tax is a multi-tiered tax (i.e. the rate changes based upon quantity). In this case the first 100,000 proof gallons are, under the CBMRTA, taxed at a significantly lower rate. This is true for both imports and U.S.-produced alcohol.
In the case of imports, the importer must pay the full excise amount and then file to “draw back” the difference between the reduced amount and the full amount. This is a task that, due to the reductions in force across the U.S. government, has become a lengthy process, one that importers need to be keenly aware of. For example, if an importer is importing 100,000 proof gallons per year, the drawback on that excise tax is worth roughly $1 million dollars to that importer.
Similarly, some exports of goods produced with foreign content (a finished bottle of U.S. produced whiskey or spirits with a Portuguese cork, or a foreign-produced bottle) when exported from the U.S. may qualify for the duty on the cork or glass (i.e. the foreign content) to be drawn back. It should be noted both that these rules have changed numerous times in recent years, and that if duty drawback is allowed, that the process faces similar challenges to the excise tax drawback process mentioned above.
Another factor that needs to be understood by businesses, especially those who are exporting or intend to export goods such as domestic spirits is the concept of retaliatory or punitive duties or tariffs. These are duties and tariffs that are assessed by one country on the importation of certain goods from another country to punish the exporting country for various political and economic reasons. These can be the result of trade disputes, wars, or a host of other things.
One recent example is the punitive tariffs on U.S. whiskey that were assessed by the European Union to punish the U.S. for both the steel and aluminum and Boeing/Airbus trade disputes several years ago. In that instance, the U.S. lost 48 percent of market share in the EU and 53 percent in the UK between 2018 and 2022. As this example illustrates, these types of duties and tariffs have the potential to cause significant harm to the global alcohol beverage ecosystem.
Duty and Tariff Planning
Next, it is important to understand that, historically, U.S. tariffs have been relatively low over the last 50 years or so. Furthermore, for most goods only a single tariff has been assessed, making tariff planning fairly straight forward. All that has now changed. Since the beginning of the current administration in Washington, waves of new tariffs have been imposed. This means that someone importing goods may actually be subject to multiple tariffs at the same time (in some cases three or more different tariffs). These tariffs may then be “stacked,” resulting in much higher levels of tax being paid by the importer than, arguably, at any time in U.S. history.
Understanding Total Cost
Businesses need to understand the actual cost of goods they’re importing into the United States. While this may seem like a common-sense statement, in reality it is typical that most businesses do not fully understand or plan for actual costs. Too often a total cost analysis is nothing more than the item-price of a good with the base freight costs added (and maybe the applicable tariff or duty rates). The remainder of the actual costs associated with the international sale of the goods remain hidden.
When analyzing the actual cost of goods (and the associated expenses and margins on a transaction) of an international transaction, a business should lay out those costs end-to-end, taking into consideration the terms of sale (Incoterm — the international commercial terms of the transaction),
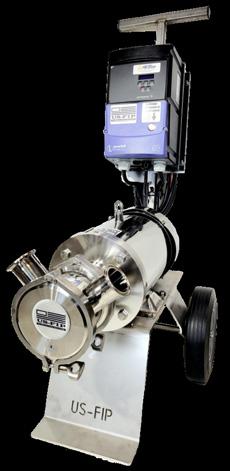
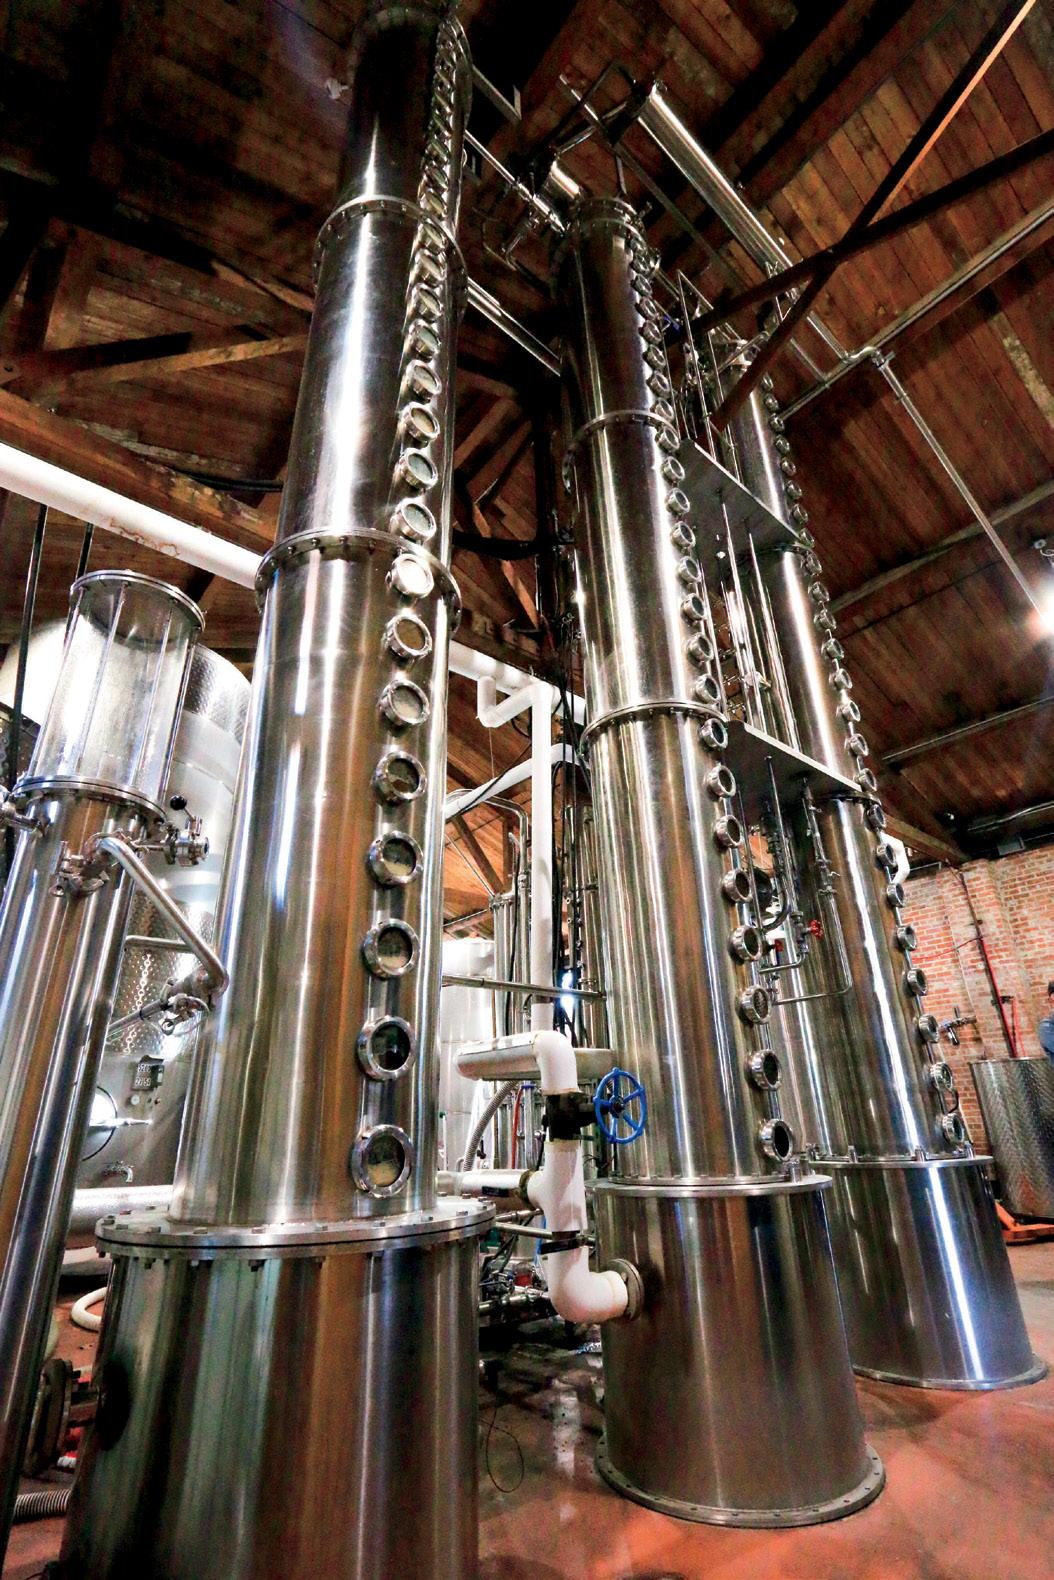
GRAIN NEUTRAL SPIRIT NEEDS
Distilled 7X through nearly 600 feet of distillation, our impurity-free grain neutral spirits will provide a superior base, saving you time and money.
REQUEST A QUOTE
Contact us about our updated 2025 rates. Shipping options include rail, tanker, tote, and drum.
and look at them end to end to fully understand both the planned and potential total costs and liabilities. This includes all material, packaging, freight, and other logistics costs, along with all applicable duties, tariffs, and all other applicable taxes.
Today, as opposed to just a few months ago, this means that companies importing goods or materials must reevaluate not only their exposure as it relates to current and potential import tariffs, but also plan for additional logistics costs related to transportation and customs delays. Increases in transportation and logistics costs related to tariff disputes must also be considered.
Spend and Risk Exposure by Country
Companies involved in international trade should continually analyze the potential risks of doing business with different countries as part of their ongoing operational planning process. Changes in politics, changes in materials availability, changes in the costs associated with the movement of goods, and issues such as war or natural disasters must be considered. These issues can negatively affect both the flow of goods and the overall costs and profitability of the related transactions.
In the current hostile trade environment, companies involved in international trade must take the current trade and tariff disputes into consideration, looking at both their international supply chain and customer markets as well. Those companies should then develop plans to respond to current and potential future changes to costs, market access, and customer demands.
Conclusions
Companies must understand the costs, challenges, and risks associated with both sourcing and selling internationally. This is even more important in the type of hostile trade environment the global economy is currently facing. This is especially true for the alcohol beverage industry, as our industry typically has more regulations, taxes, and controls than most other industries. Robust processes and procedures should be established that allow companies to plan effectively for changes and react quickly when necessary.
Stephen Gould is currently the principal consultant at Consulting Alchemist, Ltd., an international operations, supply chain management, and alcohol beverage consulting services firm. For more information see www.consultingalchemist.com.
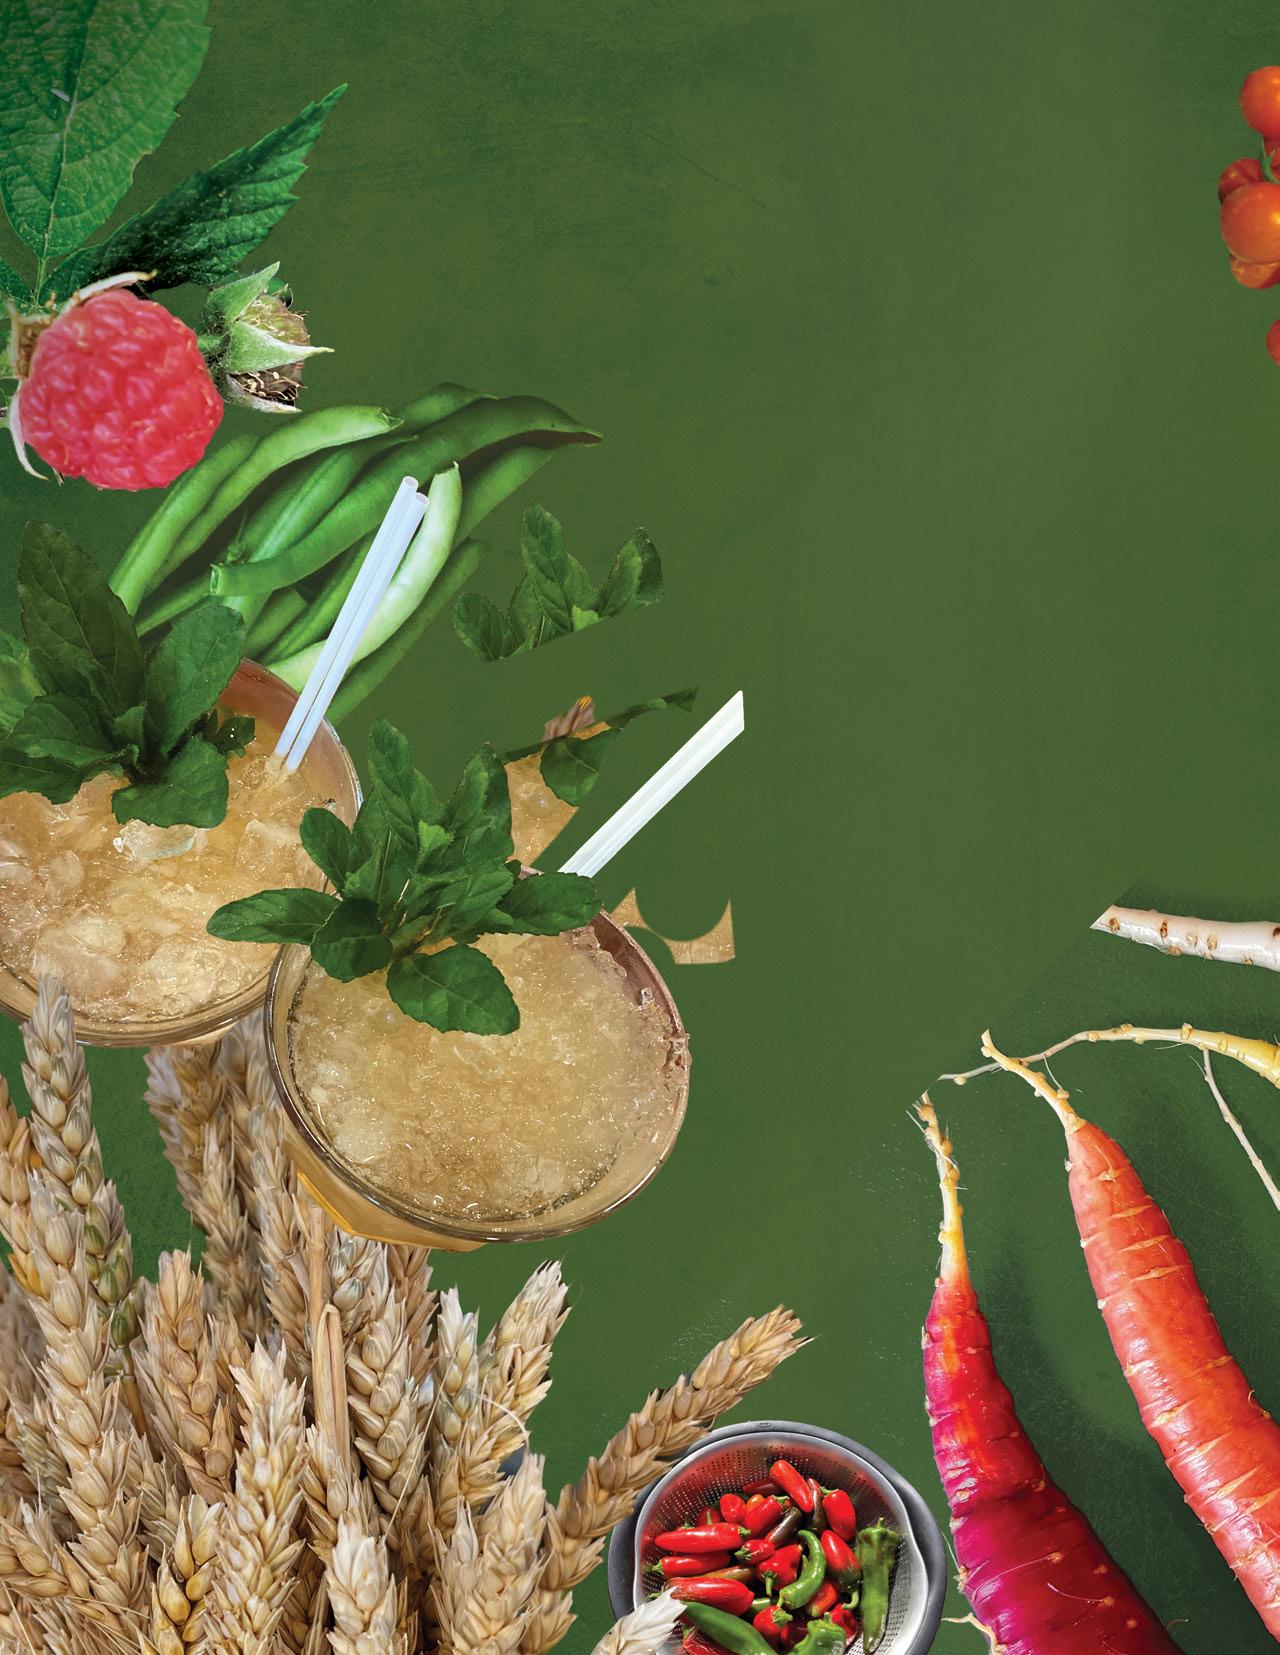
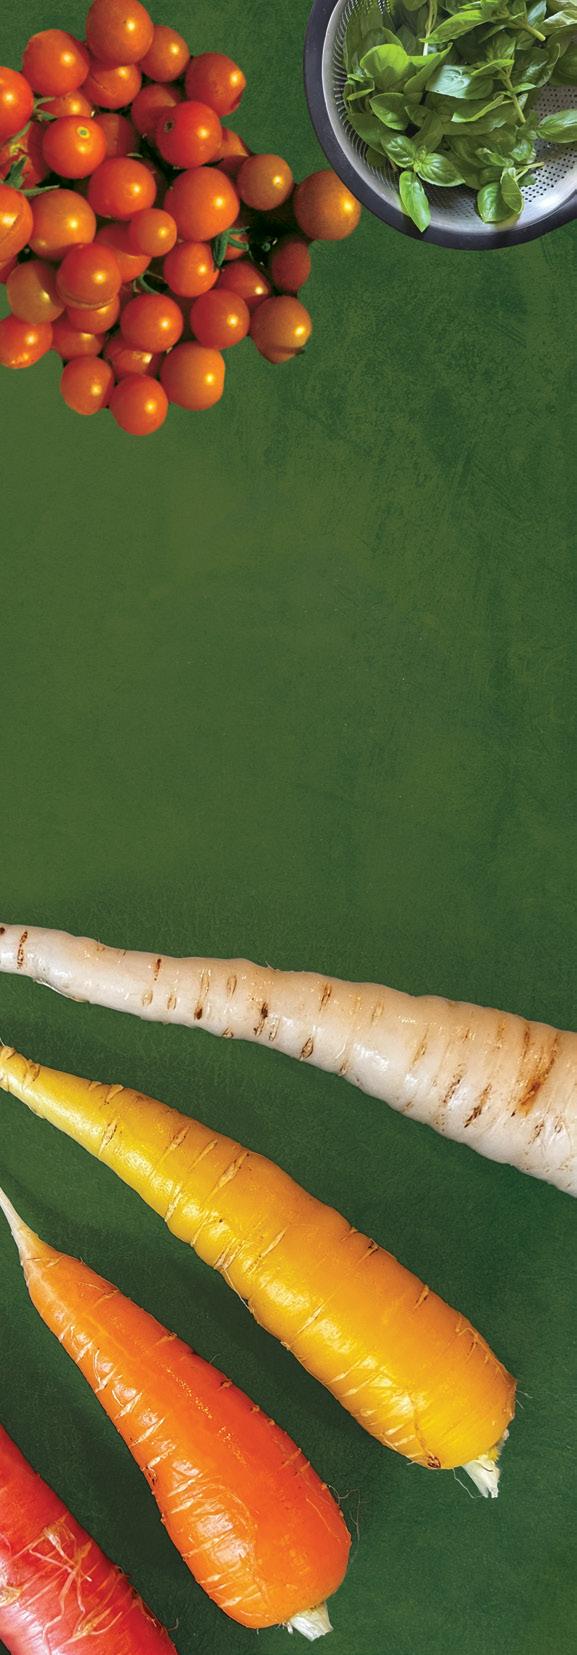
THE rISe OF LOW- & NO-ALCOHOL SPIrITS A $4 BILLION BANDWAGON
Over the past two years, there has been an explosion of lowand no-alcohol spirits. International Wine and Spirits Record (IWSR) estimates a +4 percent volume compound annual growth rate for low- and no-alcohol products from now until 2028.
DRIVERS OF LOW- AND NO-ALCOHOL CONSUMPTION
A December 2024 survey by NCSolutions, a CPG1 marketing research and advertising company, found that 49 percent of Americans aim to reduce their alcohol consumption in 2025, an increase from 44 percent in 2023. In 2024, 25 percent of Americans did not drink at all. While moderating and abstaining from alcohol are not new concepts, some additional factors are contributing to the current trend:
▶ POST-COVID DROP-OFF : A study by Keck Medicine of USC2 estimated that Americans’ alcohol use increased by 20 percent during the 2020 pandemic and remained at elevated levels into 2022. This rapid and dramatic increase in consumption led to record sales in the alcohol industry — numbers some assumed were the new normal — but as the population returned to “real life,” some consumers considerably dialed back their alcohol intake.
▶ PREVALENCE OF WEIGHT LOSS DRUGS : As of 2024, 13 percent of Americans had used GLP-1 weight loss drugs such as Ozempic,3 and a 2025 AP News report4 shows that half of Americans approve of using these drugs — meaning that usage is likely to increase. These drugs suppress appetite and have been linked to making drinking alcohol less appealing.
▶ DESIRE TO BE HEALTHIER : According to Statista,5 the No. 2, 3, and 4 most popular New Year’s resolutions for 2025 in the U.S. are all aligned with becoming healthier. This reduction in alcohol consumption for health reasons is not limited to a singular generation. According to NCSolutions, 58 percent of Gen Z cited mental health, and 48 percent of Baby Boomers cited weight loss as their reasons to abstain from alcohol.
▶ AGING : According to the National Institute on Aging (2022),6 as adults grow older, alcohol can lead to more complications, which is why they recommend older adults lower or stop their alcohol consumption. It can interact with medications and exacerbate existing health conditions. Additionally, older adults can become more sensitive to the effects of alcohol, potentially leading to accidents, injuries, or changes in mental health.
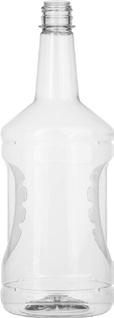
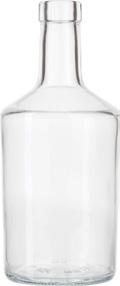
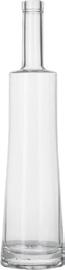
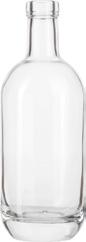
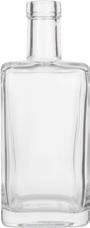
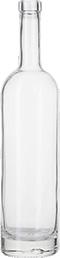
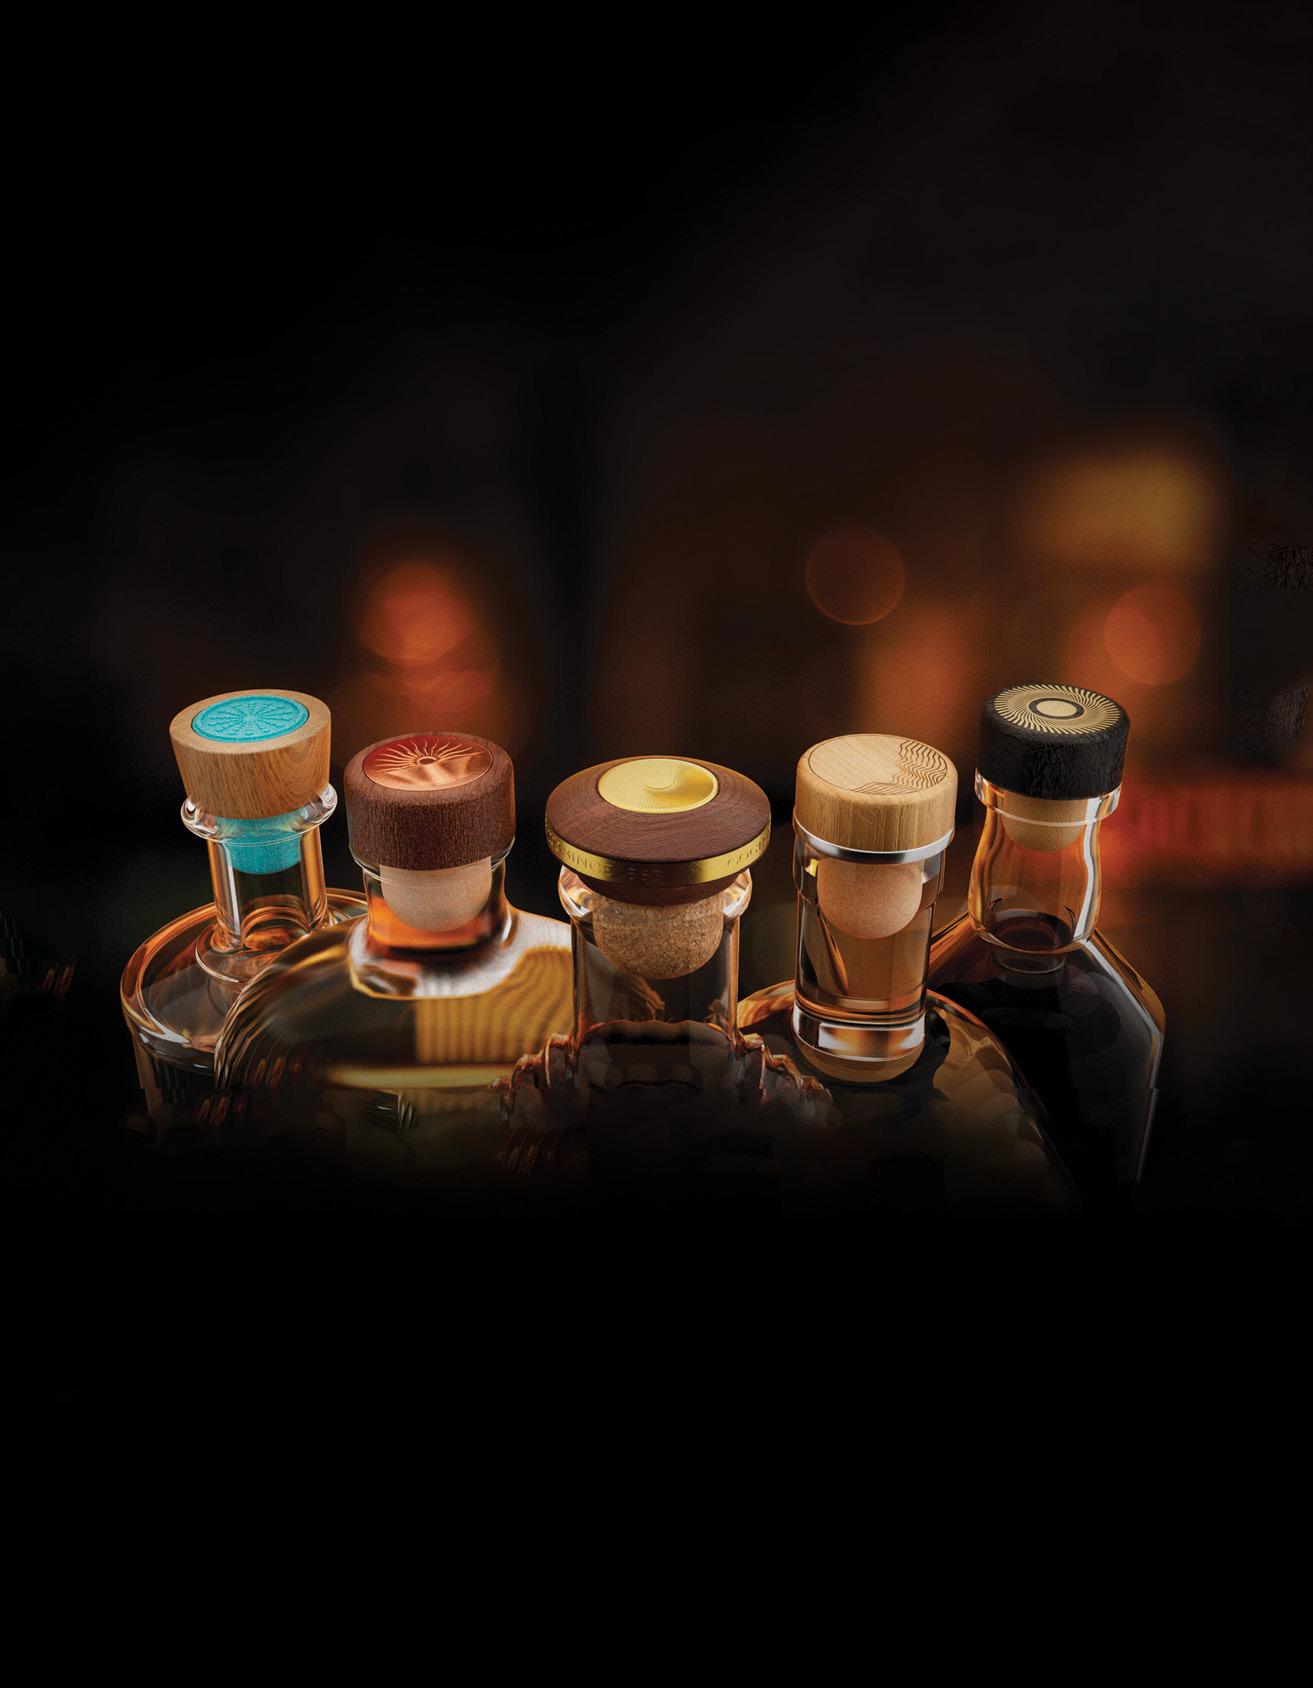
According to IWSR, the no-alcohol sector is expected to grow to more than $4 billion by 2028. This is a ripe opportunity and a potential new income stream for distillers. NCSolutions found that 20 percent of people who tried a non-alcoholic drink chose it just because they liked the way it looked. The big branding question you need to answer before moving forward with a low- or no-alcohol product is: What should the packaging look like? The short answer is: Differentiated from your current packaging. How different the packaging should be from your current packaging depends on your business model.
▶ HOUSE OF BRANDS MODEL : If your company follows a house of brands model and you have the bandwidth to support a new brand, developing a new low- or no-alcohol brand will help create a clear demarcation from your full-proof alcohol brand. Not only can the design look completely different, but you can also develop a brand name that communicates low or no alcohol content, and your marketing efforts can further reinforce this messaging. However, this also entails the time and investment necessary to build a new brand.
▶ BRANDED HOUSE MODEL : Offering a new low- or no-alcohol product that bears the same brand name as your current line allows you to take advantage of your existing brand recognition. Your customers are already familiar with and enjoy your spirits, so it’s not a huge leap for them to try your low- or no-alcohol products. This strategy also allows you to appeal to the occasion-based drinker providing product options for days when they want to drink alcohol or for when they want to abstain. However, you do not want a consumer to mistake your new low- or no-alcohol product as a traditional alcohol content product — nor do you want the opposite to happen. To avoid this, there are a couple devices that you can employ to prevent confusion:
• Color Coding: Color is a great way to help differentiate products because it doesn’t require any reading. A quick glance allows your consumers to immediately notice that a product is unique.
• Flavor Cues: Many products in the low- and no-alcohol space emphasize their ingredients and flavor profile to help differentiate from other products and to generate excitement about their taste. This can be accomplished through colors, text, or inviting illustrations of the flavors and ingredients.
• Sub-Brand Name: Developing a secondary brand name that speaks to the low- or no-alcohol promise can be a great method to build off your brand recognition and create a separate identity for your new low- or no-alcohol products.
• Emphasize Proof: Drawing extra attention to the lower proof of your product by making it larger than it normally would be on your package will help prevent mixups. For no-alcohol products, use phrases such as “No Alcohol,” “Non-Alcoholic,” “Alcohol Removed,” or “Zero Proof.”
While store shelves and bar menus are increasingly offering low- and no-alcohol options, some customers need reassurance before branching out into these new offerings. On your packaging, consider including recipes or images of cocktails and where the product can be used as a substitute for alcohol in traditional cocktails to encourage consumers to utilize your low- and no-alcohol products in the same manner as your traditional spirits.
The growing demand for low- and no-alcohol spirits presents an exciting opportunity for distillers to expand into a new market and find new revenue streams. As the market expands, encouraging consumers to embrace these options through creative packaging will be key to long-term success in the low- and no-alcohol sector.
David Schuemann is the owner and creative director of CF Napa Brand Design. For more information, visit www.cfnapa.com or call (707) 265-1891.
IT’S NOT ABOuT YOu
Written by Jason Barrett
From Starving Artist to Strategic Entrepreneur
The world of small business, particularly in the spirits industry, is filled with passionate entrepreneurs who start their journey out of love for their craft. While passion is an essential ingredient for success, it’s not the only one. The hard truth? It’s not about you — it’s about them. The customer, the folks who spend their hard-earned money with you so that you can keep going.
Understanding Market Demand
Too often, small producers fall into the trap of making the products they want to make without considering what consumers want to drink. While creativity and craftsmanship are important, they must be balanced with market demand. If you want to build a sustainable business, you need to step outside your own preferences and listen to your customers.
> Ask, Don’t Assume: Conduct tastings, gather feedback, and analyze sales trends to determine what resonates with your audience.
> Adapt Without Losing Identity: You don’t have to compromise your brand’s integrity, but slight adjustments in flavor profiles, packaging, or marketing can make a world of difference.
> Find the Intersection: The sweet spot is where your passion meets consumer demand. Align your creativity with what the market is craving.
The Danger of the Starving Artist Mentality
The “starving artist” mindset — doing what you love at all costs — can be a dangerous approach in business. While it might feel noble to stay true to a personal vision, it’s difficult to sustain a company on passion alone. If your customers don’t connect with your products, your business will struggle to survive.
> Passion vs. Profitability: The most successful brands find a way to merge their passion with market viability. Love what you do, but ensure there’s a paying audience for it.
> Be Willing to Pivot: If a product isn’t selling, it’s time to reevaluate. Sticking stubbornly to an idea that isn’t working can be costly.
> Treat Feedback as a Tool: Consumer opinions aren’t a threat to your vision — they’re a roadmap for improvement.
> Speak Their Language: Marketing efforts should focus on what excites the consumer, not just what excites you.
> Solve a Problem or Fill a Gap: People are more likely to support your brand if it offers something they need or desire.
> Create an Emotional Connection: Instead of telling consumers why your product is great, show them how it enhances their experience.
While creativity and craftsmanship are important, they must be balanced with market demand.
Shifting the Focus to Success
Passion is a powerful force, but in business success comes from blending passion with strategy. It’s not about convincing people to love what you love. It’s about finding what they love and aligning your offerings accordingly. The key to growth isn’t just doing what excites you;
it’s about listening, adapting, and creating something that excites your audience as well.
By stepping outside of personal preferences and embracing consumer insights, small business owners can shift from struggling passion projects to thriving, customer-driven brands. After all, it’s not about you.
Jason Barrett is the founder/master distiller of Black Button Distilling, the first craft distillery in Rochester, New York, since Prohibition. This summer, Black Button Distilling is celebrating a decade of crafting grain-to-glass craft spirits. A New York State Farm Distillery, Black Button Distilling is the first distillery in New York to obtain the New York State Grown and Certified status for commitment to locally sourced ingredients and high standards of quality. Named New York Distillery of the Year (2016 & 2021) at The New York International Spirits Competition, Black Button Distilling has produced more than 2 million bottles of spirits and has been named to the Inc. 5,000 list of fastest-growing privately owned companies four times. To learn more about Black Button Distilling, visit www.blackbuttondistilling.com.
HOW TO BUILD A CULTURE OF COMPLIANCE
A PRACTICAL GUIDE TO ALCOHOL BEVERAGE TRADE PRACTICE REGULATIONS
Navigating the complex web of federal and state alcohol beverage regulations is an ongoing challenge for producers, distributors, and marketing companies alike. Trade practice rules are designed to maintain a level playing field across the industry, ensuring responsible promotion and fair competition. The Alcohol and Tobacco Tax and Trade Bureau remains active, and just since January it has settled numerous offers In compromise that have focused mainly on industry members’ failure to pay federal excise taxes. Meanwhile, various states have active trade practice investigations. In either case, investigations can be quite costly for industry members. With regulatory scrutiny continuing, companies that have policies, procedures, and training in place are better positioned to avoid costly penalties and protect their brands.
A comprehensive trade practice compliance strategy should begin with a clear checklist and robust internal policies, but it must also be supported by ongoing communication, training, and access to up-to-date legal resources. The following best practices can help your organization build and maintain a strong culture of compliance.
1. DEVELOP OR UPDATE POLICIES AND PROCEDURES
At the core of any compliance program are clear, written policies that define permissible and prohibited activities that take into account each state’s alcohol beverage laws and regulations. These should include:
Rules around providing samples to retailers and consumers
Guidelines for tastings, merchandising, and point-of-sale activities
Limitations on providing retailer meals, gifts, entertainment, and event sponsorships
Proper procedures for credit and product returns
Firm prohibitions on impermissible actions, such as credit card swipes on behalf of retailers or fraudulent expense reporting
Protocols for responding to state or federal agency inquiries, document requests, or unannounced visits
Companies should regularly review and update these documents to reflect changes in the law or evolving business practices.
2. QUARTERLY COMPLIANCE COMMUNICATIONS
Keeping compliance front-of-mind is essential. Consider issuing quarterly newsletters or compliance bulletins that remind teams of critical do’s and don’ts, highlight recent enforcement actions, and reinforce company policies. These updates can serve as valuable discussion points during regular team meetings and serve as documentation of ongoing compliance efforts.
3. REGULAR TRAINING PROGRAMS
Training is the backbone of compliance. All employees involved in sales, marketing, promotions, or customer-facing roles should receive:
INITIAL TRAINING upon onboarding
REGULARLY SCHEDULED REFRESHERS via in-person seminars or web-based learning
ANNUAL Q&A SESSIONS with legal counsel or compliance professionals.
Encouraging an open environment where team members feel comfortable asking questions reduces the risk of inadvertent violations and improves overall understanding of complex regulatory requirements. This also helps mitigate potential fines. If you can show a regulator that the employee was trained and had access to the rules and regulations, it goes a long way to show that your company is doing all it can to keep compliant, despite the actions of this “bad apple.”
4. ACCESS TO PRACTICAL RESOURCES
Empowering your team with easy-to-access information is a must. Keep an internal compliance portal or toolkit with state-specific tied-house rules, FAQs, and reference guides. Encourage use of resources such as Set The Bar,1 which compiles trade practice rules for all 50 states in a user-friendly app. Managers should also be readily available to advise on compliant strategies to achieve business goals.
1 www.setthebarapp.com
5. DOCUMENTATION AND AUDITING
Maintaining state-mandated records isn’t just a formality — it’s a critical part of demonstrating your company’s commitment to compliance. Schedule periodic internal audits and compliance reviews to ensure records are being properly maintained, policies are being followed, and red flags are addressed promptly.
6. CONSISTENT ENFORCEMENT ACROSS THE ORGANIZATION
Policies only matter if they’re applied consistently. Ensure your compliance standards are upheld across all levels of your organization, from executive leadership to field teams. This demonstrates integrity to regulators and helps maintain a uniform standard of behavior.
7. THIRD-PARTY OVERSIGHT
If your company engages third-party marketers or promoters, make sure they are held to the same standards as internal teams. Share your trade practice policies with these third parties and consider including compliance expectations in your contracts. Even if violations are committed by a third party, your business may still be held responsible.
A PROACTIVE APPROACH PAYS OFF
No compliance program can completely eliminate the risk of enforcement. However, companies that can demonstrate they take trade practice compliance seriously through documented policies, training, audits, and a clear culture of accountability are far more likely to receive favorable treatment in the event of an investigation than companies that do nothing.
THE STAKES ARE TOO HIGH TO LEAVE COMPLIANCE TO CHANCE.
The stakes are too high to leave compliance to chance. Investing in a structured, practical, and consistent approach not only protects your licenses and brand reputation it empowers your team to operate with confidence in our highly regulated industry.
Alison Herman is of counsel attorney at Malkin Law, P.A., a law firm serving the alcohol beverage industry. Visit www.malkinlawfirm.com for more information. Nothing in this article is intended to be and should not be construed as specific legal advice.
CANADIAN COUNTERATTACK CANADIAN COUNTERATTACK
Retaliatory Tariffs & Actions’ Impact on the U.S. Alcohol Industry
Tariffs have been a constant presence in the news for several months now, and their impact on the international alcohol beverage industry has been widespread. President Donald Trump has long made clear his desire to use tariffs to bolster the United States’ economy, and the current tariff saga began on February 1, 2025, when he signed an executive order implementing an across-the-board 25 percent tariff on all goods originating from Canada.1 The threat of tariffs has long been a central prong of the economic policy he’s touted both on the campaign trail and since winning the 2024 Presidential Election. Given the potential for economic disruption, the Canadian government, at the provincial and federal levels, had threatened to levy retaliatory tariffs and potentially export controls if the Trump Administration made good on its vow to implement these new duties. Since this initial announcement, there has been a flurry of regulatory activity, with new duties announced for other countries and industries, some temporarily paused and others increased. However, the response by the Canadian government has caused one of the more pronounced impacts on the alcohol beverage industry.
DISCLAIMER: The situation regarding tariffs and retaliatory actions is fluid and can change daily. While the informa tion regarding the tariffs and retaliatory responses was current at the time this article was drafted, it may have changed in the intervening time. Please seek legal advice regarding the current status of the tariffs if you have any questions.
northern border shared with Canada.2 The executive order directed that an additional 25 percent duty be added to all goods imported for consumption and a 10 percent duty be placed on energy or energy resources.3 The executive order indicated that these duties will be effective starting February 4 and are subject to increase based on the Canadian response.4
In response to the executive order, former Prime Minister Justin Trudeau announced that Canada would retaliate with tariffs of their own. Effective February 4, Canada would implement a 25 percent import tariff on $30 billion worth of U.S.-produced goods, including orange juice, peanut butter, wine, spirits, beer, coffee, appliances, apparel, footwear, motorcycles, cosmetics, and pulp and paper.5 This would expand to $155 billion worth of U.S.-produced goods within 21 days, after allowing for a public comment period.6
United States-Mexico-Canada Agreement (USMCA) on March 7. Since the beginning of March, there have been additional tariffs and exemptions on aluminum, steel, and auto parts, the announcement of broader reciprocal tariffs from the U.S., and further exemptions. The status of different tariffs has been fluid and constantly changing, which has left many importers and exporters in the uncomfortable position of trying to make business decisions in an environment that can change from day to day.
The executive order implementing tariffs by the U.S., titled “Imposing Duties to Address the Flow of Illicit Drugs Across Our Northern Border,” focuses on the “sustained influx of illicit opioids and other drugs” that are allegedly being trafficked over the
1 See Executive Order Imposing Duties to Address the Flow of Illicit Drugs Across Our Northern Border, available at https://www.whitehouse.gov/presidential-actions/2025/02/imposing-duties-to-addressthe-flow-of-illicit-drugs-across-our-national-border/
Following these initial announcements, there has been significant back and forth between the two governments. The U.S. paused the initial round of tariffs for 30 days, beginning on February 3, and Canada announced similar plans. Following the 30-day pause, the tariffs took effect on March 4, and the U.S. then exempted goods compliant with the
2 Id.
3 Id. at Sec. 2(a)-(b).
4 Id. at Sec. 2(a)-(b), (d).
5 See Canada's response to U.S. tariffs on Canadian goods, available at https://www.canada.ca/en/department-finance/programs/international-trade-finance-policy/canadas-response-us-tariffs.html
6 Id.
Even with all the changes and exemptions, U.S. alcohol manufacturers have found themselves squarely in the middle of this impending North American trade war. U.S.-produced alcohol products are included on the list of goods subject to the initial 25 percent Canadian import tariff beginning on March 4. According to the Canadian government, the products targeted included, but are not limited to:7
> Beer made from malt
> Wine and fortified wine made from fresh grapes, including sparkling wine
> Vermouth and other wine made from fresh grapes flavored with plants or aromatic substances
> Cider > Prune wine
7 See List of products from the United States subject to 25 per cent tariffs effective February 4, 2025, available at https://www.canada.ca/en/department-finance/ news/2025/03/list-of-products-from-the-united-states-subject-to-25-per-cent-tariffs-effectivemarch-4-2025.html
> Perry
> Sake
> Ginger and herbal beer
> Mead
> Spirits derived from the distillation of wine or grape marc
> Rum and other spirits distilled from fermented sugar-cane products
> Gin and Geneva
> Vodka
> Whiskeys
> Liqueurs and cordials
> Tequila
> Ethyl alcohol for use in the manufacture of spiritous or alcoholic beverages
> Angostura bitters
> Spirituous fruit juices
> Fruit brandies
For alcohol beverage products imported from Canada into the U.S., the exemption for goods compliant with the USMCA may provide some relief.8 Specifically, Annex 3-C of the agreement provides for the “Internal Sale and Distribution of Distilled Spirits, Wine, Beer, and other Alcohol Beverages.” This section provides specific categorization and rules regarding different product designations, and given the exemption, it can provide guidance for U.S. importers. It is unclear how long this exemption will remain in place, and there has not been further guidance given by the Trump administration at this time.
Canadian retaliatory action against the U.S. alcohol industry has not been limited solely to the federal level. Much like the U.S., the
8 See Executive Order Regulating Imports with a Reciprocal Tariff to Rectify Trade Practices that Contribute to Large and Persistent Annual United States Goods Trade Deficits, available at https://www.whitehouse. gov/presidential-actions/2025/04/regulating-imports-with-a-reciprocal-tariff-to-rectify-trade-practices-that-contribute-to-large-and-persistent-annualunited-states-goods-trade-deficits/
Canadian alcohol industry is controlled at the federal and provincial levels. Individual provinces vary in their levels of control over the alcohol distribution and retailing portions of the industry, with many operating similar to U.S. “control states,” where the province fills the middle “tier” as the wholesaler/distributor of alcohol products. In response to the implementation of tariffs by the U.S., several Canadian provinces have acted against U.S.produced alcohol products.
On February 1, British Columbia (B.C.) Premier David Eby officially directed the B.C. Liquor Distribution Branch to immediately stop purchasing American liquor from “red states” and remove top-selling “red state” brands from their liquor stores.9 Almost immediately following this announcement, images began circulating on social media of prominent U.S.-produced brands
9 See Premier announces immediate response, vows to defend B.C. against Trump tariffs, available at https:// news.gov.bc.ca/releases/2025PREM0014-000077
being removed from shelves.10 In the following weeks, Premier Eby announced the full removal of U.S. products from BCLIQUOR Store, including all beer, wine, spirits, and refreshment beverages.11
Other provinces have moved forward with the removal of all U.S.-produced alcohol products as well. Nova Scotia Premier Tim Houston has directed the Nova Scotia Liquor Corporation to remove all U.S.-produced alcohol from their stores by February 4.12 Manitoba13 and Ontario have followed suit,
11 See Premier’s statement on removing all U.S. alcohol from BCLIQUOR stores, available at https://news. gov.bc.ca/releases/2025PREM0032-000187
12 See Statement on American Tariffs, available at https://news.novascotia.ca/en/2025/02/01/statement-american-tariffs
13 See Manitoba Government to Pull American Alcohol Products Off Shelves, available at https://news.gov. mb.ca/news/?archive=&item=67397
with Ontario Premier Doug Ford announcing in a statement on X that “[s]tarting Tuesday, we’re removing American products from LCBO shelves. As the only wholesaler of alcohol in the province, LCBO will also remove American products from its catalogue so other Ontario-based restaurants and retailers can’t order or restock U.S. products.”14 Premier Ford highlighted in his announcement that over $1 billion of U.S.-produced products are sold in Ontario each year. Starting on March 5, Quebec also pulled all U.S. alcohol products from the Société des alcools du Québec shelves.
The overall impact of the U.S.’ tariffs and the Canadian retaliatory tariffs remains fluid. It is unclear how long the U.S. will maintain its tariff position and how long the Canadian government will maintain the retaliatory action. Canadian provinces have indicated that they will continue their ban on U.S. alcohol
14 Doug Ford (@fordnation), X (formerly Twitter) (Feb. 2, 2025, 8:30 AM), https://x.com/fordnation/ status/1886044429212926331
purchases as long as the U.S. tariffs remain in place, and they’ve shown no sign of reversing course at this time. Additional Canadian provinces may also begin to limit the procurement and sales of U.S.-produced alcohol products as the situation escalates. Please contact the GrayRobinson national Alcohol Law Team if you have questions or concerns about these developments and their impacts.
John P. Thomas, II is an attorney in GrayRobinson’s Tampa office and a member of the firm’s national Alcohol Law Team. John works with all three tiers and segments of the alcohol industry, including substantial work experience with distillers. Prior to joining GrayRobinson and while in law school, John served as a senior judicial intern at the U.S. District Court for the Middle District of Florida for the Honorable Amanda Arnold Sansome. Subsequently, he became a gubernatorial fellow for the Florida Gubernatorial Fellows Program, where he served in the Florida Department of Management Services. For more information, call (813) 273-5046 or email john.thomas@gray-robinson.com.
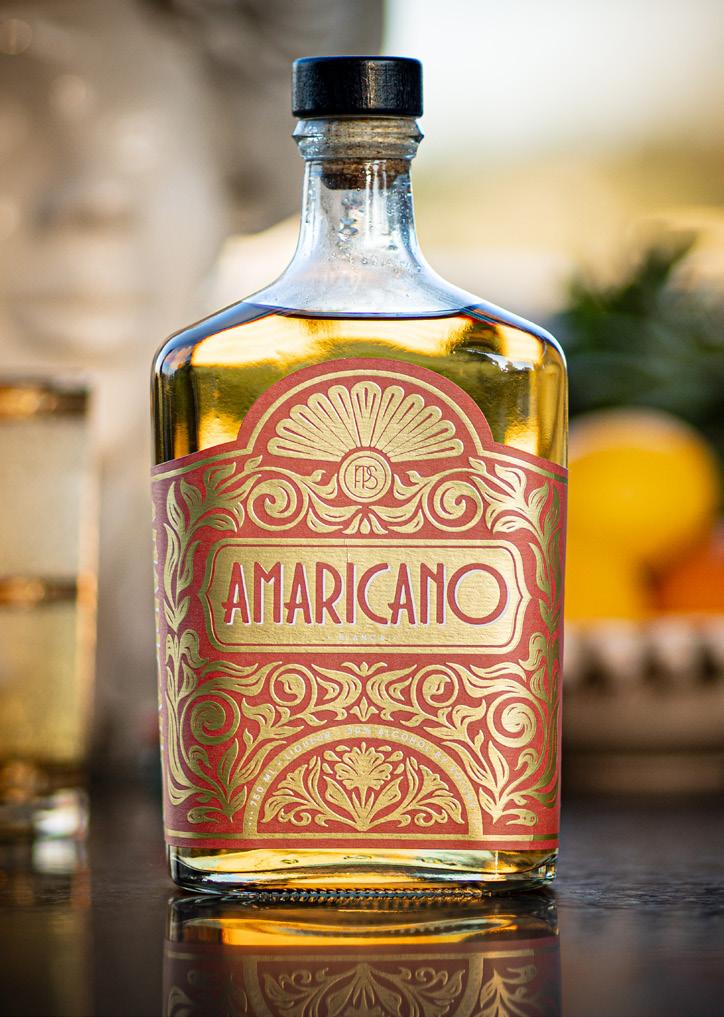
BEYOND the BOTTOM LINE
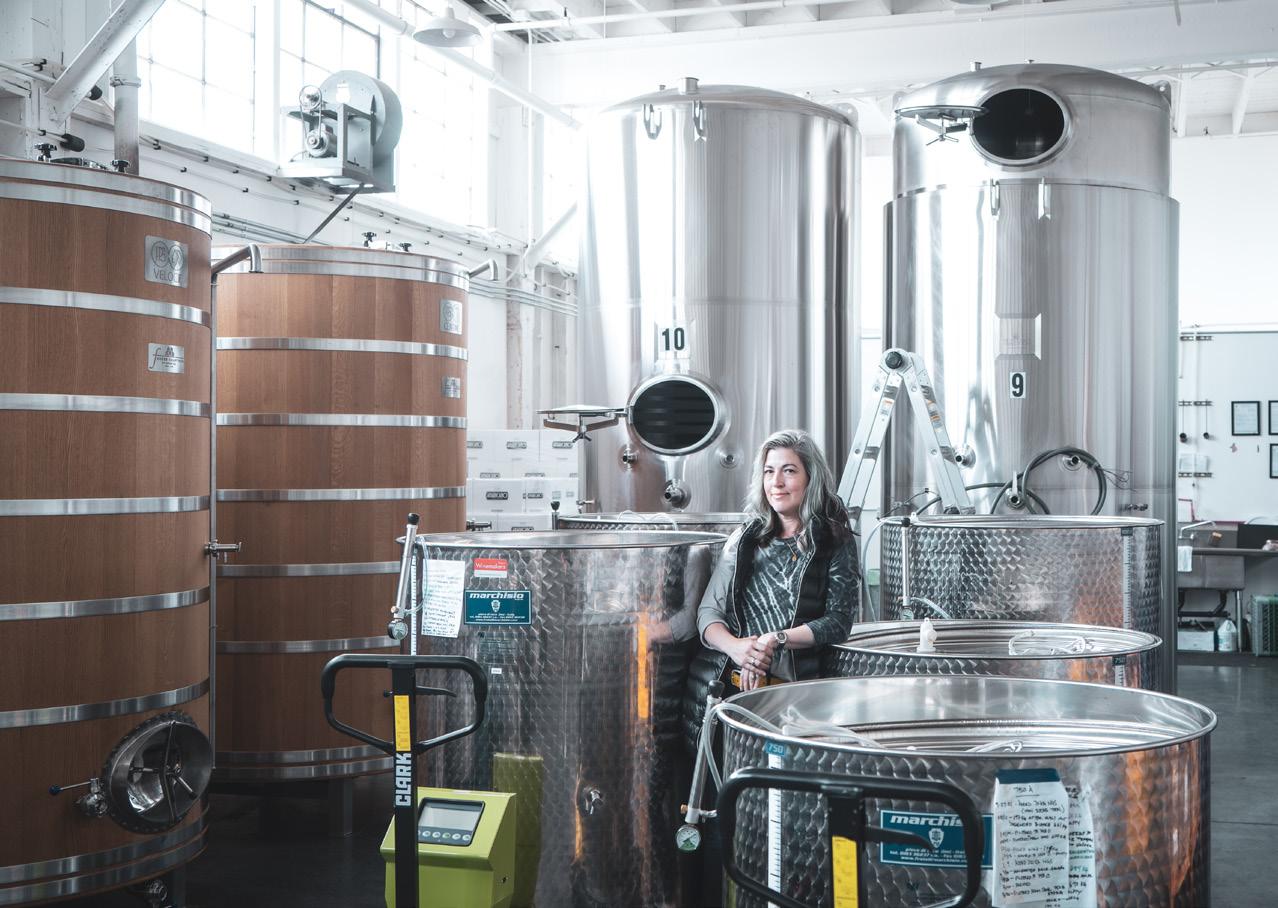
FAST PENNY
Relies on organic, fair trade, and foraged ingredients to make amari that shines
Written by Gabe Toth
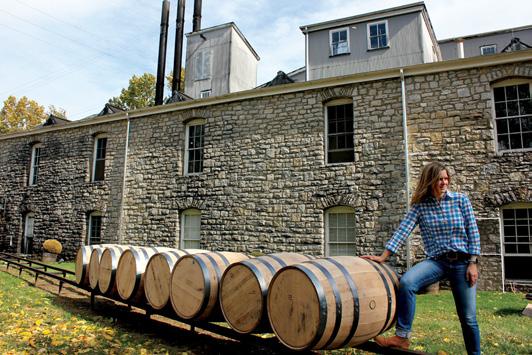
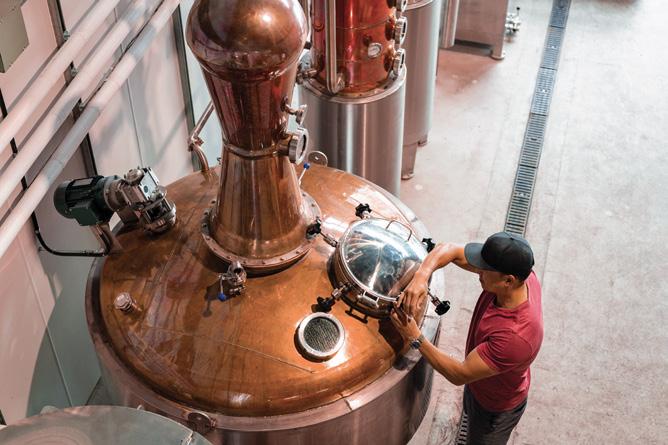
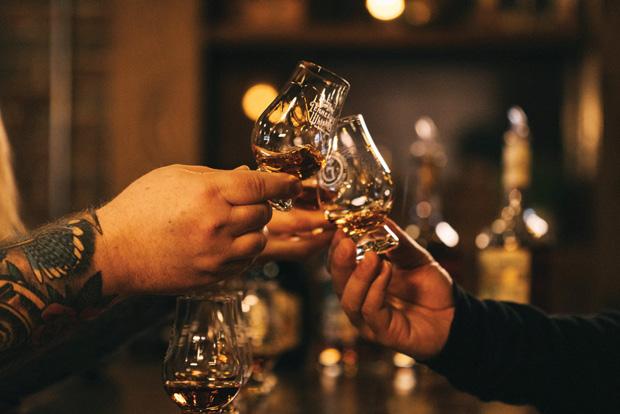
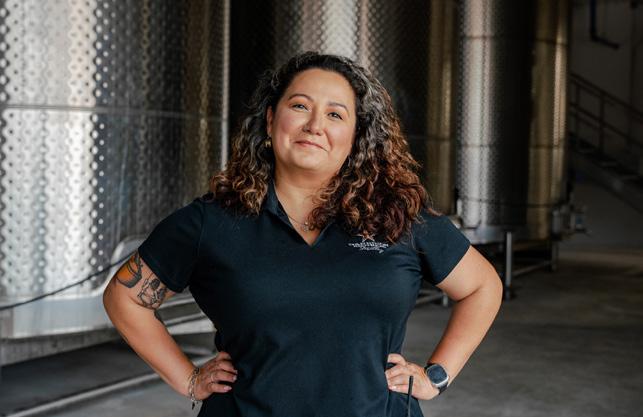
PHOTO BY JASON B. HUNT
When Jamie Hunt found herself sitting at a bar in Seattle having some after-dinner amaro, she wondered if there were any domestic versions. She had decided to strike out from her career in the digital tech sector and start her own business, knowing she wanted to make a physical, tangible product and to find a way to give back to the community.
WHERE IT BEGAN
“Those were the things swirling in my head as I was drinking this amaro. And it just came to me. I've loved amaro for a very long time, since my 20s when I traveled to Italy,” she said.
She started researching and experimenting with making amaro, and six months later she decided this was the direction to go. In August 2017, the seeds of Fast Penny Spirits had been sown.
Hunt spent the next three years tincturing individual botanicals and putting together lots of small trials, going to a Culinary Institute of America boot camp in Napa (which had been scheduled prior to deciding she would start an amaro company) and earning her introductory-level sommelier.
“I started off probably with 50 to 75 [botanicals], and then by the time I was done I probably had about 200, roughly, that I had tested out to see if it would work in the recipe, on evenings and weekends while I was working full time,” she said. “Eventually I got to about 46 ingredients and said this is what we want. This is the flavor.”
She stopped testing and started producing, transitioning from her job to a full-time focus on Fast Penny in March 2020 “when all hell broke loose,” she said. “I wasn't planning on leaving that early, but I decided to leave my position and just really focus on the business and re-strategize our launch.”
BUILDING A FOUNDATION
Fast Penny launched in July 2020 with two core products: Amaricano Rossa and Amaricano Bianca, or red and white. The red was an intentional product, she said, but she stumbled on the white while doing trials with different types of sugar, blends of sugars,
“Eventually I got to about 46 ingredients and said this is what we want. This is the flavor.”
levels of caramelization, and levels of sugar and ABV. She put the botanicals together and added just the caramelized sugar and was pleasantly surprised, so it went into the tasting trials she ran with industry professionals.
“Everyone chose the Bianca in addition to the Rossa. It was pretty definitive on which products I should launch with,” Hunt said.
Since then, she’s added limited-release products such as unique formulations, cask-aging projects, and collaborations with
— Jamie Hunt
wineries and distilleries. They’ve done special releases with DeLille Cellars and Westland Whiskey, including amaro aged in a single malt barrel and two peated whiskey barrels. She also has a Maker’s Mark and a gin barrel filled with amaro at the moment. “I’ll do that for fun and creativity and just to engage with others in the alcohol world,” she said.
She’s played around with making a Rosato in limited quantities, which went well, as well as a Viola colored with butterfly pea flower.
“That went so well that actually it's becoming my third in my lineup of permanent amari that we’re releasing,” Hunt said.
Fundamentally, she said, all of the products have a similar foundation, based on variations in the 46 botanicals she uses. “When you get [to] that number of botanicals, just making a few tweaks here and there can give you a whole new product,” she said. “It’s funny, last year I went to Chartreuse and did a tour there, and learned the different versions are just variations on the base.”
They’ve released a canned cocktail, the Shakerato, composed of amaro, coffee, chocolate, and orange bitters, available in regular and decaf. Hunt has also been working on a nonalcoholic amaro for the last year and a half and is getting close to releasing that.
With all of the ingredients that she includes, there are a few that make the headlines. She advertises that there are nuts because of the allergy issues and sources hops as a cool local ingredient that Washington State is a major exporter of. She had originally worked with
Middle Eastern saffron until she found an instate supplier at a farmer’s market.
“We flavor-matched the saffron. They had a few different varieties,” she said. “And now I use all Washington saffron.” They also use cascara, which is the fruit of the coffee bean.
“Not only do we like the flavor, but we love that we're putting more money in a coffee farmer's pockets because usually that's a waste product that they have to deal with, and now we're able to pay them for it instead of them having to worry about where it goes,” Hunt said.
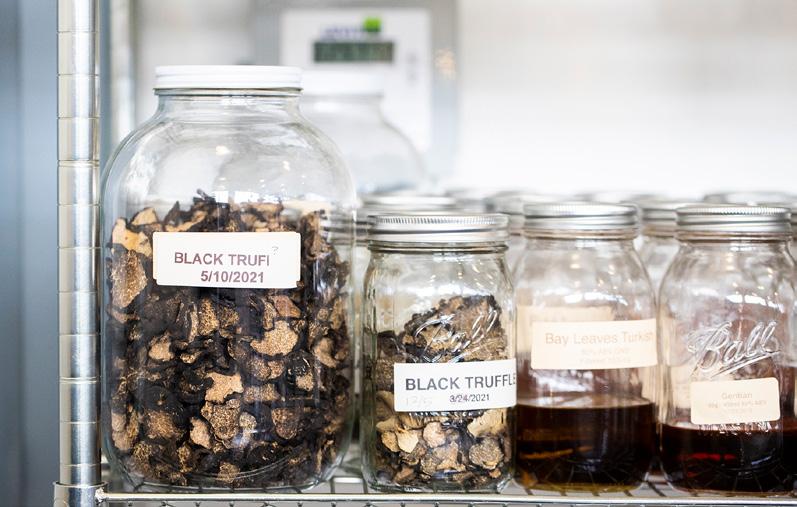
Local black truffles are another banner addition. They’re foraged locally and used in dried form. She said there are other truffled amari out there, but they’re very few and her truffles come from in-state. “They are hunted by dogs, and we process them that day or the next day,” she said, adding that she initially used them fresh, until she noticed that the flavor shifted over time.
“With the fresh [truffles], I found that it was really flavorful and delicious for about six months. And then it started turning, and I didn't like the flavor after six months,” she said. “And once I dried it, I got more of a cocoa fruity flavor that I thought went better with the other botanicals in the amaro.“
Consistency is also a factor when using dried versus fresh. Different water content from one batch to the next can result in flavor changes from one batch to another. She looked at making Amaricano without the truffles, but it wasn’t the same. “The truffle also just lends a certain body to the brew, which I really love,” Hunt said.
Sourcing a dried form of some local ingredients she likes can be challenging or impossible. Different ingredients require different drying regimens, and there isn’t the infrastructure in Washington State to provide that service for everything.
“A lot of things that I would want to add, it's
“The truffle also just lends a certain body to the brew, which I really
love.”
— Jamie Hunt
either we don't grow it in Washington State or I can't get it dried, cleaned, and processed,” she said. “So wherever I could use local stuff — like we have hazelnuts from Oregon in there — I did, and where I couldn't, I sourced organically and sustainably.”
For all of their ingredients, she makes sure that they’re using sound and equitable supply chains. The cascara, for example, was grown using organic practices and purchased through a fair trade arrangement.
“It was important to me to create a clean label, and we're really careful,” she said. “We spend more on all of our botanicals because of that. And we actually have — it was not intentional, it's purely palate — but we have the top four most expensive ingredients in the world in our green cardamom, we have saffron, we have black truffle, and we have vanilla bean. Our product is super premium because of all of those amazing ingredients. And again, I'm getting all of that either wild foraged or organic. The cost on those is a lot higher.”
Hunt runs her products through a very fine filter, using even more ingredients to account for what is stripped out during filtration and ensure that she still gets the flavor and body she’s looking for in the bottle. Aiming for a luxury product, she felt it needed to be clean on the palate and as clear as possible in the bottle.
“I worked on the branding as I was working on the product, and I had a vision from the very start. Obviously things changed along the way, but the vision of this luxury premium product was always there, so I had to make sure that everything I was doing worked with that,” Hunt said. “I actually worked with a food scientist to figure out how, at the very end of my recipe development, to get the product clear versus cloudy. It was just changing a couple of steps in my process; it's allowing the sugars to blend for a certain amount of time before I filter.”
The grape neutral spirit she sources for her base comes from a wine correction facility, which allows them to use what might otherwise be a waste product.
“If a wine is too high in alcohol content, the winemaker can send a portion of that vintage to this place, and they will reduce down the alcohol and send it back for them to integrate
into the rest of the wine,” Hunt said. “That alcohol that they pull off gets double-distilled and becomes our base liquid. And then if there's smoke tainted wine, which there's a lot of that, instead of throwing away the whole batch, just dumping all of it, they're able to pull off the alcohol.
B-CORP AND A PATH TO GIVING BACK
Hunt always had a goal of becoming a B Corp company, but it took a couple years of operations to reach that goal, getting certified in February 2022 and recertifying in early 2025. She had to be up and running to gather the metrics that B Corp requires around social, environmental, and employee sustainability.
B Corp looks at a number of variables to determine certification. One factor is employee care and compensation — healthcare where appropriate, as well as time off and compensation. “The gap between the highest-paid employee and the lowest-paid employee is pretty minimal,” Hunt said.
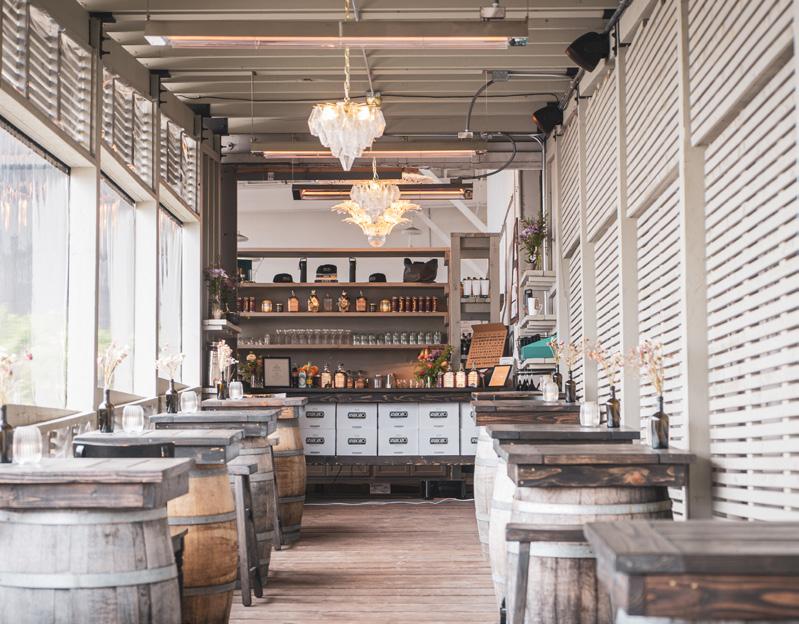
Their flagship charitable program is called Pretty Penny. The company gives 3 percent of bottle and can sales to nonprofits that empower women, help the hospitality industry, and support the community. They also offer in-kind donations, including product for
events, distillery tours, and event space.
“We have a higher give-back program than what's required because that was one of the inspirations for me to have my own business, that I could give back more if I did that than I was doing personally,” she said. “We’ll allow nonprofits to come meet if they want a cool location, and maybe the nonprofit board wants to come meet at Fast Penny. We don't charge them for that; we just let them come in and we serve them.”
This year, they changed the program to include two local and two national nonprofits, since they’re distributed outside of Washington State. She said they decided to respond to the federal anti-DEI push by supporting a Black-owned cause in the first quarter, selecting Soul of Seattle, which is connected to Northwest Harvest. In Q2, they’re supporting a local female football team, as well as Seattle Pride.
“Last year we did the official Pride cocktails, along with another alcohol brand, for Pride in the Park,” Hunt said. “We did all the R&D, we did all the batching, we donated all the product, and we're doing that again this year.”
She’s also continuing to monitor where funding may be getting pulled or groups may be constrained from helping as a result of changes in federal policies. “That's something certainly that we're keeping aware of, and
PHOTO BY JASON B. HUNT
we're supporting different causes that hopefully help folks even in a small way,” she said.
On the environmental side, she said they’ve made a lot of decisions to minimize waste and emissions. They paid more for electric forklifts and an electric walkie-stacker to eliminate the usage of fossil fuels.
“We use as little water as possible. We use as little fossil fuels as possible. We support sustainable wild foraging. We support the organic side. So just really thinking about the earth and choices that we have,” Hunt said. “We use cleaners that can sanitize but don't harm the environment. We're in Seattle, we're in a shipyard. There's fish around. You want to make sure that you're not doing harm to the environment. So we try to be as sustainable and conscientious of that as possible.”
WHAT COMES NEXT
There aren’t opportunities for every area she’d like to improve, she said. She’d like to be able to take her bottles back, clean them,
and reuse them, but there isn’t a system in place for that. “Sometimes you have to just be like, okay, I'm doing the best I can, and when something new and sustainable comes up, you can switch over to it,” she said
There have been items that went from wishlist to commercially available solutions. Fast Penny embraced vegware and the rise of better compostables for events or materials in the tasting room and then saw those gain a wider foothold.
“We used to have tasting cups that were only recyclable; we've found some that are compostable,” Hunt said. “All our caterers have to use compostable stuff if they're coming to cater at our venue. We've changed a lot of how that works, and now Washington State's requiring it. Little things like that I think can make a big impact over time.”
She said working with B Corp, where the expectations are higher with every recertification, helps spur her to keep looking for ways to improve and not get complacent.
“Sometimes you have to just be like, okay, I'm doing the best I can, and when something new and sustainable comes up, you can switch over to it.”
— Jamie Hunt
Sustainability is an ongoing journey, and the work is never done.
“It does make you think about different things,” she said. “Some products that we sell, can we source them more locally? Are there some things that we can change and support our local economy?”
Fast Penny Spirits is located in Seattle, Washington. For more info visit www.fastpennyspirits.com or call (206) 627-0272.
Written by HEATHER STORGAARD and ANDREA FUJARCZUK
Goodbye, Old-World Rye?
In 2003, the European Union and Canada signed the “Agreement on trade in wine and spirit drinks,” pledging to uphold one another’s naming standards, definitions, and geographical indicators in the drinks trade. For the EU, this included key exports such as Champagne, while Canada naturally protected their whisky. Domestically, identical requirements are given for Canadian Whisky, Canadian Rye, and Rye Whisky, which were then brought into the EU to align both markets. Essentially, this resulted in the EU agreeing that all “rye whisky” came from Canada, with an exemption for U.S. producers. Simple, right? Not really.
Back in Europe in 2003, a small distillery in Austria was producing rye whisky, but the category had little in the way of a foothold in Europe. So, for the last 20 years this agreement pretty much flew under the radar. However, in that time, passionate whisky makers in rye-loving northern Europe set about using the grain to make award-winning and highly rated products. Some of them, such as Danish Stauning, even exported to Canada. In today’s spirits world of post-COVID market fluctuations and tariffs, they are now being forced to remove reference to the very grain that makes their whisky.
Canada & Rye
Backing up a bit, it is important to think about the origins of rye whisky. It was historically made in Pennsylvania and Maryland by early European immigrants. Then, as Dutch, German, and English immigrants made their way to Canada in the 1800s, distilleries emerged there. They produced whisky from corn, wheat, and barley, but they had a problem — some people considered their spirits bland. A solution was found by Germans, who were familiar with growing rye and making spirits from it in their homeland. They developed the practice of using milled rye as a “flavoring agent,” adding 5 to 10 percent of the grain to a base to produce a flavorful spirit.
Eventually, this became known as “rye whisky” or “rye,” which differentiated itself from the “common whisky.” Considered a more premium product, the Canadians have kept the tradition of rye whisky alive ever since. This link between rye whisky and Canadian whisky has been so strong that at times the terms have been used synonymously. These deep-rooted Canadian standards of identity for making rye whisky have remained largely unchanged — until now.
Standards
As of 2024, the Canadian government defines “Canadian rye whisky,” “rye whisky,” and “Canadian whisky” as synonymous terms, and they are required to “possess the aroma, taste and character generally attributed to Canadian whisky.” This means that if you pick up a bottle of Canadian rye whisky, it should smell and taste like a Canadian rye whisky. Therefore, to Canadians the term “rye” is indicative of flavor rather than the percentage of grain used. This avoids confusion in cases where whisky made of mostly corn or wheat still tastes like rye. After all, grain percentage is not necessarily an indication of quality.
Thy Whisky
While Canadian rye evolved based on a flavor profile, the Americans’ TTB standards modelled their grain spirits based on percentage of grain. So, to call a U.S.-made spirit a rye whisky, it must contain 51 percent rye.
But what about in Europe? The EUCanadian agreement was never enforced by EU states as required. This has resulted in many distilleries across the EU producing and developing their own style of rye whisky, drawing on their heritage with rye as a grain. Instead of adhering to the Canadian preference of indicating flavor, it leans towards the American style of indicating grain percentage.
Some have questioned why Canadians don’t impose a minimum requirement like in the U.S., but “Canadian Rye Whisky” and “Canadian Whisky” have an established geographic indicator, with the intention of preserving Canadian whisky heritage. If this is how Canadian rye whisky has always been made, why should Canadians change their regulations? Prosecco doesn’t change their way of producing sparkling wine because Champagne exists.
Although it’s easy to say that Europeans dropped the ball in terms of protecting the term “rye whisky” for Canadians, equally this could have been something for Canadians to embrace and enforce more actively. Canadian distillers have a somewhat fractured system of national trade organization encompassing both large and small distilleries. This has potentially led to missed opportunities, including reevaluating and redefining Canadian rye whisky.
According to the 2003 agreement, Canadians still own the term “rye whisky” within the EU, but what made sense 22 years ago may no longer hold true. If the rules had been enforced from the very beginning, Canadian distillers could have taken the opportunity to redefine a spirit that could call Canada its homeland.
Kyrö Distillery Company
Where Do We Go Now?
Some of the largest rye producers in Europe have expressed a great sense of unease. Obvious concerns regarding a lack of transparency, fair play, and reduced competition were voiced, but an overarching sense of confusion prevailed too. The EU-Canadian agreement is administered by each EU state, meaning that rules in member states now differ as each country interprets the wording a bit differently.
Currently, many distilleries are working hard to re-label their bottles and pivot their branding. “We’re changing our main communication to be centered on ‘whisky born in the sauna,’ talking about our origin story,” Mikko Koskinen, co-founder of Kyrö from Finland, explained. Rye is a key part of local identity in Finland, where rye bread was voted as the national dish by the people, so it was a natural choice for Koskinen and his friends when they launched their distillery. Today, they have 1.5 million liters of rye spirit aging in their warehouses. Somehow, the distillery now needs to tell their origin story without the very grain that lies at the heart of their business.
For European rye producers large enough to export to the U.S., the situation is even more perplexing. Stauning, which recently won “World’s Best Single Cask Single Rye” at the World Whiskies Awards, is among the most affected. The distillery now stands in the difficult situation of redesigning its EU labels to avoid “rye whisky” while being legally required to make that category clear on bottles exported to the U.S. To top it off, they recently had their funding pulled by Distill Ventures, the whisky investment vehicle previously supported by Diageo. This has caused layoffs, particularly affecting American members of the team.
There are a lot of unanswered questions here that are far bigger than individual distilleries. Has Canada lost their close relationship with rye, after so many
Stauning Whisky
years of growth in Nordic rye? Should a grain ever be allowed to be “owned” or “claimed” by a single country? The transpar ency issues are clear to see, but whisky is a category built on heritage, which needs to be balanced too.
Amongst the legalese and obscure terms, it is also import ant not to lose sight of the people and communities who make this whisky. “They’re playing with people’s lives,” Koskinen told us. The agreement between Canada and the EU describes a possible solution to the issue, involving a joint committee that will meet to negotiate changes or permissions. European rye producers are determined to fight for their whisky. Now, they need the EU to work with them to find a way forward that makes sense for rye lovers in Europe, Canada, and globally.
Heather Storgaard is a Danish-Scottish writer specializing in whiskey. When not on the road chasing whiskey stories, she lives in an old distillery near Edinburgh. Previously focused on whiskey history and the secondary market for Whisky Auctioneer, Heather now writes freelance for a number of publications in the U.S., Germany, Denmark, Switzerland and the UK. She was named one of Harper’s Wine & Spirits 30 under 30 this year and is a 2025 Bourbon Women SIP Scholar.
Stork Club Whiskey
Pungent
From Dissent to Discussion
The Future of American Single Malt Whiskey
Written by SAILOR GUEVARA
In December 2024, the TTB unveiled a new standard of identity, American Single Malt Whiskey, and the Spring 2025 issue of Artisan Spirit featured the article “A Difference of Opinion, Opposition to the New Standard of Identity for American Single Malt Whiskey.” In that piece, Phil Steger, founder and CEO of Brother Justus Whiskey Company in Minneapolis, Minnesota, shared his disagreement with the rules, specifically the 160 proof cap. Steger took issue with the TTB’s failure to engage with formal comments, which he
“Some things are fundamental to the global understanding of single malt and how our government qualifies whiskey in this country. Distillation proof is one of those core tenets.”
— STEVE HAWLEY President, American Single Malt Whiskey Commission
believed was a breach of legal obligation. Since the article was published, Steve Hawley, President of the American Single Malt Whiskey Commission (ASMWC), offered a response. As the body championing the ASMW standard, the commission’s stance on Steger’s dissent is notable, and he discussed how they decided on 160 as the proof cap.
“We less so ‘made’ a rule than simply followed one already in place. We were aligned from the start with all the other major types of whiskey in the U.S. federal regulations, none of which are permitted to exceed the 160 proof limit of the class itself. This precedent has been set to ensure that a semblance of grain flavor remains in the final products, which is also important for the American single malt category. We didn’t believe single malt in America should be an exception, nor did we see a need to ask TTB to reconsider this standard requirement as part of our petition.”
He went on to state, “Brother Justus first reached out to us after our petition was submitted and a rule proposed by TTB. We’ve heard their position that the limit should be raised and that American single malt should be treated differently on this topic, but we have respectively disagreed. They point to Scottish whisky’s broader
limit of 94.8 percent ABV (which would equate to 189.6 proof) but don’t acknowledge in their argument that ‘single malt’ scotch whisky requires the use of a pot still. The pot still provision is Scotland’s way of achieving the same end, to effectively limit final distillation proof. I don’t believe I’ve heard Brother Justus propose a similar pot still requirement as part of their dissent.”
Hawley continued, “We were very conscious to draft and propose a Standard of Identity for American Single Malt that left room for flexibility and creativity in production — a hallmark of the category and what we have to bring to the global conversation in single malt — while still maintaining the integrity of a definition for a single malt that is accepted and embraced by consumers across the world. However, some things are fundamental to the global understanding of single malt and how our government qualifies whiskey in this country. Distillation proof is one of those core tenets. When the commission formed and originally drafted a proposed Standard of Identity, we didn’t think it was reasonable to ask TTB to break the rules in place for the class of whisky as a whole and install a new distillation proof limit (that none of us agreed with in the first place) for American single malt. Within the first year of operating, we had over 200 member producers of the commission, none of which raised this subject or concern.”
“I’d certainly disagree with the notion TTB’s ruling was premature. Quite the opposite.”
— STEVE HAWLEY President, American Single Malt Whiskey Commission
The majority seem in favor of the current rule, but several other American single malt whiskey producers have shared their agreement off record that pushing for a TTB ruling was premature. Hawley responded, “I’d certainly disagree with the notion TTB’s ruling was premature. Quite the opposite. Not only has ASMW been made in this country for over 30 years, but the length and comprehensiveness of TTB’s review, proposal, and ratification were more than thorough. Like other categories of whiskey that enjoy the protections of clear regulations, it is critical to the fortunes of ASMW producers and was frankly long overdue.”
When asked how the commission feels about the lack of responses by the TTB to Steger’s formal dissenting comment; Hawley said, “We recognize that the new definition will require Brother Justus to change their production methods in order to continue using ‘American Single Malt Whiskey’ on their labels if they don’t choose to change their classification type which is an option for them to choose. While they are the only distillery we’ve heard from that advocates for the higher proof limit and would be affected by the ruling, we certainly empathize with the implications of what that means for a business that has chosen a path for production that doesn’t meet the requirements. It’s one reason we were very supportive of the lengthy grace period proposed by TTB in its ruling.”
I spoke to several of those ASMW producers who shared a concern that the ruling was premature. They were sympathetic to Steger’s claim of a delayed TTB response to his formal comment. All the producers felt that whether they agreed, the TTB must consider all formal comments from producers equally. When I asked the producers why they wished to remain off the record, the consensus was they that did not want to seem in opposition to their friends and colleagues and were concerned that, although their issues are with the TTB, they might seem unsupportive of the commission’s long and hard efforts, which is not the case.
Producers said the category benefitted them most through consumer education. They believed consumers might see more legitimacy in ASMW now that there is an official designation and might take the dive into the category because retailers may take the promotion of the category more seriously, for instance by labeling a section of the shelves properly or including it in their consumer education.
“Do I think the Standard of Identity will encourage consumers to purchase ASMW? I do, but not directly,” Hawley said. “I don’t believe that consumers are all that tuned in to the mechanizations of government regulations around whiskey. The impacts of the ruling, however, will make a big difference. There have been periods of strong media coverage over the past nine years as the process has unfolded. The press surrounding the final ratification was welcomed, but we wouldn’t expect it to continue at that volume indefinitely. It is on us as a category to continue telling the story. With a formal definition now in place, it allows individual producers and the commission to leverage tactics that will keep the spotlight on the category, with consumers, but equally important with the trade. No doubt it’s tough times right now, regardless of the category you’re trading in, but we’re playing the long game here, and AMSW will continue to gain in awareness, reputation, reach, and, ultimately, sales. The TTB’s ruling is one component of that. But with it, we can be assured that the category is here to stay, and ‘American whiskey’ now represents something much more than it once did.”
For Steger, his mission to change minds continues on. At the recent American Craft Spirits Association Convention in Phoenix, Arizona, Steger’s address regarding the
ASMW designation’s proof level garnered general approval. “New distillers I hadn’t talked to before approached me afterward to tell me they agreed with our position,” Steger said, “and were surprised it hadn’t really been widely discussed or discussed at depth before seeking a federal regulation defining the American Single Malt standard of identity. It also confirmed for me that 100 percent malted barley mashes really are a new thing for most American distillers and that there’s some retraining of ‘bourbon brain’ that needs to be done for American distillers to really understand the disruptive potential of American single malt. I think distillers, experts, and opinion leaders in the field are seeing how the distillation proof limit in the rule gets in the way of that.”
Steger said more distillers than he expected agreed with his position.“I haven’t kept specific track, but everyone I’ve talked to so far has walked away agreeing with our position, or at least open to further discussion about it. It’s not a hard sell because it’s just common sense. More freedom for distillers already caged in by regulations on all sides is generally better as a starting point. Lifting the cap wouldn’t devalue or degrade the meaning of ‘single malt’ because no other country has a distilling proof cap on single malt, and plenty of distillers from Scotland, Japan, Ireland, and elsewhere distill above 160 to get the precise flavors they want. And there’s no hardship to distillers who want to distill below 160 because that would obviously be allowed if the U.S. cap were lifted.”
Hawley was not present for Steger’s talk at the ASCA Convention, “I was not at the presentation Phil Steger hosted at the ASCA convention, and he hasn’t reached out to me or our board in several years, so I can’t speak
“More freedom for distillers already caged in by regulations on all sides is generally better as a starting point.”
— PHIL STEGER Founder and CEO, Brother Justus Whiskey Company
to what was discussed there or the feedback he received. I also can’t speak to his interactions with TTB; I can only speak on my own. We had been petitioning for a formal definition for nearly nine years, and I found the TTB to be both responsive and collaborative to the extent that their charter allows them to be. I know that Brother Justus submitted a formal comment during the comment period following TTB’s NPRM (notice of proposed rule-making). Evidence that TTB heard and considered that comment is found in their final ruling, which references the comment and Brother Justus specifically. There, they provide a comprehensive rationale for why they did not allow for a higher distillation proof in the Standard of Identity. As I mentioned, he contacted me years ago, and we discussed his position. I offered him the opportunity to discuss it further with our board but he never took me up on that. This was well before TTB’s NPRM.”
The founding members of the ASMWC were all craft distilleries or emerging brands at the time of the formation, and most fell into the category of a craft distillery. It’s a small world where producers are collaborative, friendly, and, more often than not, unite for causes that affect the industry, so the concern that such topics could fracture the community or strain relationships is real.
When asked if he had received any negative feedback, particularly from long-time supporters of this standard’s official adoption, Steger responded, “I have encountered no anger or criticism from any ASMWC members,
nor have I been informed of any. I haven’t formally reached out to anyone official there because I believe we distillers all need a moment to celebrate even imperfect wins when we can get them. And I don’t want to step on that for them, and I understand the hard work they put in and generally support having an American single malt standard of identity.”
However, he continued, “I just don’t think we should have a rule that gives American distillers less freedom than all other single malt distillers worldwide. In fact, in some other ways, I think the new standard is too loose and too far from what I think makes single malt a truly special and distinctive expression of a single distillery’s skill, terroir, and taste. But I listened to fellow craft distillers who had other points of view and didn’t oppose them. I’m not sure why the same openness wasn’t afforded to my point of view on distillation proof, especially when that point of view matches single malt definitions in Scotland and everywhere else. But I’m hopeful there will be an opportunity to have those conversations and work constructively on improving the rule in the future.”
Several producers feel that how the TBB notifies DSPs could be modernized and improved, leading to more substantive discussion between producers. “I don’t always open every communication from entities like the American Craft Spirits Association
or DISCUS, and receiving information that legal rulings are taking place is not a perfect system. A lot could be improved for busy distillers that are overwhelmed already.” said one producer. The producers who attended Steger’s talk at the ACSA convention agreed that the discussion was positive, productive, and eye-opening for many.
When asked what his next steps regarding the TTB were, Steger said, “Right now, we are waiting for some clarifications from them on a few issues. Our next steps will partly depend on what they say about them.”
Producers who discussed the ruling, and the ASMWC, were eager to ensure that they remained supportive of their colleagues and community. Each discussion showed careful handling; supporters of Steger’s position ensured their agreement did not eclipse their support of the ASMWC. Craft producers’ awareness that their power lies within their community, supporting each other, was evident.
Sailor Guevara is a veteran of the spirits and hospitality industry, the 2020 winner of the World of Whiskey Icon award, and an author and contributor to several spirits publications. As an acclaimed podcast host and published mixologist, Sailor enjoys sharing her passion for spirits and music with the world.
Todd Leopold expands three-chamber operations well beyond just rye whiskey
Three -Chamber Everything
What started as an experiment in historical rye whiskey production has spread across the Leopold Bros. product line like a viscous, delicious virus. Corn, malt, various fruits — it seems like the only thing not in production is a three-chamber vodka.
After commissioning the first new three-chamber still since Prohibition and beginning rye production with it in late 2014 or 2015, Todd Leopold decided five or six years ago to put up a few barrels of malt whiskey — calling it “kind of dumb to have a floor-malting operation and not put any barrels of malt whiskey down.” It’s not necessarily a big part of his planning, since the American market still hasn’t quite caught up with malt whiskey, but he can sit on it in the warehouse and worry about it later or use it as a blending component.
“We knew going into it, tasting the distillate, this whiskey isn’t going to be anywhere where we want it to be for eight, ten years. The flavors are just so big, everything is amplified,” he said. He’s also put up some Irish-style whiskey, using a blend of malted and unmalted barley.
The Old Becomes New
Later, Leopold learned that the still had also been used for bourbon, opening another conceptual door. He cited a pre-Prohibition newspaper article from Louisville, Kentucky, that described the six kinds of whiskey being made in the state.
“They said, by far and away, the most common way to make bourbon was in a three-chamber still,” Leopold said. “It turns out the original Old Fitzgerald, the original Old Judge, the whiskies that made Pappy van Winkle famous before he opened Stitzel & Weller in 1935, that was three-chamber bourbon.”
He’s continued to pair the three-chamber still with his ability to malt grain onsite,
using malted corn for his three-chamber bourbon. Corn contains a great deal of oil, and the three-chamber is designed to pull oils out.
The heavy oil presence softens the whiskey considerably, and a single-infusion mash is enough to convert the corn after it’s malted.
“You find in all sorts of recipes, including the original Dickel whiskey, was malted corn, malted barley, and in some cases malted rye,” he said. “It softens your perception of ethanol, gives it more palate fullness. The white dog is much more like cornbread and less like that agricultural, raw corn flavor. The whiskey that is not four years yet, I’m very happy with. From where I sit, [it’s] more remarkable than the rye.”
He’s been applying the same approach to corn as he would for making Munich or Vienna malt, incorporating a stewing process in the kiln — closing up the system and recirculating hot, moist air that creates sugars and high level of Maillard reactions before opening the kiln to blow off the moisture and drying the malted corn.
“When we open it up, it smells like a mixture of Cinnamon Toast Crunch and peanut shells and hazelnuts,” he said. “From a lab perspective, I’m trying to understand why, after going through this process, that cinnamic acid is much higher.”
Leopold tried running unmalted corn as well but simply didn’t like it as much.
“It wasn’t bad, [but] I can tell you this: Because you pull so much of the raw corn flavor out, that’s an eight- to 15-year-old whiskey. That flavor that makes bourbon taste young, it is amplified, so it will take a lot longer for the wood sugars to catch up,” he said. It reminded him of the first time he ran rye on the three-chamber still. He told his brother Scott, “There is absolutely zero chance that this will be palatable after two years. I told him that the
very first day. The flavors are too big. It tastes like a lavender cordial. It takes time for the esters to come up, it takes time for the wood sugars and the vanilla and the balance to occur.”
The Engineering Behind the Flavor
The three-chamber still design allows it to pull so much oil and volatile flavor because the bottom chamber is a few PSI overpressure, and the mash that reaches the bottom chamber has already been distilled twice. The top chamber has a full charge of alcohol coming out of fermentation, while the middle chamber has had some of the ethanol stripped out in the first fermentation. By the time it gets to the bottom, the remaining heavy volatiles are effectively undergoing a high-pressure water distillation, but the ephemeral floral notes that might flash off once they reach the atmosphere are stabilized by alcohol as they continue passing through the system.
“It’s three different distillations being run to the condenser simultaneously, but what really makes it go is that bottom chamber. That’s what makes it different,” he said.
He runs his three-chamber flow through a thumper to distill on a single pass, but bafflingly to him, he said it was common in the heyday of the three-chamber still to use it as a stripping still, making no cuts and redistilling the oily low wines.
“The problem with distilling it a second time is you’re taking an inefficient way of distillation and adding another layer of inefficiency,” Leopold said. “When you redistill it, you’re leaving behind the things that make it three-chamber. You’re leaving behind those flavors, you’re leaving behind oils. The problem is, if you put in a three-chamber and it just tastes like every other whiskey, now you’re just pissing money away to no end. If it tastes like every other whiskey, who the hell cares?”
Even at four years, he found the rye to retain a lot of that grainy and floral character, and noted one taster who called it a “rye agricole,” playing off of the name and character of rhum agricole.
“He’s not wrong; that’s a really good description,” Leopold said. “At four years, that is entirely true. At eight years, I don’t think he would say that anymore. But I wanted people to taste that.”
For the bourbon, he matched what he believes to be the original Stitzel mashbill, consisting of corn, rye, and malt, and he observed that spirits historian, writer, and researcher Noah Rothbaum found the engineering drawings for Stitzel-Weller and saw no mention of wheat. Likewise, the Crampton-Tollman research papers he’s used as a valuable reference on historical whiskey don’t count a single bourbon that has wheat in the mashbill. Wheat seems to have been a later innovation in bourbon production.
“All that wheat means is that I want more barrel. I don’t want more corn, I don’t want more rye. The only thing you get from wheat is vanillin. You obviously already get that from the barrel,” Leopold said. “Where all the cool kids are right now, America likes barrel, barrel, and more barrel. Double barrel and triple barrel. So many people think if you can taste the rye and the corn it’s a flaw and the distiller is a hack.”
“
If it tastes like every
other whiskey, who the hell cares?”
— Todd Leopold
“The
Best Thing We’ve Ever Made”
When he first considered making brandy on the three-chamber, Leopold had to have a heart-toheart with his staff. He explained to them that if a valve jammed or a sliver of pit that had slipped past the destoner clogged the system, they would have to let the whole system cool for a week and then empty it by hand.
“My god, I didn’t design the still with the notion that we’d be putting peaches in. I never thought we’d do anything but grain,” he said. “This was over 10 years ago, and the thought of selling fruit brandy wasn’t exactly in my mind. I was more concerned with, ‘I hope we can sell this rye whiskey we’re making that doesn’t taste like anything anybody else is making.’”
The team signed on for any trouble that might arise, and the issue hasn’t come up in the three years they’ve been running fruit. The spirit that resulted from that gamble has been a high point of his distilling career. Last year, they ran 180,000 pounds of Palisade peaches, prized fruit from Colorado’s Western Slope, fermenting the peach mash in tall, skinny Christian Carl eau de vie fermenters with a one-meter-wide impeller that keeps the mixture homogenous.
“When you look at the spirit safe as it’s spilling over the hydrometer cup, it looks like glycerine,” he said. He cuts it to 50 percent ABV and uses new char four barrels, which have held up to the intense character he’s getting out of the three-chamber. “If I was making eau de vie on a Christian Carl [still], I would never put it in a new charred barrel. It would snuff out all the notes that you’re looking for,” he said. “Well, there’s no snuffing out. Boy am I glad I made that choice.”
The oldest of his peach three-chamber is two to three years old, and he pulled a sample for the company’s 25th anniversary last year. Leopold said he removed the bung and went for a thief. “I could smell the peaches from five feet away,” he said.
“You can’t tell it’s 50 percent. It has this candied peach flavor to it, and of course as the wood sugars are coming in, and the vanillin is coming up, it’s going to fill in the holes like you’re making a liqueur, where in your mind you’re able to taste the sweetness, you’re able to taste the candied nature of the brandy, as opposed to having it as an eau de vie or having it in French oak that isn’t going to contribute as much as a charred barrel is,” he added. “Unless somehow I fuck it up, which of course is always
“ I just feel like the luckiest guy in the world to get to run the thing.”
— Todd Leopold
possible, this will probably be the best thing we’ve ever made. It’s unbelievable, the aroma and flavor and the softness.”
He’s also put up pears and apples, sourcing pears from California and apples from Michigan, where he works with a massive co-op and is able to get large amounts of tiny apples.
“The skin ratio, where the aromas are sitting, is much higher. They sort for size, and from where they sit, they’re selling us the shitty apples,” he said. “The Granny Smith apples that we had, man, quite a few of them were golfball sized.”
It’s an approach that diverges from his Old World training, where fruit would be juiced and separated from skin and pulp for distillation and, to him, those spirits taste and smell like juice.
“In my opinion, making fruit brandies out of cider instead of with the skin, you’re basically throwing out all the aroma. To me, it’s very important to distill with the skins on,” Leopold said.
They also recycle tails through the system for the whole run of a given fruit, with about 60,000 pounds of fruit processed in a week. As a result, the richest, heaviest notes concentrate over time, and the distillate evolves from beginning to end.
“On day one, it tastes like apple skin or pear skin or peach skin. You get a mineral finish to it — it’s very agricultural, it tastes like skin not juice,” Leopold said. “By the time the tails accumulate and we get to the end of the week, now it’s no longer apple skin, it’s apple blossoms. Very floral. You’ve been concentrating these things, and of course it makes sense that the blossoms are in the apples, the chemical compounds. It makes sense that it shows up, but of course in just an apple, it’s not concentrated enough for you to pick it out. When we got to the end of it, the guys, of course, are looking at the old man with the beard, ‘Did you expect this was going to happen?’ Man, I wish I could lie and say yes. This is completely unexpected, a wonderful treat.”
On average, he said they’re packing about 25 pounds of fruit into each bottle, and all three fruits “scream at you. The chamber still is running 30 degrees warmer, and that just makes all the difference. It’s pulling out compounds that normally are gonna go out with the stillage, and those oils are where all those aromas are hiding. It just makes remarkable distillate.”
“Out of everything we’ve been making so far, the peaches are reacting the best, which is really fun because of [them coming from] Colorado,” he said. “But I’m thrilled with the apples; we’ve also put pears down into barrels, as well as resting it in glass the traditional way I was taught to do.”
This spring, he partnered with esteemed California vintner Steve Matthiasson to produce Leopold Bros. x Matthiasson Wemut. The two producers were both James Beard finalists — Leopold in 2019 and Matthiasson in 2020 — and connected through a shared marketing consultant.
The red vermouth that came out of the project featured Matthiasson’s wine, a high-quality Napa Valley cabernet sauvignon. Leopold noted
that the wine Matthiasson sent “wasn’t out of spec, this is the wine he bottles.” He wanted to match Matthiasson’s best with his own, using pear eau de vie — which Leopold felt was a natural fit given the pears’ California origin — as well as three-chamber peach eau de vie, white pepper, vanilla, green mandarins, rooibos tea, rose petal, chocolate, grand wormwood, ginger, and Belgian candi sugar.
The Still That Changed Everything
He said an ice cube in the vermouth releases the blend’s aromatics, highlighting the spirit right up front. “That’s the predominant note that you get on the nose, it’s the peach-pear, because of the way the three-chamber behaves,” Leopold said. It’s just another illustration of why the three-chamber has become his favorite still.
“It’s just so fun to run. You can feel the aromas, I don’t know how else to explain it, but you get the sensation of pulling the aromas out of the mash,” he said. “I just feel like the luckiest guy in the world to get to run the thing.”
Leopold Bros. is located in Denver, Colorado. Visit www.leopoldbros.com for more information.
An Obscure Pioneer
Koenig Distillery was producing craft spirits before the craft spirits boom.
Written by RICH MANNING Photography by BRIAN CHRISTENSEN
The U.S. was home to less than 20 craft distilleries in 1999. One of them was in Idaho.
Considering the year driving this statistic, it doesn’t seem plausible. It was certainly possible, of course — vodka can be made from potatoes, after all. But bold steps into the distilling game would theoretically come from states of a larger size, a larger population, or closer proximity to Kentucky, since the exchange of whiskey-related information would flow more freely in a pre-internet world. Idaho checks none of those boxes.
Koenig Distillery defied these expectations when Andy Koenig launched his eponymous Idaho distillery in Caldwell, a city of about 60,000 people roughly 30 minutes west of Boise. Twenty-six years and several awards later, it’s clear the decision to open a distillery wasn’t a fluke or novelty. At the same time, Koenig understands the shock factor.
“Nobody had ever really heard of making something legal from scratch back in 1999, especially at a place from this part of the world,” he said. “Some people may still be surprised that spirits are coming from here.”
When I talk to Koenig, it begins to make sense why one of the country’s OG craft distilleries came from here. It’s not that he’s one to boast about his achievements or operating an award-winning distillery. It’s quite the opposite. He refers to himself as the distillery’s ”president and maintenance guy.” I ask him if he considers himself a pioneer. His response? “You should probably call me naive.” But the lengthy Q&A session I had with Koenig provided enough contextual clues to affirm that it wasn’t just the distillery ahead of its time in relation to the craft distilling boom. He was too.
An INTERNATIONAL POINT of VIEW
Koenig Distillery’s roots don’t begin in Idaho. They don’t even begin in the United States.
As a youth, Koenig spent a few years at his father’s farm in Austria. While he observed his dad cultivate apples, pears, and plums, he also took note of what his dad made with those fruits when harvested. “Back then in Austria, if you had fruit in your backyard, you could make brandy,” he said. “As a middle school kid, I thought that was pretty cool.”
His fascination with distilling culture stayed strong into adulthood. So much so that he returned to Central Europe after college to apprentice at a 17th-century distillery. The lessons learned through this stint translated into the traditional techniques he deployed when he launched his own distillery. As his production evolved from producing fruit brandies to vodka and eventually bourbon and rye, these old-school procedures remained intact. “We still lean on the techniques that have worked in distilling for centuries,” he said. “Everything here is done by smell and taste, not by computers.”
CONTINUING TERROIR TALK
Koenig’s commitment to Old Worldinspired, traditional techniques imbues his spirits line with a classic framework that leaves ample room for local touches to flourish. For instance, Koenig grows the fruit he uses for his brandies onsite, thus imparting a flavor profile that doubles as a flavor snapshot
of the Pacific Northwest. “It’s a gem of an area,” Koenig said. “It has a history of producing very nice stone fruits in particular. It made sense to build a distillery here.”
Even though Koenig contract distills his bourbon from Kentucky, the aging process occurs in Idaho. The grains may not be local, but the state’s temperature fluctuations, low-humidity summers, and proofing water are. These elements provide enough reason for Koenig to join the ever-growing conversation about terroir in spirits, particularly in terms of barrel provenance. Koenig particularly points
to the local water to cement such justification. “When you’re producing spirits, you need really good water because there’s so much of it in the barrel,” he said. “We’re fortunate to have snow runoff come into the Snake River Aquifer and into a deep well, where it gets treated well. This results in neutral tasting water ideal for distilling.”
His family further justifies his presence in the conversation, but not just because Koenig saw his dad making fruit brandies in Austria back in the day. The distillery’s property was also the site of Koenig Vineyards, a winery
“It’s a gem of an area. It has a history of producing very nice stone fruits in particular. It made sense to build a distillery here.”
— ANDY KOENIG
owned and operated by Andy’s brother, Greg. This changed in 2009, when the growth and success of both venues caused Greg to move the winery a few miles away.
To someone outside Idaho or the Pacific Northwest, Koenig Vineyards may also look like an unexpected venture. However, Idaho wine is somewhat of a known commodity, with roughly 70 wineries calling the state home. Koenig sits within the state’s Snake River AVA (American Viticultural Area) along the popular Sunnyslope Wine Trail. It’s an outlier, the lone distillery among the wineries producing chardonnays, cabernet sauvignons, and syrahs (including Koenig Vineyards). Andy sees their presence as an underrated way to encourage more tourists to come by and sample what his distillery has to offer.
“Being the only distillery there actually helps us,” he said. “It gives people coming to Sunnyslope the chance to see something different. Plus, when couples come from Boise or elsewhere, the husbands tend to be interested in the whiskey while the wives are interested in the wines.”
A DESTINATION DISTILLERY
There is little doubt that Koenig Distillery has full ownership of its backyard. Part of this is due to its prime location — the distillery is about a 35-minute drive from Boise, far enough away to provide a weekend respite for the state capital’s residents. Koenig helps facilitate local interest and community-building through the distillery’s Seven Devils loft, a roughly 1,300 square-foot meeting and event space offering stunning views of the property, the Sunnyslope Wine Trail’s landscape, and the nearby Owyhee Mountains.
While it’s safe to call Koenig a known commodity among Idahoans, that’s not necessarily the case outside of the state. According to Koenig, the element of surprise can compel visitors from afar to stop in. “We get a lot of people from Nevada and California that visit just because they happened to pass by us on the highway,” Koenig says. “It really helps us that we are right on the road and not isolated somewhere.”
SMALL but MIGHTY
Koenig Distillery’s success over the last quarter-century provides a proof of concept for distillers who are simply making hooch that builds community. While Koenig isn’t a nationwide household name, their entrenchment within Idaho and the Pacific Northwest has allowed them to be in a consistent state of growth. Koenig notes this has particularly been the case in the post-pandemic era. “Five years ago, we had four employees,” Koenig said. “Today, we’re up to 23.”
The distillery’s growth is also reflected by expansions of existing product lines and the launch of new expressions. Koenig plans on launching a tequila that’s produced in Mexico and aged in whiskey barrels later in the year. He’s also mulling over expanding his brandy offerings to include peach and huckleberry. The latter product would incorporate a beloved regional fruit, and feel appropriate for Koenig to produce. After all, they’ve been a beloved regional craft distillery in Idaho for quite some time, perhaps even longer than the term “regional craft distillery” has even existed.
Koenig Distillery is located in Caldwell, Idaho. For more information visit www.koenigdistillery.com or call (208) 459-8971.
Blending whiskey is the art of putting barrels together, where the hope is that the sum is greater than its parts. Blends can be achieved through a variety of methods, depending on the goals for the whiskey. Sometimes those goals are limited to the whiskey category (rye, bourbon), or the age (straight, age statement), and sometimes there is the option to take the path less followed. When it comes to blending, categories and shelf placement often rule supreme, as many producers fear the no-man’s land that is the DSS shelf; however, there are still creative ways to achieve flavor combinations without suffering from the cold placement on a long-forgotten shelf. When it comes to blending, weaving a story can create different layers of flavor. Telling this story can be either a literal or figurative interpretation. Mel Heim of Big Nose Kate (BNK), Nic Christiansen of Barrell Craft Spirits, and Ale Ochoa of Find Familiar Spirits (FFS) all tell stories using whiskey as their pen, creating blends that are novel and well-regarded.
PeOPLe,PLACeS, & THINGS
Big Nose Kate Western Whiskey is blended as an homage to a once-living person, Mary Katharine Horony. Kate was best known for her relationship with legendary figure Doc Holliday, and was a person of many contradictions. A product with her as the muse needs to speak to the complexity and tension that she lived. As such a person, there is no one that could have breathed life into this project as well as Mel Heim.
At the time of this interview more than a year ago, distilling industry veteran Mel Heim was the company’s co-founder and partner whose main responsibility was blending Big Nose Kate. Now CEO, she remains a large part of the reason Big Nose Kate is blended the way that it is. The decision to make the product a rye came early in the project, and that was as much a desire to avoid the bourbon category as it was a reflection of Kate’s Wild West image. Over time, the rye whiskey was combined with American single malt, and together, they created a fire and earth.
The goal for BNK from the beginning was to grow and enter new markets, and the blend has gone through several evolutions based on
A product with Big Nose Kate as the muse needs to speak to the complexity and tension that she lived.
availability. The final product consists of different mashbills of rye whiskey and single malt. It includes a range of age statements (4-6-yearold whiskies) and is bottled at 45 percent ABV. Heim’s blending style for BNK comes from the world of Scotch, whose mantra is “go slow.” Sensory starts with samples before barrels arrive. With each sniff test, the barrel is accessed in terms of any differences created in the final blend. The barrels remain offsite until production is ready to blend, and when blending starts it is approached slowly, with some whiskey in oak and some in vats, proofing over time to bottle strength. The ultimate goal is consistently good whiskey with an accessible price point.
WrITTeN BY mOLLY TrOuPe
PeOPLe
For Barrell Craft Spirits’ Seagrass expression, the story shaped the whiskey, and the goal was to create a rye whiskey with different cask finishings reminiscent of ocean air and grass.
PLACeS
Barrell Craft Spirits is known for two things: 1) well regarded whiskey and 2) whiskies that do not follow the usual script. At Barrell Nic Christiansen is the person responsible for making sure blends are flavorful and consistent. Her background in the beverage world — she is a former U.S. Bartender’s Guild board member — suits her well in regards to flavor creation.
Christiansen is on the hunt for interesting flavors that blend well. What aids her in this search is flavor data points via sensory analysis. Watching barrels as they age and predicting how they will perform in a blend takes time and some experimentation. Sometimes there is an idea that shapes the experience, and sometimes the whiskey itself shows the way. For their Seagrass expression, the story shaped the whiskey, and the goal was to create a rye whiskey with different cask finishings reminiscent of ocean air and grass. Christiansen used a complex blend of rye whiskies from different sources and barrel finishes including Martinique rum, Madeira, and apricot brandy barrels.
For finishing barrels, it is important for them to find barrels quickly that have had minimal interference. Heavy quality control is performed on every barrel before any whiskey is added. If these barrels require treatment, steam is never an option. They are only rewetted as needed.
THINGS
Ale Ochoa started in the industry at a young age, working on her master’s thesis. While she stepped away briefly to work with agave spirits, an interesting whiskey blending project with actor Matthew Lillard’s Find Familiar Spirits drew her back in 2023. This project features sneaker drop-style whiskey releases that are born to help tell the stories of characters from Dungeons & Dragons. These blends are very experiential and include custom items other than whiskey to tell the story, like dice and stories featuring well-regarded writers. (Author's Note: Since interviewing Ochoa a year ago, I have taken over this role as Master Blender and got to see how much thought goes into every detail.)
In 2024, FFS released four different whiskies: Dragon, Warlock, Paladin, and Rogue. Each release had a unique story, based on the character class for the release. The written story shapes the liquid story to create a full-bodied customer experience. Kate Welch wrote the story for Warlock, which featured a mad pirate character and fantastical tale of life on the sea, and the whiskey was made to complement with notes of citrus and tropical fruit as well as heavy tones of oak, just like the wood from the ship. Ochoa hand-selected barrels to pull out these characters. It takes practice, a fine nose, and some math in order to achieve the perfect blend.
Because these are sneaker drop-style whiskies, each whiskey is a standalone product. From a blending perspective, this gives Ochoa a lot of allowance for achieving layers of flavor. The blender is not constrained with having to ensure that the barrels found for the project will be available for the foreseeable future, in order to achieve consistency. To steal a phrase from our sea-buckling pirate Warlock: The world of whiskey is your oyster!
There are many blending projects these days with nontraditional goals focused on creating complex whiskey models and breathing in storytelling. Regardless of the goal, blending marries the creative process with realism. Sourcing whiskey or whiskey-making materials, aging, and more are all part of this process, where blenders take things that are inconsistent and strive to make something that is equally delicious with a consistent customer experience. At the end of the blender’s day, the hope is always the simple phrase: the sum is greater than its parts.
releases that are born to help tell the stories of characters from Dungeons & Dragons.
Molly Troupe attended Southern Oregon University where she earned a Bachelor degree in Chemistry. After SOU, she continued her education by attending Heriot Watt University where she earned a Master degree in Brewing and Distilling. In 2017, she joined forces with Jill Kuehler as Freeland Spirit’s Master Distiller and Partner. In 2018 she was featured on Forbes 30 Under 30 for Food and Beverage and, at 27, was the youngest woman Master Distiller in the United States.
Commercial trials reveal the potential of high-ester yeast strains
FROM LAB TO GLASS
Written by BRETT STEIGERWALD and HALEY CHURCHILL
The distilling industry is built upon tradition. From product marketing to company ethos, it is interwoven in nearly every aspect of the production process. These historical practices have led to an incredible diversity of production techniques and spirits that speak to cultures and traditions. However, at smaller facilities, these production practices can be difficult to adopt, implement, and successfully control. Given these realities, how does an industry innovate while remaining faithful to its traditions?
Over the past 40 years, innovations in yeast and bacteria development have enabled distilleries to experiment to improve efficiencies and produce a wide variety of spirit profiles and organoleptic characteristics in a controlled, predictable fashion that was not thought possible a few decades ago. These innovations have led to the creation of bespoke distilled spirits, allowed for complex blending and finishing programs, and given the consumer diversity within spirit categories. Additionally, these innovations have allowed distilleries to simplify their fermentation process, reduce the variance between batches, and further refine their production practices. However, there are still great impediments facing facilities that wish to explore ancestral techniques, which were utilized to create rich sources of ester precursors (organic acids) for strategic addition to the fermentation to hopefully yield a distillate with desired high ester-y characteristics. Such high ester distillates are then used as intermediate blend components to create diverse flavor profiles. Even for large facilities, this is a labor-intensive process.
Most recently, the advances in precise and safe genetic engineering have enabled investigators to modify individual yeast strain traits to improve yields, increase the production of desired organoleptic characteristics, lessen/ limit the production of non-desired fermentation products, and much more. (This is covered in detail by Gabe Toth in his Winter 2025 Artisan Spirit article: Genetic Engineering in the Distilling Industry).
The Montreal-based company Lallemand Distilling has recently produced the first high-ester yeast strain (DistilaEdge TC) capable of producing a wide variety of characteristics (overproduction of a variety of acetate esters) from a range of fermentative bases. This will potentially allow facilities to create aromatically intense, organoleptically complex distillates with minimal modification to existing processes, all while offering similar process efficiency.
The strain is a bioengineered distilling Saccharomyces cerevisiae that features a single intergenic modification leading to the increased production of acetate esters in alcoholic fermentations. This technique of organism modification is one of many employed by researchers to develop desirable new traits. Unlike traditional strain improvement techniques, such as domestication, yeast hybridization, and mutagenesis, strain engineering offers a precise and targeted approach. In contrast, traditional methods, tend to produce randomized results, rely on time-intensive selection strategies to modify existing traits, and cannot introduce entirely new traits into the organism.
APPLICATIONS
Regardless of size, distilleries face space/location limitations when considering the adoption of novel production techniques. For rum producers, countless facilities are experimenting with cane acid, dunder, and/or muck programs, with variable success. These programs seek to naturally produce high concentrations of acid precursors to enhance fruity notes and complexity in their distillates. These are worthy approaches; however, DistilaEdge TC over-produces fruity esters, in addition to intense floral aromas, in a predictable, controlled manner with significantly less labor. This means that any facility can easily utilize this new strain and produce remarkably complex distillates with little added effort.
Labor aside, this new strain enables never-before-seen flexibility pertaining to blending capabilities and the ability to tailor cut points to focus on specific presentation of desired esters or other organoleptic characteristics, depending on the fermentative base. For consumers, it will be an exciting new age where science meets art and redefines the poetry we find in each contemplative glass of good stuff.
R&D TRIALS
In the development of the DistilaEdge TC strain, multiple feedstocks were fermented and evaluated, each with exciting results.
R&D Trial 1 was completed on a bourbon mash that included 77 percent corn, 15 percent rye and 8 percent malted barley.
Read Genetic Engineering in the Distilling Industry
FIGURE 1A
Figure 1.
A) Ethanol production of control yeast and the novel DistilaEdge TC in a bourbon style fermentation.
B) Ethanol production of control fermentation vs. novel DistilaEdge TC fermentation in blackstrap molasses.
As the initial trial, the goal was to understand how the upregulation of the ester pathway would impact the fermentation kinetics and product quality. Trial 1 found that the novel strain had slightly slower kinetics in fermentation (Figure 1A) but produced a highly flavored spirit (Figure 2B) and did not result in any yield loss.
R&D Trial 2 was completed on 100 percent Black Pearl blackstrap molasses (a filtered blackstrap molasses). Kinetics and fermentation time were not found to be significantly different from the control (in this case, DistilaMax CN co-pitched with DistilaBact LP), but the total esters were found to significantly increase in the DistilaEdge TC fermentations (reaching that of examples of commercially produced high-ester rums).
SOFT LAUNCHES
Similarly, in commercial case studies carried out with a variety of industry partners, the strain was found to consistently produce complex spirits high in fruity esters. It was a great opportunity to collaborate with partners all across the U.S. that are utilizing a variety of feedstocks.
Lyon Rum, like many U.S. rum producers, utilizes a split base of Louisiana blackstrap molasses and raw cane sugar to produce their award-winning pot distilled rum.
% ABV in Bourbon Fermentations
% ABV in Molasses Fermentations
DistilaEdge TC Control
Their standard fermentation process utilizes a sparkling wine-style yeast that yields an aromatic, grassy, and creamy distillate. In January 2025, they performed a triplicate trial of DistilaEdge TC identical to their standard method at the distillery in St. Michaels, Maryland. This new strain showed better yield and kinetics, and it produced a significantly more complex distillate than the house strain.
Yeast selection can make a huge impact on processability and profitability in a high-rye mash. Few know this better than the team at WhistlePig Whiskey in Shoreham, Vermont — a world-renowned, award-winning brand and leader in the rye whiskey category. The standard WhistlePig process includes a 100 percent rye mash and a conventional whiskey yeast that produces a spicy, grain-forward spirit. The strain performed on par with the control yeast. During fermentation, pleasant notes of banana and clove were noted in the distillery. Upon distillation, heavy
fruit and ethyl acetate notes were found in the heads, and the hearts came through with ester-y banana notes. “It was for sure the topic of conversation for everyone who walked in the distillery,” commented head distiller and operations manager Chris Dichard on the aromas noted during fermentation.
Whiskey Acres, a seed-to-spirit estate distillery in Dekalb, Illinois, found similar results in their rye whiskey. With a high-rye mash bill featuring corn, final ABVs from the batches fermented with DistilaEdge TC were again seen to be slightly higher than the control. The final distillate was described as tropical and fruity — with piña colada, banana, and floral notes, complimenting the spicy rye notes still able to shine through.
Traditionally Scottish single malts are described as fruity, with notes of apples, pears, and citrus, with light florals and a sweet finish. Knowing the American category is looking to push the envelope, applying a product like DistilaEdge TC to a malt-based whiskey
seemed like an obvious next step. Therefore, at Bendt distilling in Lewisville, Texas, the novel strain was tested in a malted barley/ wheat mash. Both the Lallemand and Bendt teams were excited to see this strain perform in a high-malt mash, as the American single malt category takes hold and grows. The resulting spirit was filled with fresh banana, light florals, hay, cotton candy and bubblegum.
At Porchjam Distillery, there was the opportunity to use a fairly unique feedstock for U.S. spirits. Porchjam, located in New Orleans, Louisiana, uses a unique method of production, pumping fresh sugarcane juice right from the mainline in a local sugar mill into a tanker truck and hauling it back to New Orleans. We inoculated DistilaEdge TC into this tanker at the mill and pumped it into fermenters when back at the distillery. While
this style of spirit is typically already rich in complex aromas and flavors, reminiscent of the sugarcane it’s made from, the new yeast strain boosted the vibrant fruit notes in the resulting rum. “Immediately following the heads cut, as soon as the ethyl acetate and acetaldehyde cleared as the main components, we were flooded with the most rich, tropical aromas I’ve experienced in a distillate. The
Total Esters of White Rum with DistilaEdge TC vs Commercially Available High Ester Rums
Figure 2. A) Gas chromatography analysis of total esters of novel in new make spirit from blackstrap molasses fermentations with DistilaEdge TC with and without heads and tails recycling (H&T R) vs. commercially available high ester rums.
Acetate Esters in Bourbon New Make Spirit
B) Gas chromatography analysis of various acetate esters in new make spirit from bourbon fermentations with DistilaEdge TC with and without heads and tails recycling (H&T R) vs. bourbon new make spirit fermented with conventional yeast.
FIGURE 2B
FIGURE 2A
early hearts had this warm, bright mango note and honeydew melons followed by bananas and pineapple,” said Jason Zeno of Porchjam Distillery. The resulting spirit was complex, fruity, and ester-y but did not hide the character of the fresh cane juice. In all cases, the distillation was the part of the process with the greatest learning curve. The extreme level of acetate esters produced by this strain makes for very pungent heads, making it tricky to know where to make the first cut. It was noted by nearly all of the distilleries highlighted above that heavy solvent notes in the heads give way to super fruity, peachy, floral, and complex hearts. Running deeper into the tails than would typically be done was also found to best capture the phenethyl acetate (rose) that is also overproduced by this strain. Upon encountering the floral complexity of the tails, Lyon Rum Head Distiller (and co-author of this article) Brett Steigerwaldt
discussed the potential applications of this yeast strain across the industry. “For rum, this will truly enlarge the Queen’s Share category and allow significantly more complex versions of this legendary release [DistilaEdge TC]. For whiskey, it will significantly diversify the category by allowing producers to lean into these new organoleptic possibilities and pair them with complimentary barrel profiles.”
CONCLUSION
The development of new yeast strains into the distilling industry is undoubtedly going to change what is possible for distillers of all sizes. From craft distillers looking to make a high ester-style rum (or a high ester whiskey) while avoiding muck/dunder, or American single malt producers who want to set themselves apart in an emerging category, there is an opportunity to transform fermentation.
Brett Steigerwaldt is the head distiller for Windon Distilling Company, the home of LYON RUM, in Saint Michaels, Maryland, and the chair of the Maryland Distillers Guild Education Committee. He is committed to exploring how distilling can solve real world problems and strengthen communities, such as his volunteer work with DomSetCo in Dominica. There, he is the head distiller for Rosalie Bay Distillery in Rosalie, Dominica, the world’s first nonprofit rum distillery/ocean conservation center. He holds a BSc and MSc in mechanical engineering and an MSc in brewing and distilling (Heriot-Watt 2023), where he investigated novel fermentation techniques to create organoleptically complex rums with minimal additional process complexity. Haley Churchill spent a decade in craft breweries in the quality space specializing in quality systems and sensory program development, before joining the Lallemand Distilling Team. Haley now works with craft distillers on the east coast and northern part of the U.S., providing technical support and facilitating process troubleshooting and optimization.
STRENGTH in NUMBERS
The case for adding SKUs to your distillery
WRITTEN BY KRIS BOHM
Step foot into most craft distilleries, and you will find that they have thriving tasting rooms and cocktail lounges. While there may be one type of spirit your distillery focuses on, it is logical to cater to the diverse taste of the people who visit your distillery. For example, what if a spirits enthusiast has brought someone along with them to your tasting room who is not so enthusiastic about distilled spirits and may be tough to win over? The type of consumer who may not care for the taste of distilled spirits can still be catered to with the right type of product. You would be remiss not to capitalize on the opportunity to sell several types of products for visitors to enjoy in cocktails and bottles to-go. Let's talk about some of the diverse spirits that can be produced to meet the broad tastes of an audience in your tasting room.
As a young distiller, I very much had the purist mindset. Plying my craft to make world-class whiskey, rum, and vodka, I viewed adding flavoring or sugar to spirits as cheap shortcuts.
The owner of the distillery I worked for had a different view on flavored spirits. They insisted we develop a prickly pear-flavored vodka to add to our spirits portfolio. If you have ever tasted a prickly pear, you would know the cactus fruit really does not have much flavor. After many trials using fresh prickly pear to develop a unique spirit, I concluded that I could not get the bold flavors we wanted
from the fresh fruit. The next stop in our product development was to turn to natural flavors. We sourced several different natural flavors that were TTB approved and tested adding those flavors to our regular vodka. These natural flavors really hit the mark to produce a spirit with the bright taste we wanted, but the spirit was still lacking something special to make it taste just right.
Our next step in the development was to add sugar to the product. The addition of sugar and flavor to the vodka was just the right combination to produce a spirit that was delicious and bright. Now, I was not proud of this product. The addition of flavors and sugars to a spirit did not sit well with me and my pursuit of purity in distilling. Although I did not like the idea in principle, we taste-tested the flavored product with a slew of people and received many compliments. Because of the nearly unanimous love of our new prickly pear vodka by all who tasted the concept, we moved forward
The type of consumer who may not care for the taste of distilled spirits can still be catered to with the right type of product.
If your distillery is looking to grow, flavored spirits could be a step in the direction needed to expand your portfolio and cash flow.
and put the product into production. A year later, the prickly pear vodka was the best-selling product in our tasting room. Our bartenders embraced the flavored vodka and created a slew of unique cocktails with the spirit. These great drinks, along with the bartenders’ love of it, created a movement that took our first flavored product from a simple concept to our flagship product.
The result of this success was additional cash flow that allowed us to expand production and continue producing the bourbon we loved to make. Of course the distillery owner gave me a well-earned “I told you so.”
When you dive into the flavor options that exist from flavor companies like Amoretti and Mother Murphy's, you will see that there are literally thousands of options readily available to produce flavors to add to your spirits. Some flavor companies can even produce custom one-off flavors to add to your products. The path of working with flavor
companies is quite easy, as they have flavors that are TTB approved, which helps to streamline the federal approval process. Cream-based spirits are another category that has found success in craft distillery tasting rooms. There is a remarkably broad market for flavored spirits, especially if they are done well. According to DISCUS, cordials and liqueurs outsold gin in 2024 by double the case sales.
If your distillery is looking to grow, flavored spirits could be a step in the direction needed to expand your portfolio and cash flow. It is highly likely your distillery has the excess capacity to add another SKU to your spirits portfolio. Take the time to consider creating a flavored spirit or cordial to add to your lineup; it might just be your next big thing.
Kris Bohm is the Owner of Distillery Now Consulting. When Kris is not making whiskey, you can find him
riding his bicycle and cracking lame dad jokes.
At Garrison Brothers, nothing beats the magic of bourbon
TruLY ePIC
The first thing that strikes you when you step onto Garrison Brothers’ property in Hye, Texas, is its size. Dubbed The Ranch, it’s a property of epic proportions: sweeping landscapes dotted with patchy grass fields and gnarled shady trees, dusty trails leading to slightly creaky wooden buildings and metal-encased distilling structures, and ranch-themed artwork affirming its Lone Star state locale. The “everything is bigger in Texas” sprawl drips with the sweeping romanticism befitting of a classic Hollywood western.
The environment jibes rather well with the influence the Texas craft brand has had since namesake owner Dan Garrison launched the brand in 2005. Garrison Brothers did more than become the first legal distillery in Texas — their award-winning juice helped lay the groundwork that allowed the Lone Star State to earn respect as a legitimate whiskey producing region. Bring up the notion of Texas bourbon, and there’s an excellent chance their distillery will be the first one mentioned. WRITTEN
The folks making Garrison Brothers are fully aware of their status as a Texas distilling pioneer. They also know their stuff is damn good bourbon. This doesn’t come across as full-blown braggadocio. It’s instead underscored by a palpable sense of pride that can only come from making something others enjoy. Awards and such are cool, but the bourbon is always way cooler.
A First…Probably
Samatha Olvera is Garrison Brothers’ production operator. She is also one of the first Latina woman to distill bourbon in the United States — at least, she thinks she is. She doesn’t really dwell a whole lot on whether she’s a pioneer because she doesn’t fully lean into her status. She’s crafted a career out of making bourbon, which matters most to her, much more than the acclaim for the juice she helps make. “Honestly, I forget about the award-winning part until someone brings it up,” she said. “While I’m grateful for the accolades, I’m even more fortunate and blessed to have found my passion in making bourbon, and if doing what I love inspires others to follow their passion, then all I can say is, ‘Hell yeah!’”
Olvera’s path to distilling wasn’t exactly linear — she earned a degree in respiratory therapy. She gained an interest in bourbon as a bar manager at a venue routinely visited by Garrison Brothers’
“Being a bar manager absolutely gives me a unique perspective on distilling. But even more so, it gives me a deeper respect for the distilling craft and those that put the blood, sweat, and tears into making it.”
—
employees. Their visits sparked a level of curiosity she parlayed into an opportunity with the distillery. Those bar days still inform Olvera’s approach to making bourbon, since she’s witnessed firsthand how the right spirit made in the right way can build community. “Being a bar manager absolutely gives me a unique perspective on distilling,” she said. “But even more so, it gives me a deeper respect for the distilling craft and those that put the blood, sweat, and tears into making it.”
The respect is mutual. In 2023, the International Women’s Spirits Competition bestowed Olvera with their Best Woman Distiller award. The hardware holds significance for Olvera. It affirms the appreciation her peers have for her distilling skills, and not just because she’s thriving in an industry dominated by white men. That said, she knows of her significance in the industry as a Latina woman, and she doesn’t shy away from discussing the challenges she and others like her face when it comes up in conversation.
“Last year, I was fortunate to meet a wonderful fellow Latina in the industry, and I was very thrown off by her nervousness to meet me,” Olvera said. “As we talked, I learned that we had so much in common as far as what we’ve endured in following our passion in the industry.
SAmATHA OLVerA Production operator, Garrison Brothers Distillery
PHOTO BY BRENT BAXTER
PHOTO BY LEE FENNER
Making bourbon is not something that’s common for our culture and gender, and it took a few years and a visit to the distillery to gain my family’s support and understanding. To hear that I was this woman’s inspiration to pursue her passion in the industry and not take ‘no’ as an answer brought everything from my journey full circle.”
Dealing With the Heat
If you talk to any Texas distiller, discussions about handling the Texas climate will eventually occur. Garrison Brothers is no different. However, the topic tends to warrant deeper conversations about distilling rather than complaints about it interfering with the distilling process.
“The Texas climate has ensured that we stay hyper-focused on every single step of the production process,” explained Garrison Brothers master distiller Donnis Todd. “It’s critically important to understand the importance of the environment around us. Garrison Brothers aims to use the climate to our advantage, not fight it. Most importantly, we respect it.”
This respect keeps the Garrison Brothers’ team humble, even if their ambitions appear lofty. According to Todd, they strive to produce what he calls “the best bourbon you’ve ever tasted.” At the core of this mission, however, is simply to make better bourbon every day. While the awards earned over the past two decades indicate success in this endeavor, Todd feels that they still have something to prove. This doesn’t leave room for complacency, especially where the brand’s loyal fans are concerned.
“Trust is earned and that’s never easy, no matter how much of it you have,” Todd says. “I feel like I’m just getting started [with distilling], and I’m happy to have such an amazing, passionate team around me.”
Building Community
As you go deeper into The Ranch’s colossal digs, you’ll likely encounter an elongated barn. The slogan “Good Bourbon Can Change the World” stretches along one of its lengthy sides in thick, block letters. Words to live by, but the distillery’s philanthropic work ensures it’s not merely a catchy phrase. They’ve been immersed in giving back to the community over the years, joining campaigns and hosting events to raise awareness and funds for veterans, museums like the National Museum of the Pacific War in nearby Fredericksburg, and historic institutions such as The Alamo.
“The Texas climate has ensured that we stay hyper-focused on every single step of the production process. It’s critically important to understand the importance of the environment around us.”
DAN GA rr ISON Co-founder, Garrison Brothers Distillery
Some of these efforts also demonstrate a desire to be stewards of the land. For their annual Lady Bird Bourbon release — a limited edition run of their Texas straight bourbon infused with wildflower honey and finished in Cognac XO casks — Garrison Brothers donates $5 from every bottle sold to the Lady Bird Johnson Wildflower Center, an Austin-based nonprofit dedicated to preserving native plants and natural landscapes. Such work also allows them to further acknowledge The Ranch’s special nature.
“The Ranch we built Garrison Brothers Distillery on is a big, beautiful Texas hill country treasure,” Todd said. “We’re going to leave it better than we found it, we’re going to respect it, and we would fight for it.”
These special endeavors highlight Garrison Brothers’ commitment to doing good in numerous ways. But it doesn’t take a special event or
a limited release to build community. All that’s needed is a good bottle of bourbon, and Garrison Brothers has delivered this from deep in the heart of Texas for two decades. Their own community is also growing: Olvera’s expecting her first child, a daughter, this summer. She’s looking forward to imparting her influence and passion to her newborn the moment they meet. Of course, this will look radically different from the inspiration she provides each batch of Garrison Brothers’ bourbon she oversees.
“I play plenty of Tejano music when I work,” she quipped. “The fermentation loves it.”
Garrison Brothers Distillery is located in Hye, Texas. For more information visit www.garrisonbourbon.com or call (512) 381-3155
PHOTO BY BRENT BAXTER
PHOTO PROVIDED BY GARRISON BROTHERS DISTILLERY
M ay I conduct a brief poll?
How many of you have heard of a specialty craft distilled spirit that you felt an immediate urge to try? How many of you have sought this product in your local liquor stores, only to find it unavailable because that brand is not distributed in your state? And how many attempted to purchase it directly from the distiller online, only to discover that your state's regulations prohibit such shipments?
HOW CRAFT SPIRITS LOVERS CAN ADVOCATE FOR DIRECT SHIPPING HO W CRAFT SPIRITS LOVERS CAN ADVOCATE FOR DIRECT SHIPPING
Written by Alex Koral
I, for one, can attest to experiencing these frustrations, and I suspect I am far from alone. The fact is that, currently, only nine states permit distilleries to engage in direct-to-consumer (DTC) shipments, thereby leaving a majority of Americans without access to most of the craft spirits produced nationwide.
Among aficionados of craft spirits, the concept of DTC shipping garners substantial support, yet it remains largely unattainable due to restrictive state laws. Why do most states
Currently, only nine states permit distilleries to engage in direct-to-consumer DTC) shipments, thereby leaving a majority of Americans without access to most of the craft spirits produced nationwide.
continue to inhibit consumers from procuring spirits directly shipped to their residences, especially when nearly all states allow DTC shipping for wine? Moreover, what measures can spirits enthusiasts undertake to address this issue? This article aims to address these questions.
What is DTC shipping of spirits, and why is it unavailable to me?
Direct-to-consumer shipping of spirits is when a consumer purchases a product from a distillery, perhaps one down the street or one half-a-dozen states away, and then the
81 percent of regular craft spirits drinkers want state laws to change to allow for more shipping options.2
distillery has a common carrier deliver the purchase directly to the consumer’s home. While this may seem like an obvious definition, it is that act of using a common carrier (think: UPS or FedEx) to fulfill the purchase that makes DTC shipping a special type of sale with unique rules and distinct from deliveries made by local retailers (or third-party services like UberEats).
By allowing both the consumer to connect with the distillery and the distillery to ship directly to the consumer, the sale avoids the burdens and constraints of the three-tier system, which often prevent craft distilleries from selling outside of their home state.
This model has proven successful for the wine industry, which can DTC ship to 47 states and D.C. In recent years, revenue from DTC shipping of wine has risen to around $4 billion a year,1 representing about one-tenth of the entire off-premise wine market (critically, these are additional sales and are not coming at the expense of wine retailers).
For spirits, though, wine’s success is a far-off dream. This is because most states continue to prohibit DTC shipping of spirits, with Alaska, Arizona, D.C., Kentucky, Nebraska, New Hampshire, New York, North Dakota, Rhode Island, and Vermont being the outliers, and even then, there are some extreme restrictions. For example, Rhode Island only allows shipping after an in-person purchase, and Vermont only allows shipping of RTD cocktails under 12 percent ABV.
Clearly, there is room for craft distillers and craft spirits lovers to change things and develop a system more in line with their interests and desires if they will take the time and effort to advocate for that change.
It shouldn’t be a surprise that craft spirits enthusiasts want the access and availability that DTC shipping provides. Indeed, according to the 2024 Direct-to-Consumer Spirits Shipping Report,2 produced in collaboration between Sovos ShipCompliant and the American Craft Spirits Association, 81 percent of regular craft spirits drinkers want state laws to change to allow for more shipping options. Even more notable is that 65 percent of all respondents, including non- and casual drinkers alike, think that state laws need to be updated to better align with 21st century consumer expectations. This reflects the general trend among craft consumers to seek out new and exciting brands to try. Per the report, 77 percent of craft drinkers have tried new spirits brands while traveling that they’ve wanted to purchase at home. Enabling DTC shipping — allowing a distillery to get licensed by the state where the consumer lives and ship in compliance with that state’s laws — would make spirits-related tourism that much more worthwhile. It is important to note that DTC shipping does not come at the expense of sales made in local retail stores. Indeed, 92 percent of regular craft drinkers reported that they would likely seek out the brands they bought via DTC shipping at their local retail stores. One of the key lessons of decades of wine DTC shipping is how it can help a brand establish a local market. There are many cases of wineries that moved from DTC shipping onto selling in retail stores and restaurants.
It also should be noted how beneficial these potential new markets would be to craft distilleries, many of which are struggling to grow. Nearly half of respondents in that report said they would be likely to spend $100 or more a month on DTC-shipped spirits, with 77 percent saying they would be likely to join a subscription club.
Based on this report, DTC shipping of spirits would be both extremely popular and beneficial to producers and consumers alike (and even for states because of the additional tax revenue that licensed shippers would provide). So what can we do to make it more widely available?
How consumers can help shape DTC laws
The first thing for consumers to recognize is the power they have when it comes to advocating for new laws. As voters, they have tremendous sway over their legislators, and even a small group that is well-organized with a consistent message can affect great change.
Of course, organization can be difficult, but there are plenty of cases of grassroots groups getting things done. In fact, the Free the Grapes! coalition,3 established in 1998, is a fantastic example that the craft spirits industry would do well to follow. By identifying where DTC spirits shipping bills are in play and providing a ready script and lists of legislators’ emails for consumers to use, Free the Grapes! has made it easy for wineries to direct wine lovers to action and get their voices heard. And the results — nearly national DTC shipping — speak for themselves.
92 percent of regular craft drinkers would likely seek out the brands they bought via DTC shipping at their local retail stores.2
Consumers and distilleries alike also need to collaborate with local state guilds. These organizations often have lobbying staff and can provide further guidance on how to support pro-DTC shipping initiatives. State legislators also often ask guilds for their input on potential
3 https://freethegrapes.org/
Recognizing that the laws limit our access to the national spirits market is the first step in working to change that system
bills, so getting those guilds to advocate for DTC shipping on behalf of their members is critical.
But most of all, we need to simply raise awareness of the issue. Many consumers (and even many distilleries!) don’t realize that most states prohibit DTC shipping. Part of the issue may be the prevalence of less-than-fully-legitimate services that promise “fully compliant” shipping programs that don’t stand up to any real scrutiny.4 Recognizing that the laws limit our access to the national spirits market is the first step in working to change that system.
Expanding direct-to-consumer shipping of distilled spirits is a win-win for consumers, distilleries, and supporting industries. Strong consumer interest and potential benefits highlighted in the Sovos 2024 Direct-toConsumer Spirits Shipping Report showcase the need for legislative changes to modernize the spirits industry. By getting involved and advocating for these changes, consumers can help create a more equitable and accessible market for craft spirits.
Expanding direct-toconsumer shipping of distilled spirits is a win-win for consumers, distilleries, and supporting industries.
Alex Koral is Regulatory General Counsel for Sovos ShipCompliant, where he serves as lead legal researcher for beverage alcohol regulation and has become a leading expert in DTC shipping laws and interstate distribution of alcohol. He has spoken on the topic at many industry events including ACSA Convention, Craft Brewers Conference, DTC Wine Symposium, as well as meetings for the National Council of State Liquor Administrators and the National Liquor Law Enforcement Association. Alex has been in the beverage alcohol arena since 2015, after receiving his J.D. from the University of Colorado Law School.
Muddle mint in simple syrup in a glass, add bourbon and ice, and stir to chill. Add more ice until glass is full and garnish with more mint.
’m certainly not the only distiller who enjoys celebrating St. Patrick’s Day. Like many, I’ll enjoy corned beef with an Irish coffee or a nice stout. As a gardener, I have St. Patrick’s Day circled on the calendar for another reason: the unofficial start of another growing season. I’ll admit that I don’t always garden on March 17, but that’s the date I keep in mind for starting seeds indoors. While summer is when the real growth happens, I think spring is when an area shows its sense of place, or terroir if you prefer. I know I’m most attuned to the weather as winter transitions to spring, looking forward to warmer days and shorter nights. While terroir can be hard to pin down, a gardener has a few metrics to help describe their local climate — namely, plant hardiness zone, growing season length, and average precipitation. These metrics help a gardener decide what to grow when and is the reason why I have two trays of seedlings in my windowsill starting in mid-March.
Pea Tendril Collins
2 oz pea tendril infused gin
1 oz lemon juice
0.75 oz simple syrup
3 oz soda water
Infuse 750ml of London dry style gin with a bunch of pea tendrils from the garden overnight. Shake gin with lemon juice, simple syrup, and ice. Strain into a Collins glass filled with ice and top with soda water.
Plant hardiness zones relate to the average minimum temperature an area reaches and which plants will overwinter there. The lower the number, the colder it gets in the winter. This is why wine grapes thrive in some regions and not others and why some places plant barley in the winter while others plant it in the spring. In Denver, Colorado, I’m somewhere between Zones 5 and 6. Thyme will overwinter, but rosemary won’t. That doesn’t mean I can’t grow both, but it does mean I have to plant rosemary every year.
Growing season is the duration between the last frost in the spring and the first killing frost in the fall. The number of frost-free days vary greatly across the United States and even within states. Where I can plan on a growing season of around 150 days, a gardener in Vail can only expect 66. If a tomato takes 90 days to grow, it’s understandable why Vail is known for skiing and not produce. My frost-free date is early May, around Mother’s Day. This is conveniently around eight weeks from St. Patrick’s Day, the same amount of time that is usually recommended for growing seedlings before transplanting.
Precipitation means more to a gardener than the average inches of rainfall for their area. Frequency and intensity are just as important, not to mention the type. In my neck of the woods, hail is common in the late spring and early summer months, and I know that every couple of years my garden will experience an untimely setback. Due to the hot, dry summer days, my gardens are irrigated to supplement rainfall.
Knowing these measures of my local climate help me frame how and what I want to grow in my gardens. Combine that with the cultural aspect of what I like to grow, eat, and drink, and what emerges is the terroir of my garden.
Designing and crafting exceptional spirits from ground to glass
My garden in spring starts with two trays of seeds. These are the peppers, tomatoes, and basil that will make many summer meals pop. Also started this year are six varieties of coriander, a little experiment to see if any have a flavor that truly stands out. As a main component of the gin and other liqueurs we produce, I want to see if there is any more flavor to chase. In addition to growing the plant for its seed, using the cilantro leaves for salsa and the root for making green curry paste is a nice benefit.
CONSULTATION
SERVICES
● Expertise in recipe development, distillation techniques, and sensory analysis
● Designing efficient, scalable production facilities tailored to your needs
Gardening outside begins around April 1. I cut back any rye that’s been growing as a cover crop and add compost to prepare the soils. I garden organically, with compost and crop rotations two of the main strategies I use to promote soil health. The garden will start to show signs of life with perennials starting to turn green and show growth. My perennials include Florentine iris that produces orris root, strawberries, raspberries, thyme, yarrow, and mint, which is usually ready to be harvested and mixed with bourbon by the first Saturday in May. Plants that aren’t perennials but that readily self-seed typically start to show up a little later in spring. In my garden these include chamomile, fennel, and dill — all favorites for using in cocktails and liqueurs. Along with the plants that return every year, April is when I plant crops that can withstand cooler weather. This includes hand planting the purple kernels of Oland wheat that I hope will yield a crop of purple wheat. It also includes my salad garden that consists of peas, radishes, carrots, onions, and mixed greens.
● Implementing best practices in workflow optimization and safety
● Overseeing project timeline, budgets, and construction phases
● Barrel selection and maturation strategies for optimal flavor profiles
● Guidance on blending, finishing and quality control for premium products
May is the final spring month for gardeners, when plants that start indoors finally get their time in the sun. After Mother’s Day, tomatoes and peppers are transplanted outside, and corn, beans, and summer squash are planted from seed. By month’s end, cool-season plants and perennials are being harvested, and since this is a distiller’s garden, that means turning some of that fresh produce into a cocktail to enjoy in the garden.
focused degrees from both Michigan State and Heriot-Watt University.
Designing and crafting exceptional spirits from ground to glass
JOHNNY JEFFERY
FOOD CHEMIST CONSULTANT
● Expertise in recipe development, distillation techniques, and sensory analysis
● Designing efficient, scalable production facilities tailored to your needs
● Implementing best practices in workflow optimization and safety
● Overseeing project timeline, budgets, and construction phases
● Barrel selection and maturation strategies for optimal flavor profiles
● Guidance on blending, finishing and quality control for premium products
Jamie Burns is the lead distiller at The Family Jones in Denver, Colorado. He holds beverage
Achievable Data Analytics at Distilleries
There is often a misconception across the beverage alcohol industry that equates data analytics with expensive, and often impractical, laboratory equipment. Technology has evolved over the lifetime of the industry beyond what was originally thought possible, yet quality spirits were being produced before any of the advancements we see today were conceptualized. Data analysis can begin at the handwritten level and can be just as informative as some of the large-scale instrumentation, such as liquid chromatography.
Not all distilleries are able to afford or house the pieces of analytical instrumentation that can provide in-depth analysis of fermentation, distillates, and finished goods. However, there are three major tools at our disposal: Microsoft Excel, Google Sheets, and good, old-fashioned paper records. The combination of these means of data analysis can help distilleries of all sizes increase product consistency and identify deviations in procedure.
— PART 1
Written by Pete Barger and Samantha Harpst
Data is the key to consistency. Just like bourbon aging in the barrel, the more data you gather, the richer your understanding becomes — there’s no such thing as too much when it’s well curated. Even though the data may not be relevant in the present, a future need may arise and utilize what has already been collected. All data collected will have a lifecycle, which will help the distillery maximize consistency in the product.
When collecting raw data, make sure that all opportunities for biases are named with unique identifiers (for example, Joe’s shift is Team 1). The assignment of numerical ID numbers will help eliminate biases during analysis and will also aid in separating data once outliers are recognized. The raw data will become your historical database, which will help you set normal values for your data. Not only will the data indirectly create standards of procedure (SOP) for the processes being analyzed, but it will also link the data to “where” in the process the information was collected.
All processes in the plant have a SOP; however, these procedures are not always written down, especially at smaller facilities where team members wear a ton of hats. But in practice, a written SOP outlining when the data is being collected will create benchmarks, allowing the outliers to be attributed to a specific point in time. It is best to write all procedures in a “foolproof” manner, that way any misinterpretation of the process is mitigated. This will establish a sample collection framework that enables empirical data to be compared against historical patterns, allowing any outliers to reveal statistically significant deviations within the process. An example of this can be seen in Figure 1 using cook process times.
All data is collected by the team at Statesville Contract Distilling Company, a division of Southern Distilling Company, using proprietary methods for each operational process during cook times. The
3 DATA ANALYSIS TOOLS
The combination of these means of data analysis can help distilleries of all sizes increase product consistency and identify deviations in procedure. Let’s dive a bit deeper into each tool...
MICROSOFT EXCEL:
Although this software requires a subscription, it is the best application for accessible and relatively sophisticated data analysis. The extensive formulas and analysis add-ins allow for in-depth analysis of the data being entered into the system. One of the major downsides is that this system is not user-friendly and add-on packages have additional costs, causing at least some training on this software to be necessary.
GOOGLE SHEETS:
Let’s be honest, we all love free software! Sheets has the ability to have multiple users not only view the same data in real time, but also allows the user to view spreadsheet history by user and time. This allows any data calculations, visualizations, or analysis to update as new data is input into the spreadsheet and all edits to be backtracked. Google Workspace also permits linking of graphs to Google Docs, automatically updating reports with the most recent data.
PAPER RECORDS:
There have been multiple studies linking writing to enhanced memory, which will allow team members to more easily recognize patterns and identify abnormalities in data. The same correlation can be found when typing data into a spreadsheet, albeit not as significant as handwriting. This subconsciously trains the team members, both writing and entering the data into the software, to recognize patterns in the raw data.
Average cook data for the mash bill 75C/21R/4M, this establishes the baseline for all individual cook data sets. The standard deviation (StdDev) is a statistical term representing the deviation of each data point in relation to the mean, which will be used for identified variation in raw data.
collected actuals are not only separated by the operational set, but also the mash bill and cook team. Each team enters the data in real time as part of an established standard working instruction (SWI) that is uniquely tailored to the specified mash bill being run through production according to the schedule. By segregating the data in this manner, we use the variances to identify outliers that can be utilized to pinpoint the exact location of the deviation and build a plan to streamline the process for the teams.
Looking at the cook data from 25E11B in Figure 2, it can immediately be noticed that the corn and rye addition rates, circled in the figure, are significantly higher than the average for this high rye mash bill. The corn addition time is half the average addition time and the rate of corn addition is twice that of the average rate for this cook of 75C/21R/4M. The same trend can be seen with the rye addition in this cook, the grain was added in less than half the time and the rate of grain addition was nearly twice the average seen in Figure 2. We learn from the variability that each team has, in this case Team 1, which allows us to constantly improve through optimization.
prevent this from occurring in the future. The variability that each team has and that is collected through data, will allow continuous improvement to occur because the measurements allow changes to be identified the process — even if the result was not planned.
Data analysis can help distilleries of all sizes increase product consistency and identify deviations in procedure.
This variability that is seen in the actuals in Figure 2 is indicative of an opportunity to improve process through data analysis. My immediate thought is to evaluate the weights, if the total weight was larger than normal with the time remaining the same or if the weight remained the same with a shorter addition time it would explain a higher rate. However, the actual weight of the grain added was within specification for the target weights of corn and rye, so that would mean the time was differentiation. Next, I would go to my grain sieve data (not shown) for a distribution comparison of this specific cook to my average to identify if there are any outliers. If the grain size was greater than the standard distribution, this would indicate that the mill was being run too fast and allowed larger pieces to pass through the pairs of rolls. The review of the grain sieve distribution will show data that is indicative of downstream effects in the fermentation, which will be addressed in a future article. This hypothesis was confirmed when the data was reviewed, a conversation with Team 1 will then be had to identify the underlying reason for the mill’s increased feed rate and learn how to update procedures to
2
Next, I see the lack of recording for the cook’s initial pH. This is against protocol, leading the laboratory to inquire with Team 1 to see if there was a reason a pH was not collected (i.e. equipment failure, unforeseen operational issues, etc.). Each discussion with the team is not to point fingers or place blame but rather the start of implementing continuous improvement practices by keeping all procedures as clear as possible. There is no such thing as over-simplification when it comes to process and procedure; the clearer the instructions, the crisper the data. As shown in the short case study above, once the ‘where’ is identified you can start to dive into the ‘why’, finding the root cause of the deviation. This part of the data’s lifecycle is a favorite because it encourages critical thinking. Answering the “why” rarely follows a uniform path; it requires navigating a range of potential approaches and perspectives. You should always encourage exploration, from structured experiments to scouring peer-reviewed resources. All facilities and procedures require a deep dive into the explanation behind the identified inconsistencies in the data. Don’t hesitate to look beyond internal resources. The spirits industry is uniquely collaborative, with a strong culture of cross-company knowledge sharing and support. Consider going one step further by seeking talent with STEM backgrounds from outside the spirits industry — diverse perspectives can drive innovation and foster creative problem-solving in a field rooted in tradition.
Pete Barger is the founder and CEO of Southern Distilling Company. A seasoned executive with a background in engineering, manufacturing, and business development, he brings decades of experience leading high-performing teams across startups and turnarounds.
Samantha Harpst is the Project Manager for contract distilling, barrel sourcing, and co-packaging sales at Southern Distilling Company. With a biochemistry degree from Clemson University, she blends scientific expertise with a passion for operational excellence and industry innovation.
Raw data collected from an individual cook, 25E11B, which will be compared against the benchmark established for this mash bill, 75C/21R/4M, for an in-depth analysis and ultimately the identification of outliers.
FIGURE
Hard Truth Distilling Co.
The art of growing where you’re planted
Written by MAGGIE KIMBERL
Photography by SETH TEETERS
Grow where you’re planted” is the saying that comes to mind with Hard Truth Distilling Co. in Nashville, Indiana. The business went through several iterations before becoming one of the top destinations in Brown County, Indiana, nicknamed “The Little Smokies” for its resemblance to the Great Smoky Mountains. The community is home to artists and
vacationers from around the country, which means not only a tight-knit community, but also some 2.5 million visitors to the area each year, many of whom find their way to Hard Truth Distillery.
“What we've built here with the experiences and the place and why we chose this doesn't have anything to do with us looking at the market and thinking this will create success from a business standpoint,” Hard Truth master distiller and partner Bryan Smith said. “It's where we live. It's where we raise our kids. It's the people that are here. And really, it all grew out of just wanting to celebrate this place and make great whiskey here.
“None of us came from the industry,” Smith continued, “so it wasn't like one of us popped off from Beam Suntory with a pile of money or got investors involved and had a real focused idea. Everything that has been built here has been built brick by brick.” Ed Ryan was originally from Bloomington
just down the road and had worked in a career as a chemist and a business leader for a couple of industries and was working in New York City for a number of years, and decided to move back to raise his children in Brown County. Jeff McCabe worked for American Express and after 9/11, luckily, none of his employees lost their lives, but their offices were in one of the towers. And so he had been very successful, and he basically decided at that moment to exit and look at the next chapter of his life a little bit sooner than he thought that he would. And so he moved his family to Brown County. “So the story really starts with the two of those guys meeting each other here in Little Nashville and starting up a friendship.”
Ryan and McCabe first got into craft beer together, eventually opening a series of brewpubs and restaurants in the area starting in 2009. Then in 2015 a state law changed in Indiana allowing anyone operating an existing brewery or winery to access an artisan distiller permit, which included the ability to sell up to 10,000 gallons of spirits directly to consumers. Smith joined the team to open up the distilling part of the business.
“Everything that has been built here has been built brick by brick.”
BRYAN SMITH Master distiller
and partner
“Adding that piece in there to help with cash flow by being able to sell direct-to-consumer was really a huge thing, and it's pretty unusual, as you know, in the industry, to be able to do that,” Smith said. “So Ed and Jeff and Tim O’Brien, and at that time, Jim Dunbar was part of the partnership group, they jumped through the hoops, and I went through the process and got the permit going.” At that time, the brewery had moved into a larger location, and the pilot brew system was in downtown Little Nashville above their Big Woods pizza restaurant. It's a four-barrel brew system, and so they added a couple stills and utilized the hot end of the system for the distilling operation. “That's what I love about the authenticity of our story is essentially they had a vision for creating an experience for consumers in Indiana through beer and food. And then they really wanted to add spirits into that because of the change in the law.”
This organic growth has continued throughout the group’s journey. Today, Hard
“Making whiskey is really this beautiful combination of art, flavor, and science.”
Truth Distillery is a multi-faceted campus that includes a restaurant, a live music venue, a “moonshining experience” in which consumers can learn distilling on primitive equipment, a side-by-side cocktail tour, a tiki island, and even an onsite Airbnb — one of a few places in the nation where guests can sleep on a distillery’s grounds.
Smith, who learned to cook from family members including his grandmother and his Japanese aunt, entered the business with an approach focused on flavor. He’d brewed beer in college and studied recreational therapy, which he says is heavy on biology and chemistry, so distilling seemed like the logical next step.
“I love the predictability of science,” Smith says. “I love the experimentation and being
BRYAN SMITH
able to track all that. So as you know, making whiskey is really this beautiful combination of art, flavor, and science. Growing up, my dad and his buddies always made farmer wine down in Evansville where I'm from. So I grew up understanding fermentation and really liking fermentation as well in the community that's built around making beer and wine.”
Smith started with the group in 2015, and by fall of 2016 they had released several unaged spirits and were making whiskey. Ryan and McCabe began discussing a 325-acre property in Brown County with Smith, as well as a vision for a Disneyland of food and spirits that the group would develop on that land. While Smith was focused on creating a high-quality whiskey for the brand, his partners had a vision for something bigger.
“From the start, we are, in our DNA, an experiential company,” Smith says. “The whiskey was going to play, obviously, the most integral role in it, and I was really comfortable that I would be able to get us there and create something special because the way I approach things is, cooking is all about inputs. My grandfather had a victory garden, so my grandmother had the most incredible ingredients to utilize for cooking, and she just didn't screw them up, right? So that was my approach to this was understanding the science, really being comfortable with the practical knowledge of it. I spent a lot of time chatting with and visiting with and learning from Dr. Pat Heist and Shane Baker at Wilderness Trail. Meanwhile, my partners were really the ones that were building this vision for an
experience. So while I'm very humble and happy with how successful our whiskey has become and the quality of our liquid, really, the vision for this property was my partners’.”
That vision — to create a place where locals and tourists alike could come and spend the whole day with plenty of activities for the whole family — featured numerous ideas for what the property could look like, including visions of a lodge, tiny homes, tree houses, and more, before they settled on an Airbnb.
“We've never had investors, so we had to rely on cash flow,” Smith says. “It became apparent that all these other things are great, but your whiskey has to be spectacular. It's a crowded world in American whiskey right now. So they put it on pause. And for the first three or four years of our operation, it was:
“From the start, we are, in our DNA, an experiential company.”
BRYAN SMITH
Let's focus on allocating all of our resources to making sure that we've got the best equipment, best process, and best ingredients for making whiskey. We'll figure out the rest later.”
“And then we evolved,” he continued. “We started to have a lot of industry partners, potential sales partners…VIPs, different people that we wanted to come and stay at the distillery from out of town. And unfortunately or fortunately, Brown County is a very popular place, so there were times when we would have a legend of the industry coming to check us out, and we didn't have any place for them to stay. The initial thought was, let's build a rustic but bougie luxury cabin, and we will block it off certain periods of time of the year for VIPs, but then potentially rent it out for Airbnb. So the initial conceit was really to have a place for us to host VIP guests. And now it's pretty much booked out almost all the time.”
The Hard Truth property includes hiking trails and is permitted for drinking on the
Master distiller Bryan Smith and barrel manager Chris Moore in a rickhouse at Hard Truth.
entire property, so guests can get a cocktail at the visitor center and take it on a hike or go sit and listen to music.
“We also got permission to run a still outside of the building,” says Smith. “So we have a make-your-own whiskey experience where we've built this little rustic cabin out on the edge of one of our lakes. The side-by-sides were a no-brainer because they're fun to run around out here. Our motto is: ‘We drive, you drink.’ We've got Beer Bluff that has these adult swings that kind of are perched over like a big vista overlook. We have a pontoon tiki boat for our toasted coconut rum experience where a guide takes you out on one of our lakes and shakes tiki cocktails. And then there's a gin bar out in the middle of the woods. We have over 400,000 people visit our property every year.”
The secret to this success, Smith says, is that they didn’t start with a historical paradigm like Kentucky bourbon that they would need to copy in order to be successful. Rather, they were able to throw everything at the wall
to see what would stick.
“So we're creating new fans for our brand for whiskey lovers and non-whiskey lovers,” says Smith.
“We want to grow it,” Smith says. “Each experience that we create is not just a, ‘Hey, this is going to be a marketing expense to sell more whiskey out in the market.’ We want it
to stand on its own as a business and create market awareness to help sell the hotels out in the market.”
Hard Truth Distilling Co. is located in Nashville, Indiana. For more info visit www.hardtruth.com or call (812) 720-4840.
PHOTO
SECONDARY VENDORS CAN HELP DISTILLERIES ESTABLISH A SUSTAINABILITY STRATEGY
A WORLD OF DIFFERENCE
Practicing sustainability is a noble goal for a distillery. Putting it into practice poses challenges, especially for a fledgling brand. The legion of moving parts involved with distillery operations — labor, accounting, marketing, and even making distilled spirits on occasion — carry the potential to interfere with the ability to come out swinging with a viable sustainability plan. While a sustainable concept may be placed at the forefront during the business plan stage, it may quickly fall by the wayside as other aspects of distillery operation take priority.
Fortunately, incorporating sustainability doesn’t have to be some grandiose scheme. All it can take is utilizing vendors and other distilling-adjacent companies with well-established sustainability strategies and plans. These connections can provide distilleries with the building blocks for sustainable narratives that are legitimate and not exercises in “greenwashing.” At a time when corporate social responsibility matters to the consumer more than ever, it’s not a stretch to say linking up with sustainably focused vendors carries the potential to boost a distillery’s bottom line.
WRITTEN BY RICH MANNING
PROVIDING INFLUENCE
For a craft distillery, using a vendor or periphery service emphasizing sustainability can provide them with an opportunity to turn good intentions into actionable strategy. There are also unique opportunities for the vendors in this relationship. Oftentimes, they see new partnerships as a way to expand their ability to spread the word on the importance of eco-friendly practices.
This mutual benefit is a key driving force behind the partnerships created by Southern Distilling Company in Statesville, North Carolina. As a contract distillery, their mission is to build brands as they start. This development is not strictly designated to distillate quality. “Our story is the brand’s story too,” explained Southern Distilling’s founder and CEO Pete Barger. “Since sustainability has always been central to our ethos, it’s also
central to our brand partner’s story. How we do things is also how they do things. We’re not preaching to our clients, but we’re demonstrating its importance. When they see the importance, it then becomes their ethos.”
In Southern’s case, this shared narrative includes elements ranging from utilizing energy efficient facilities to using regenerative agricultural techniques. Partnered brands can choose to trumpet these techniques, which can be a more essential strategy to consider as the focus on sustainable practices continues to increase. “We’ve never made a huge deal of our sustainability. It’s just what we do,” Barger stated. “But, it’s certainly now more important for brands to be more vocal on the topic.”
“If we’re catching brands at their early stages, we can get a sustainable ethos ingrained in them.” IAN PEREZ BRANDARC
“Quality will always be a fundamental part of sustainability.”
THE POWER OF PARTNERSHIP
The international glassmaking and bottle design company Saverglass carries an ambitious approach to sustainability. They aim to be 100 percent carbon neutral by 2050. They’ve invested heavily in creating a hybrid furnace that runs on 80 percent electricity. They’re in talks with suppliers in Mexico to build pallets from agave substrates, thus extending the plant’s usefulness. A distillery working with this company instantly gains credibility in green circles.
“Generally, when we talk about sustainability, we make sure new clients know that it’s more than part of a sales pitch. It’s in our DNA,” said Paul Rosado Rival, Saverglass’ Corporate Relations Manager. “This becomes evident when you start looking at Saverglass’ history.”
The company’s history stretches back to 1980, so they’ve seen a thing or two regarding the impact a business can have on the environment. This allows them to act like a muse to fledgling craft brands entering the market, funneling the wisdom they’ve accumulated through four-plus decades of existence to make eco-friendly bottling and branding decisions. In some cases, this can mean laying an initial foundation and building up from there.
“We try to be true partners within the craft sector,” said Mike Niehaus, Midwest sales director for Saverglass.
“Some distilleries don’t have any sustainability initiatives in place when they come to us, so we can help them with a roadmap. Some clients are aware of some sustainability practices, and others aren’t. It’s our job to make them aware of what’s out there.”
At the same time, when Saverglass works with a new distillery on bottle design, they give their clients some leeway to make their own decisions. This wiggle room creates occasional deviations
from Saverglass’ recommended practices. “We discourage our clients from using outpacks in their bottle design,” Neihaus said. “However, some still do.”
BUILDING FROM THE GROUND UP
All it takes is one vendor for a craft distiller to start developing a sustainability strategy. This development doesn’t need to necessarily stem from a single element. Case in point: BrandArc, a new brand development program hatched by the Manhasset, New York-based importer and distributor MHW. The program focuses on helping distilleries establish pathways that guide a brand from idea to market through concepts like liquid sourcing, brand design, and supply chain management. Sustainable practices are baked into each component, from using lighter bottles to hold the juice to utilizing more fuel-efficient shipping strategies. For their European clients, this also involves enrolling them in national sustainability initiatives. These practices are front and center, and while they tend to be embraced by their clientele, it does take a little massaging now and then.
“Sustainability is one of the first things I talk about when meeting with a new client,” explained Ian Perez, head of BrandArc. “Once you articulate the message, demonstrate the reasons why sustainability can create brand differentiation, and show them how this can make them more profitable, you can get them interested.”
Perez also notes that new distilleries have a distinct advantage to jump into sustainability compared to established brands. “If we’re catching brands at their early stages, we can get a sustainable ethos ingrained in them,” said Perez, “It’s easier to implement sustainable equipment into a new distillery
than it is retrofitting equipment into a 150-year-old legacy brand.”
A MATTER OF QUALITY
Building partnerships with sustainability-forward vendors and programs can imbue a distillery with a positive reputation, which could initially drum up interest among consumers with an interest in supporting green-focused brands. For long-term or repeat success to occur, this reputation for doing the right thing must be accompanied by a reputation for making a good thing. While vendors may strongly focus on sustainability, the drive to deliver consistently great products or services remains a core value. “Beverages practicing sustainability have to be the same quality as those not practicing sustainability, if not better,” Perez stated. “They should never be sustainable just for the sake of being sustainable.”
This mindset can sometimes compel vendors to hold the results of their sustainable practices to higher standards. “We treat the grains we grow as if they’re from an outside organization,” Barger said. “We’ve refused our own grain trucks after we’ve analyzed the grain. Just because we produce it, we can’t assume it’s great.”
This tendency to correlate sustainability with quality further highlights how choosing the right vendors to move a distillery’s brand and products forward can be a smart decision. It can also be a stable decision. As vendors come up with new sustainable solutions to combat evolving environmental concerns, it’s comforting to know their commitment to quality will remain unwavering.
“Quality will always be a fundamental part of sustainability,” said Rosado Rival. “That is true even though at the end of the day, we’re just trying to do good for the environment.”
CARVING OUT a NICHE at LEIPER’S FORK
Building a distillery from the ground up is hard enough. It’s incredibly capital-intensive, and if your focus is whiskey, you won’t see returns for years. Survival is a matter of cranking out as much product as you can with the capital you have available to you, often starting with unaged spirits, or at least minimally aged spirits, to pay the bills. But what happens when you start a distillery in a place that never had a distillery before and the local government caps your annual production? That’s exactly what happened at Tennessee’s
Leiper’s Fork Distillery, and they are thriving despite the limitations being imposed on them.
“I’ve always had a fascination with distilling from a cultural heritage standpoint, going back to when I was really a teenager,” Leiper’s Fork founder Lee Kennedy said. “It’s always captured my imagination that the folks from Scotland and Ireland came over to the New World across the Atlantic Ocean, a lot of times with stills and the know-how of how to distill, and came to Virginia and then over
into Kentucky or North Carolina over into Tennessee, and they brought that know-how with them that was woven into their cultural fabric. What also captured my imagination was what we call the backwoods chemistry of distilling. In the Middle Ages, spirits production was in the realm of magic. Tennessee has had a rich heritage with distilling, but we’ve had a pretty complicated relationship with whiskey production.”
Kennedy explained that in the 1896 census, there were 322 distilleries in Tennessee alone, but that by 1910 the state had enacted its own Prohibition, 11 years before the rest of the nation. The state then kept that going until 1937, so while the rest of the country dealt with national Prohibition for 13 years, Tennessee dealt with it for 27. This gave rise to a deeply-rooted bootlegging and moonshining culture within the state, and by the time the state Prohibition was repealed, it only allowed for distilling in Moore County, Lincoln County, and Coffee County. The other 92 counties did not allow distilling again until 2009. Written
“At that point, I really started looking at the distillery as a business on paper and penciling everything out,” Kennedy said. “The margins are great in the business, but still, there were some leftover sentiments from Prohibition, really, in each individual county. We actually had to create a law in Williamson County. I had my first meeting with Williamson County in January of 2012, and we went through a three-year period where we had to change our county law to allow us to operate. We had four public hearings to do that. We got our building permit in January of 2015, and we filled our first barrel in April of 2016.”
Kennedy said he’s made bourbon, Tennessee whiskey, and rye whiskey, and almost all of it offered as bottled-in-bond, which he said bourbon historian Michael Veach has been a major proponent of.
“It helps us tell the story that we make that whiskey from grain to glass,” Kennedy said. “We touch every aspect of the process. We use it as a statement of provenance, not just as a statement of quality. We’re letting educated consumers know that we made that whiskey from start to finish.”
Despite Kennedy’s efforts to tie into Tennessee’s distilling history, and by extension America’s distillery history with this project, the county was still wary.
“We’ve always built the business as a traditional distributed brand, but knowing that whatever we did on-site would be gravy. And it’s actually turned out to be a lot of gravy!”
— LEE KENNEDY Founder, Leiper’s Fork Distillery
“Because of some unknowns within the industry and some of those leftover sentiments, the county restricted me in a lot of ways on what we can do,” Kennedy recalled. “One of those things was they kept us at 25,000 gallons of whiskey production per year because controlling our gallonage output was a way to control the size of our distillery.”
Kennedy said his goal has always been to be a regional brand that is focused on authenticity, so the constraints have not been a terrible burden.
“It’s kind of like them walking in the shallow end of a pool versus jumping in the deep end,” he said. “We’re all family-owned here. We don’t have corporate money behind us, which could be a blessing and a curse. So we took those numbers and said, ‘Hey, can we still run a viable business from a revenue standpoint based on roughly 500 barrels of production per year?’ And the answer to that question as we continued to build the financial model was yes. Because we’re family-owned and streamlined in the way we’re capitalized, it allows us to have a successful business producing only 500 barrels per year.”
Despite the restrictions imposed, Kennedy said he didn’t initially consider supplementing the business with things like on-site events and tourism.
“When we were designing the distillery on paper and really the financial model of it, we didn’t factor in any revenue streams from on-site tourism, from on-site bottle sales, and the interests that we would have on-site at the distillery,” Kennedy said. “The reason we did that is we wanted to be in the whiskey business, first and foremost, not in the tourism
business. We’ve always built the business as a traditional distributed brand, but knowing that whatever we did on-site would be gravy. And it’s actually turned out to be a lot of gravy! We got in the black as a distillery in February of 2020, just in time for the pandemic. And we’ve been able to stay there really because of tourism. As we’re maturing our whiskey, as we’re growing our brand footprint, the tourism side of the business has been overwhelming, to be honest with you, in a good way. We hoped to see 10,000 visitors in our third year of operation, which would have been 2019. And we hit that easily in our first year.”
Kennedy said they see about 25,000 visitors annually, and a big portion of that traffic is due to on-site bottle sales, for which they get to keep all of that revenue instead of splitting margin with distributors, a crucial source of income for such a small brand.
They also do a lot of events at the distillery, including cigar nights, whiskey dinners, and consumer education.
“We have a little bit of porch picking on the weekends,” Kennedy says. “We do run a cocktail bar at the distillery, so it’s a very festive atmosphere when people come out. And at the same time, we’re promoting our brand and what we’re doing here at the distillery. We also do things like songwriter nights — we call them stillhouse sessions. We sit here 45 minutes south of Nashville, and we’re surrounded by some of the best musicians in the world, so we take advantage of that by having some of these songwriters and artists play in our stillhouse and associating our brand with music in a good way.”
Not to be overshadowed by Nashville, Kennedy points out that nearby Franklin is also a hotbed for tourism that sees upwards of 1.9 million visitors a year because of a Civil War battlefield and other notable attractions. Soon, Leiper’s Fork will be right in the center of all the action.
“We are opening a satellite location of our distillery that’s going to be a micro-experimental distillery in downtown Franklin,” Kennedy says. “We’re getting ready to open at the end of April or beginning of May 2025. We’ll have an experimental still in the back to do alternative grain bills and some fruit brandies and probably some distilled meads and things like that with a cocktail bar component up front serving really well-done small plates. And then we’ll also have a Tennessee whiskey museum wall where we’re telling the history of Tennessee distilling going back to its earliest roots up through what’s happening with the renaissance of Tennessee distilling. As we’re seeing the revenue streams at our distillery, not anticipating at the beginning how substantial they were going to be, it’s a way to take those revenue streams that are successful from a tourism standpoint at our mothership location and plant those in downtown Franklin and act as an embassy in downtown Franklin for our mothership location.”
Despite significant challenges, Leiper’s Fork is quickly becoming known as one of the best brands in modern Tennessee distilling history.
Leiper’s Fork Distillery is located in Franklin, Tennessee. For more information visit www.leipersforkdistillery.com or call (615) 465-6456.
DOMESTICALLY DISTILLED.
COMPETITIVELY
PRICED.
High-quality, American-made OTS.
Reliable, cost-competitive alternative to imports.
For inquires, please visit oneillwine.com
OTS Blending Wine, Ready To Ship
Neutral & Aged Grape Spirits
Apple Brandy, Gin, Dessert Wines
Custom Distillation Services
Premium Grape Spirits.
reSeArCH & DeVeLOPmeNT IN THE CrAFT DISTILLING INDuSTrY
THYPOTHeSIS: DEFINING A TESTABLE QUESTION
Once an observation has been made, the next step is to develop a hypothesis, which is a tentative explanation or prediction that can be tested through experimentation. The key word here is “tentative” because this may be something you go back to multiple times within the method. In the case of seasonal batch variations, a plausible hypothesis could be that changes in ambient temperature affect condenser performance, which subsequently alters the cut points of distillate fractions.
APPLYING THE SCIENTIFIC METHOD
WRITTEN BY NICOLE SHRINER, PH.D.
he scientific method offers more than just a research framework — it provides a mindset for exploration and refinement. In an industry that balances tradition with innovation, applying this structured approach enables distillers to ask better questions, make more informed decisions, and develop superior products.
THe SCIeNTIFIC meTHOD: A FRAMEWORK FOR INNOVATION
The scientific method is a research and development tool used throughout all industries. At its core, this method involves a linear process: observation, hypothesis formulation, experimentation, data analysis, and conclusion. As a distillery owner or operator, you may already be doing these steps without recognizing the actual process. In the craft distillation sector, this process enables producers to systematically address challenges,
refine processes, and develop new products with confidence using scientific evidence rather than intuition or tradition alone.
OBSerVATION: IDENTIFYING A PROBLEM OR OPPORTUNITY
In the distillery, observation often begins with a question or problem. For example, a batch of whiskey might contain a higher level of fusel alcohols, or a gin’s botanical profile may lack product consistency across batches. These observations can also stem
from strategic opportunities, such as developing a new type of spirit that highlights local grains or botanicals. Recognizing deviations, emerging trends, or potential areas for enhancement is the foundation of effective research and development.
For example, a common observation might be variations in heads and tails cut points between seasonal batches. While ambient temperature might initially seem like a minor factor, repeated inconsistencies often warrant further investigation. Such observations serve as ideal entry points into applying the scientific method.
Hypotheses in craft distilling may pertain to milling practices, mash kinetics, yeast and fermentation specs, still geometry and cooling water effects on reflux ratios, or the impact of barrel char levels, barre location, and aging environment on flavor extraction. The key is to articulate the hypothesis clearly and ensure it aligns with measurable outcomes.
eXPerImeNTATION: CONTROLLED TESTING IN A COMPLEX ENVIRONMENT
Designing controlled, economically viable experiments in a commercial setting can be challenging. Craft distilleries often operate in small batches, and adjusting production variables without risking product quality requires careful planning and a little creativity.
THE SCIENTIFIC METHOD OFFERS MORE THAN JUST A RESEARCH FRAMEWORK — IT PROVIDES A MINDSET FOR EXPLORATION AND REFINEMENT.
A well-designed experiment isolates one variable at a time. For example, if investigating condenser performance, the cooling water inlet temperature might be varied while maintaining consistent feed composition, still charge volume, and heating rate. Data collection could include distillate temperature, condensation rate, and compositional analysis of collected fractions using instruments such as gas chromatography-mass spectrometry (GC-MS). Not many, if any, craft spirit producers have GC’s, but labs around the country can run sample analyses for a fee. If that is not an option, using your sensory panel in-house may help discern the differences you are looking for. Pairing sensory outcomes with analytical metrics like alcohol content, methanol concentration, or ester profiles strengthens the correlation between objective data and sensory characteristics.
The creativity part may stem from using nontraditional methods of measurement. For example, not all flows in the distillery are measured with a flow meter. However, a valve upstream controls the flow, so perhaps the flow is measured not exactly by flow rate but by how open or closed the valve is. Finding ways to measure variables is key to the scientific process.
Lastly, the creation of a datasheet is by far the best way to ensure that all the required data is collected and at the right time.
A proper datasheet will also enable another person to perform the experiment at a later date. Datasheets can always be refined as needed, but starting somewhere is essential. PS: Always include units!
DATA ANALYSIS: EXTRACTING
MEANING FROM THE NUMBERS
Data analysis enables meaningful conclusions to be drawn from experimentation. Statistical tools such as ANOVA (Analysis of Variance), regression analysis, or even machine learning algorithms can reveal trends and determine whether observed differences are statistically significant. Continuing the condenser example, a clear correlation between higher ambient temperatures and delayed onset of the heads fraction could guide seasonal recalibration of cut protocols. Such adjustments reduce off-flavor compounds and enhance batch consistency. It is important to note that many researchers perform experimentation in duplicates or triplicates to confirm that the data is reproducible and significant.
Even basic spreadsheet tracking of fermentation rates, yields, and sensory feedback can yield actionable insights that drive quality improvements over time.
THE SCIENTIFIC METHOD TRANSFORMS INTUITION INTO INSIGHT.
CONCLuSION: INFORMING DECISIONS AND GUIDING FUTURE DEVELOPMENT
Once conclusions have been reached, the findings should be implemented through revised standard operating procedures, staff training, or batch planning strategies. Most importantly, decisions are grounded in evidence rather than speculation.
These conclusions often lead to new questions, fueling a continuous cycle of innovation and refinement. For instance, resolving an issue with condenser performance may raise new inquiries about energy consumption or scaling potential, leading to further experimentation and improvement.
BrOADer
APPLICATIONS IN CrAFT
DISTILLING
Beyond troubleshooting, the scientific method plays a crucial role in product innovation. When developing new gin botanicals or whiskey infusions, the
method provides a structured process to define sensory targets, hypothesize ingredient ratios, perform pilot tests, and evaluate feedback.
Fermentation is another area ripe for methodical investigation. With an expanding range of yeast strains designed for flavor complexity, systematic comparisons across variables such as pitch rate, temperature, and nutrient profiles can optimize performance.
Even aging — often considered more art than science — can benefit from structured experimentation. Hypotheses related to barrel size, wood origin, environmental conditions, and secondary treatments (e.g., wine finishes or toasted staves) can be tested through controlled trials. The resulting data not only guide production but also support authentic marketing narratives grounded in craft and care. From fermentation optimization and new product development to refining distillation parameters and improving aging protocols, the scientific method transforms intuition into insight. In doing so, it strengthens both the technical and creative dimensions of craft distilling — laying the foundation for promoting quality and innovation.
Dr. Nicole Shriner is an academic specialist at Michigan State University. She holds a BS and PhD in Chemical Engineering from Michigan State University and a Master Brewer Diploma from Siebel Institute of Technology and Doemen’s Academy in Munich, Germany. She teaches all courses in the Fermented Beverage minor which include brewing, distilling and winemaking. She manages the fermented beverage analysis lab at Michigan State through which she completes analyses and facilitates research with industry members from raw materials to final fermented beverage product. Nicole has compiled a total of 11 years of experience working at, or with, distilleries, breweries and wineries.
CARIBBEAN BLUE
How a partnership to save Grand Cayman’s endangered blue iguanas led to an award-winning gin
WRITTEN BY CARRIE DOW
Distiller Moises Sevilla had already created a few successful spirits for another company before starting his own distillery in George Town, Grand Cayman. Then he got a phone call.
“They called me in for a meeting and I thought ‘this is awesome,’” he said with an impish grin as he set up for a tasting in his tiny distillery, Grand Cayman Distillery. “They said, ‘We want to build a product together.’”
He was describing a meeting with the National Trust of the Cayman Islands, a nonprofit, non-governmental organization that protects the islands’ natural resources and historical spaces. One of the organization’s flagship programs is the Blue Iguana Conservation center, a facility created to save the island’s iconic and critically endangered blue iguanas, the only blue iguanas in the world. The meeting would change the course of his nascent distillery.
“I was hell-bent on doing a rum because I was already developing a gin,” he explained. “They were like, ‘No, we want a gin.’” When he asked why, they handed him a giant three-ring binder, each page filled with detailed information about all the island botanicals blue iguanas eat. “I started getting really excited,” he said, his grin getting wider.
“I may not have gone where I intended to go, but I think I have ended up where I needed to be.”
—
Arthur Dent
HITCHHIKER’S
GUIDE TO THE GALAXY
Sevilla was born in New Jersey, but his mother moved to Grand Cayman when he was a kid. He attended Seminole State College of Florida and returned to Grand Cayman with a business degree. After chatting for a while, you can pick up a hint of a Jersey accent, especially when he gets enthusiastic about something, like discussing his spirits.
He had worked with several Grand Cayman companies over the years doing retail, marketing, and product creation; however, his last employer was a distillery. A distilling hobbyist, he convinced his boss to let him create a few new products on a small unused R&D still. One of those products was a pink gin that the company used to raise money for a local breast cancer organization. He said the gin raised $20,000 in two years and received coverage from local news outlets. That’s how the National Trust found him.
Sevilla said he started his own distillery because he knew his former employer wouldn’t allow him to make the spirits he wanted to make in the ways he wanted to make them. He had already created a gin called Zeus when the trust approached. The trust also runs the island’s Queen Elizabeth II Botanical Gardens, where the conservation program is located. They gave Sevilla access to the garden’s plants for three months.
PHOTO BY MARO PRODUCTIONS
“They let me go in there and cut down whatever I wanted and run single distillates,” he stated. “Now, I had a guy with me — I couldn’t go crazy — but I was cutting and doing single distillates to hone in on flavor.” All that work paid off in defining the new gin’s flavor profile, but he knew the gardens couldn’t scale the plants to the degree necessary to make a consistent gin. Therefore, he says, even though the flavors of Blue Iguana Gin are distinctly Caymanian, the ingredients are not.
“I get some of the sea grape and hibiscus (from the island),” he explained. “I knew that eventually we’d be scaling up and many of these botanicals are seasonal. Why shoot myself in the foot?” Instead, when he found a Caymanian botanical he liked, he searched for a flavor match. It wasn’t easy.
“I did a ton of research,” he began. “For example, Caribbean mint. Caribbean mint only grows in Costa Rica, Jamaica, and here. But I learned it’s a cousin of an African form that made its way through. So, I found Egyptian mint, and since Egyptian mint and Caribbean mint are related, they had the same flavor.” He then flavor-matched the gin’s eight other botanicals and imported juniper from Italy.
Things changed even more for Sevilla’s distillery shortly after it officially opened. “We made our first drop of ethanol February 2023,” he said, that sheepish grin returning as he poured samples. “Then we won the gold medal at the New York competition in April.” Blue Iguana Gin won a bronze medal and Zeus Gin won gold at the New York International Spirits Competition (NYISC), making his gins the talk of the island.
“All the hard work that led up to it made it all worth it,” he said. As if that weren’t enough, Grand Cayman Distillery repeated the feat the following year with Zeus Gin named as one of NYISC’s Top 20 Gins of 2024. His two new products — Three Islands Coffee Liqueur and Three Islands Triple Sec — won silver and bronze, respectively.
The two gins couldn’t be more different, however. “With Blue Iguana, the stars of the show are hibiscus, lemongrass, Caribbean mint, and sea grape. All very present.” Sea grape, which is in the rhubarb family, not only gives the gin some tartness, but it’s also a favorite food of the blue iguana.
Zeus goes in another direction with fresh cucumber and orange peels, and Sevilla peels 40 pounds of fresh cucumber for each batch himself. “Of course, juniper is present because it has to be. But if you open it up with water,” he said, offering up a cup of H2O, “you can really taste that sweet cucumber note. It really pops.”
He employs both maceration and vapor infusion when making his gins, that way he gets the specific flavors he’s looking for out of each botanical. In Zeus, for example, he prefers the sweet, orange marmalade flavor that comes from macerating orange peels versus the crisp zesty flavor that comes from the vapor.
The name Zeus honors his Greek heritage. “My family is Greek on my father’s side. As I was working on it, I tried to pick botanicals from different regions because I imagine the king of the gods set up atop the clouds looking down over the four corners of the earth.” He’s about to release a third gin building upon the Greek gods theme: Athena.
PHOTO BY MOISES SEVILLA
PHOTO BY CARRIE DOW
“She’s the goddess of war, right? So, I’m using a combination of gunpowder tea, which is green tea, for her fierce battles and rose petals for her elegance. I think I’m going to incorporate butterfly pea flower as well, because it does grow naturally here on the Cayman Islands.” And while it isn’t an ingredient in Blue Iguana Gin, he had the plant drawn on the product’s label because it’s another blue iguana favorite.
“A straight line is said to have been cut in extreme and mean ratio when, as the whole line is to the greater segment, so is the greater to the lesser.”
— Euclid ELEMENTS, 300BC
Sevilla admits to being a fantasy book nerd, and it shows up the distillery in fun and inventive ways. His 200 L still is named Daenerys, Mother of Dragons, from the George R.R. Martin series A Song of Ice and Fire (not the TV series the books spawned) and features a dragon’s head carved into the spout. The ABV of both his gins is 42 percent because his favorite book series from college was The Hitchhiker’s Guide to the Galaxy. On his next product he’s going to hide the Fibonacci Sequence on the label. “We’re not going to tell anybody,” he said with his boyish grin returning. “We’re going to wait to see if anyone figures it out.” At only 2 years old, Grand Cayman Distillery already produces 22,000 bottles a year with not a single bottle exported out of Grand Cayman — yet. “The original idea was to have the biggest facility here,” he began. Unfortunately, a major investor passed away before the distillery was built, so Sevilla had to completely rethink the scale of his business. “The original vision was to be able to distribute in North America and other regions. We’ll get there. It will just take a bit longer.” He adds that his Three Islands Triple Sec has been accepted by the TTB and will be available stateside as soon as his labels arrive.
While finishing up the tasting, Sevilla said he’s thrilled to help save the blue iguanas because they are such an important island symbol.
“Originally there were 30 to 40 thousand of them when people first arrived here. They’ve been decimated to less than a thousand.” He says the Blue Iguana Conservation breeding program has beefed up their numbers to around 1,900, but the creatures are still critically endangered. And since iguanas only live in protected areas, the only place people can see them in their stunning cerulean and turquoise hues is at the botanical gardens.
“What these guys are doing, these efforts are amazing,” he said of the conservation program. “If you haven’t visited the gardens, I highly recommend it.”
Grand Cayman Distillery is located in George Town, Cayman Islands. Visit www.grandcaymandistillery.com for more information
The GREAT UNKNOWN
How Is the Spirits Industry Rolling with the Shifting Threat of Tariffs?
There are several reasons why tariffs hurt the distilling industry. Tariffs artificially inflate prices in foreign markets, making it tougher to reach overseas consumers. They make it tougher for newer brands to make international inroads. They can potentially cause craft brands to get buried deeper in brand portfolios that may find themselves needing to lean on familiar brands more.
The current batch of tariffs and their on-again, off-again nature adds a new layer of frustration into the mix. Since President Donald Trump took office in January, his penchant for treating tariffs like a stocks-shifting yo-yo has caused instability that’s made it tricky to plan for the future. As we burrow further into the first year of the current presidency, a few questions pop up: Will he continue to blink when other countries retaliate? Is this what we have in store for the next several years? Is there any hope that he’ll leave distilled spirits out of his game of economic chicken? It seems fair to say that there are no right or wrong answers to these inquiries. The responses tend to depend on perspective.
The FORMAL ELEMENT
The spirits field (and the alcoholic beverage field as a whole) is a slice of the larger pie of industries impacted by Trump’s tariffs. Its laws and regulations demand that it’s viewed in isolation, particularly since these transcend domestic borders — you can’t produce tequila in the United States, for example. This provides advocacy organizations with the foundation needed to effectively push back against the proposed tariffs in their current form.
“Rest assured, we are doing everything we can to untangle our industry from the tariffs,” explained Chris Swonger, president
and CEO of the Distilled Spirits Council (DISCUS). “Our job is to protect market access for the American spirits market, which includes larger and craft brands. Doing so allows us to continue to tell the great American success story that is the spirits industry.”
Swonger’s efforts to push the industry’s narrative forward with minimal tariff interference takes on many forms, from working with key organizational partners like the European Union and Spirits Canada to promote fair trade initiatives to encouraging industry involvement in the legislative process through DISCUS’ sister organization Spirits United. During the 2025 DISCUS convention in Washington, D.C. last March, the organization led industry professionals in attendance to the halls of Congress to meet with Congressional
ornamen t ornamen t amenorn t
“ Our job is to protect market access for the American spirits market, which includes larger and craft brands. Doing so allows us to continue to tell the great American success story that is the spirits industry.”
— CHRIS SWONGER, president and CEO of the Distilled Spirits Council
“ A brand that focuses on relationships and doesn’t put profits above this mission will be kept from going economically overboard.”
— JOE BROOKE, trade advocacy manager at Brown-Forman
lobbyists and tell their side of the success story directly. These in-person sessions helped reinforce the human impact of these tariffs — they don’t just impact bottles on shelves, but they also impact people and their livelihood, from the distillers making the juice to the bar, restaurant, and bottle shop owners who may face steep drops in the profitability needed to keep their doors open.
These various forms of advocacy are important for DISCUS to continue lobbying for isolation from the tariffs. Swonger also sees these efforts as a key piece to an even larger puzzle. “Advocacy’s inherent in DISCUS’ DNA, but we also really want to galvanize the industry and support their collective efforts,” he said. “Seeing the industry galvanized and supporting each other on the front lines in these uncertain times also ties into our ongoing efforts to modernize the industry as we also protect what’s great about the industry.”
The BOOTS on the GROUND
Trump’s tariff shell game is already a source of industry frustration because of its short-term ramifications. Popular bottles have disappeared on shelves outside the U.S. Reliable distribution orders went poof within days of the initial tariff announcements. Trade-based animosity between Canada and the U.S. — a formerly unthinkable concept — occurred.
These episodes fold into what the Trump administration acknowledges as short-term pain for long-term gain. The beverage industry doesn’t see it this way. “The tariffs demonstrate a clumsy viewpoint by the current administration,” explained Joe Brooke, trade advocacy manager for the southwest region at Brown-Forman. “They’re not looking at the long view. They say that tariffs will boost American products. However, it never occurred to them how big a brand like Jack Daniel’s is in the international market.” While the tariffs have done damage within
the industry, the impact hasn’t necessarily been equal. “Brands that have always led with their checkbook first are now having to deal with lighter, smaller checks,” said Brooke. “A brand that focuses on relationships and doesn’t put profits above this mission will be kept from going economically overboard.”
This variance can represent one side of a double-edged sword in the craft spirits sector, particularly for brands trying to grow beyond their backyard. “We’re lucky because our tequila has backing from the local bar community and a loyal consumer base, so we’re able to communicate what’s going on daily to our thousands of customers,” explained Gareth Moore, managing partner of the San Diego-based wholesale alcoholic beverage group True Proof Collective and western regional manager of Real del Valle tequila. “The bad thing about this is that we’re only talking about thousands of customers, so the tariffs aren’t good for growth.”
An UNCLEAR FUTURE
The Trump administration's threat of tariffs hurt the distilling industry. However, their steady stream of tariff delays and adjustments has compelled some people to start looking at the proposed tariffs as primarily saber-rattling from a long-term point of view, causing a slight sense of malaise to creep in. “The fear is becoming less, since it’s looking more like a threat with no backing,” Moore stated. “But if they do happen within the next five years, it will just be another thing that we’ll have to deal with.”
This matter of dealing doesn’t always mean a hit to the consumer. Both Brooke and Moore work with brands structurally designed to absorb the brunt of the tariffs so profit margins shrink before market price tags rise. The tariffs may also trigger a weird silver lining for the nerdiest of consumers
down the road. “Consumption is already decreasing, and if tariffs cause a continuation of decreased consumption and lower depletions, suddenly you’re going to have a lot of brands sitting on so much inventory that they can’t move,” said Brooke. “This could mean in a few years, you may see brands releasing more exquisite, older aged stuff.”
Of course, any long-term plans built around tariffs is mainly speculation at this point. Nobody knows whether or not any of Trump’s alcohol-impacting tariffs will stick around or ultimately prove to be a strange exercise in bravado. “It feels like all bark and no bite so far,” Moore noted. “Let’s just hope it remains all bark.”
Even if the bark turns into bite, some of the other potential long-term problems facing the industry may ultimately pose an even bigger issue. “The industry is changing forever, and it’s not just because of the tariffs — it’s also the decrease in consumption,” Brooke said. “Drinkers are a dying breed. If we can’t figure out this change, the industry is in trouble.”
While this may be true, the hyper-focus on tariffs these last few months demands industry attention now. The ebbs and flows of the threats may make the situation feel like a roller coaster, and the tariffs that do land carry the potential for immediate disruption. Still, the combination of industry advocacy and near-weekly fluctuation of these potential tariffs is strong enough to inspire some hope, including among those on the inside of the issue.
“I’m not usually a ‘glass half-full’ kind of person, but I remain optimistic,” Swonger said. “Despite these challenging times we’re currently in, I know we’re on the right side of the issue.”
Rich Manning is a freelance food and drink writ er based in Fountain Valley, CA. He lives about 15 minutes south of Disneyland, but he hasn’t gone there in ages — he’d rather visit the nearby breweries and distilleries instead. You can check out some of his other written hackery by visiting richmanning.pressfolios.com. He can be reached at richmanning72@gmail.com.
TIme TO GeT PAID
One area where many distilleries need help is with timely payments from wholesalers. In many states, a wholesaler is required payment by the retailer within 30 days. However, these states lack a legal mechanism for enforcing the terms on a wholesaler that does not pay a supplier within a specific period of time.
WHAT DISTILLerIeS CAN’T AFFOrD TO IGNOre
Spirits producers face many headwinds these days from inflation, tariffs, and attacks on the alcohol industry. Some things are out of one’s control and some things are not. For many distilleries, their biggest misstep may be a lack of involvement in the political process. Not being involved in policy issues can create dire consequences that could result in some distillers being put out of business. While there are numerous policy areas producers must focus on to keep their businesses alive and expand their market access, I will focus on a couple of areas where distilleries should make their voices heard.
I have heard horror stories from many small distilleries about not being paid for product they delivered to a wholesaler six months ago. As a distiller, with bills and employees to pay, waiting six months for necessary cash flow could have major impacts on the business’s viability. If a distillery does not have timely payment terms written in its contract with a wholesaler, they are at the mercy of the wholesaler when they decide it is time to pay.
In a perfect world, a contract would be negotiated in the beginning with specific payment terms, but we don’t live in a perfect world. Some distillers are not well-versed in legal particulars or prefer to focus on the
operations side of their business. They also may have no choice but to enter into a less-than-favorable agreement with the only wholesaler for their area.
Now that we identified the problem, what is the solution? Distilleries need to make their voices heard on this issue at the state regulatory level and with their local legislator.
I know this issue well because I am embedded in the marketplace and see what goes on every day. When I was a regulator and head of legal for the Illinois Liquor Control Commission, I never knew much about this issue because it was never brought to my attention. Much of what we knew came from industry members identifying issues for us. And believe me when I say that wholesalers let us know about even the smallest issues in detail. The distiller must let their state regulators know about this issue and how it impacts their businesses. Even if there is no law for the regulator to enforce against the wholesaler, a talkingto from state regulators can go a long way!
Additionally, distilleries must convey this message to their local legislator. Consider having local legislators come into your place of business to discuss these issues. Being on friendly terms with your legislators may have an impact on introducing laws that could help your business.
Not being involved in policy issues can create dire consequences that could result in some distillers being put out of business.
TIme TO eXPAND ACCeSS
Protecting one’s business is an important job, but distillers must also join the fight to expand market access. To do that, the spirits industry should consider demanding parity with the wine industry so they can enjoy the same benefits. Since interstate winery shipping became legal in 2005 after Granholm v. Heald, the number of wineries increased from 4,7001 to 11,500.2 The industry grew as wineries gained access to markets they never had access to before the ruling. Unfortunately, spirits producers are not afforded the same opportunity to greater market access. If you are a small outof-state producer, it is highly unlikely that an out-of-state distributor will take on your product. Without the advantage of
Don’t stay on the sidelines; join and contribute to your state guild, and don’t be afraid to partner with larger suppliers.
direct-to-consumer (DTC) shipping, a small distiller is essentially denied access to a national marketplace.
Even though the benefits to the industry are glaringly obvious — we have 20 years of wine data as evidence of the benefits — interstate DTC spirits bills are stalling.
Interestingly, an interstate DTC spirits shipping bill was defeated in Hawaii. Yes, Hawaii, a state where you can’t exactly drive across state lines to pick up product from a neighboring state distillery. If the industry is losing battles in states that would benefit the most from DTC shipping, it means the industry needs to do more.
In Hawaii the wholesalers won because they provided testimony that DTC shipping could lead to more drunk driving and make it easier for underage people to drink. Problematically, legislators believe these conclusions,
even though there is no hard evidence to verify its accuracy. With data from a collection of states that allow spirits DTC shipping, there is enough evidence to show that DTC is a safe way to deliver alcohol to a consumer over 21 years old. Furthermore, we have access to 20 years of evidence on winery shipping, where there has not been a link with increased access to minors nor an increase in drunk driving incidents.
WHAT IS THe SOLuTION?
Any time someone takes on the wholesale tier, you go up against a behemoth. But remember: There are more of us than them. Don’t stay on the sidelines; join and contribute to your state guild, and don’t be afraid to partner with larger suppliers.
While we can’t control every issue, we can make a difference and change policies that hurt our businesses and enhance the prosperity of our industry. It is in our hands and not theirs.
Sean O’Leary, the Irish Liquor Lawyer, and the founder and President of O’Leary Law and Policy Group, LLC, is a national thought leader in liquor legal matters. He has been cited over 20 times in leading publications including Wine Searcher, Forbes, Meininger, and Decanter and has become a regular speaker at national liquor industry conferences.
Mr. O’Leary attended the University of North Carolina at Chapel Hill (where he did not play on the basketball team). He received his law degree from Chicago-Kent College of Law. He lives in the Chicago suburbs with his beautiful wife Crystal and they are blessed to have an amazing baby boy named Brendan.
INSIDE THE 2025 Jim Beam Institute Conference
A FIRSTHAND ACCOUNT OF ONE OF THE YEAR’S TOP DISTILLING EVENTS
For distillers, March 2025 was the month of conferences. With three major conferences happening back to back, a determined distiller could probably have spent almost the entire month on a convention hall floor (or more likely in the airport trying to get to one).
For me, though, there was one convention I was particularly looking forward to. One that has quickly risen in the ranks to become included in my list of favorite distilling events of the year — the annual Jim Beam Institute Conference, hosted in Lexington, Kentucky each year, by the University of Kentucky.
This year’s conference was the largest iteration yet and began Monday, March 17, though many attendees arrived in town over the weekend and there were several informal meetups organized through the conference scheduling app.
Registration for the conference opened at 8 a.m. in the university’s student union, and
unlike last year there were no pre-conference workshops, so attendees were allowed to mingle and enjoy some refreshments before having to dive in headfirst. The actual conference launched at 9:30 a.m. with a keynote from local chef Ouita Michel and a panel discussion between the presidents of three major bourbon producers about the recent challenges to the whiskey industry (surprise: there’s been more than a few).
After being released for lunch in the student union dining hall, attendees had a few minutes to explore the expo hall and exhibit posters before the educational sessions began in earnest. As in previous years, the education sessions were scheduled to be roughly an hour and a half long and were made up of as many as four separate presentations, each discussing topics related to the theme of the session. Each session was tagged as being part of either the business tract, sustainability tract, or technical tract, which helped attendees to quickly determine whether the presentation in each session would be relevant to them or not.
Monday afternoon contained two blocks of education sessions divided by an hour break for refreshments and expo hall wandering — a welcome addition from last year’s conference. After the final education session, attendees were invited to a
short reception located in the expo hall for one last chance to interact with vendors.
Because there were no conference-related events planned that first evening, many ancillary organizations took the opportunity to host their own events. Personally, I attended both the Society of Spirit and Heriot-Watt Alumni meetups, which happened to be held at the same local brewery, for an enjoyable, if somewhat long evening of networking.
The second day of the conference began a little earlier than the first, with a light breakfast before education sessions commencing at 8:30 a.m. Tuesday was the real meat and potatoes of the conference, and there were six education sessions scheduled before lunch, each covering a wide range of different topics. As always, I gravitated toward the more technical talks, but there was plenty for those interested in subjects such as business or hospitality. Some highlights from the morning included a session on geosmin and strategies for reducing its danger to whiskey and a session dedicated to proper grain selection for malt whiskies. There was also a chance to explore some of the student posters in more detail, and I was impressed by the sheer number and scale of projects that the University of Kentucky has its students working on. Lunch was held again in the student union, with several groups engaged in spirited conversations about the morning sessions.
Tuesday afternoon began with sessions covering hospitality, sustainability, and maturation. Although I was tempted to attend a session titled “Novel Uses for Co-Products,” a topic that is near and dear to my heart, I instead chose to attend the maturation session, which promised a talk about a 17-year-long study of angel’s share in the Scotch whisky industry. The Scotch talk was excellent, but
Written by Reade A. Huddleston, MSc. /// Photos by the Matt Barton
I was even more impressed with another talk from the session, which was about tracking the natural ventilation of rickhouses using lasers and manmade fog (I may be adding a theater fog machine and industrial lasers to my Christmas list this year). Other highlights included a discussion of innovations in safety in warehouses and a presentation on the use of Raman spectroscopy in mash cooking operations. Like the previous day, education sessions ended at 5 p.m. and attendees were released to find dinner on their own before being invited to an informal afterparty at a local brewery, a great event for networking though it went later into the evening than I would like to admit. (It is a distilling conference after all.)
Wednesday, March 19, was the last day of the conference, and it was easy to tell by the subdued morning conversation that more than a few attendees were looking forward to a long rest in their own beds. Sessions again began at 8:30 a.m. and covered subjects such as storytelling in distilling, distillery data utilization, and more maturation. There was also a new type of session offered in which speakers presented in a Pecha Kucha format: a specialized type of presentation in which the speaker is supposed to have 20 slides with mostly pictures and speak for only 20 seconds per slide.
The goal of the Pecha Kucha methodology is to create a presentation that communicates the important material quickly while eliminating any redundant or distracting information. This new presentation format seems to have replaced previous years’ rapid-fire sections, and although I personally did not attend any of the Pecha Kucha sessions, other attendees spoke very highly of them.
Although Wednesday was the last day of the conference, there were still a considerable number of education sessions offered, and thanks to a shortened break period in the morning it seemed just as busy, if not busier than Tuesday. Indeed, by the time the last session was over I was starting to worry that I needed to make a trip back to the expo hall to steal another notebook from one of the vendors. The final keynote for the conference was held at 3 p.m. and included a talk from Todd Leopold and Noah Rothbaum on the history and tradition of the three-chamber still. Attendees were invited to a final closing reception afterwards at another nearby brewery, though many elected to head out early
and get some much-needed rest.
So, how was the Jim Beam Institute Conference 2025? I would describe it as excellent. With top-tier educational opportunities and a solid organizational structure, the Jim Beam Institute Conference has quickly grown to be one of the preeminent distilling industry conferences. True, the conference does still suffer some problems: The majority of talks focus on bourbon and large-scale distillery problems, which makes it hard to apply for smaller distillers, and the rapid-fire nature of education sessions can sometimes be overwhelming. However, these are relatively minor complaints and, in some cases, simply unavoidable.
As the conference continues to grow, I am sure that other challenges will present themselves (running out of space seems to be one problem on the horizon). Nevertheless, I have full confidence that the staff of the Beam Institute will be able to handle any issue that comes their way. As for me, I am already making plans to attend next year’s conference. I hope to see you there.
Reade A. Huddleston, MBA & MSc. in Brewing and Distilling, is the Director of Distillation and Spirits for Monster Brewing Company and an industry consultant based in Tampa, Florida. He is fascinated with all things drinkable and is always searching for strange and forgotten aspects of beverage production. If you would like to contact him about this, or anything else, please email him at ReadeHuddleston@gmail.com.
What causes cloudiness in clear spirits and how to avoid it
SeeKINGCLArITY
I I
S ee KING CLA r ITY
n the U.S., or anywhere outside of Mexico, you cannot make mezcal or tequila and call it as such. You can make an agave spirit. You can also use the dasylirion plant and make sotol — a mezcal-like beverage that’s not agave-based. Many distillers are also making more fruit-flavored spirits including, for our purposes here, vodka. However, there are factors that distillers haven’t considered or fully understand when making agave spirits or vodka (and even in modern gin formulation). One of those issues is the appearance of crystalline precipitates — calcium salts,
including a class known as calcium oxalates (the mineral that forms kidney stones). This article presents an overview of these factors. What are called clear spirits in the distilling industry — vodka, tequila, mezcal, and sotol — may not always come out of production clear. As discussed in previous issues, there are many factors that can lead to clear spirits becoming cloudy, hazy, or even muddy during and after spirits production. One of those issues includes the appearance of crystalline precipitates known as calcium salts. This article presents an overview of these and other factors that can muddy the waters when it comes to your spirits.
A few years ago, I wrote Bits and Blobs and UFO’s (Artisan Spirit Issue 21, 2017)
FIGure 1 An Overview of the Topic at Hand — This overview diagram shows the complexity of this topic. Most of the terms will be found as noted within the text. Specifically noted here are the sources of oxalates and associated calcium oxalate salts/crystals useful for those considering botanicals in their spirits. Note the prevalence of oxalates in wood used for barrel maturation (4, 5, 23) and in raw material cereal grains (17, 18). The types of oxalate crystals that form and their physicochemical considerations in spirits production and precipitation are so noted. Analysis using microscopy and useful stains or dyes for illuminating and identifying materials found in many spirits are illustrated along with the reasons for health concerns for producers (handling raw materials) and for consumers when enjoying the fruits of the distiller’s labors. Small figures of some oxalate shape forms are seen in Figure 2.
Crystal associated nephropathy
Oxalate content of foods
Daily oxalate intake
Extraction conditions
Analytical methods for spirits
Multi-analytical characterization
WRITTEN BY GARY SPEDDING, PH.D.
covering many unsightly objects and anomalies — hazes, flocs, sediments, oily residues, etc. — that can affect spirits production. That review covered the scant literature available on the problem for distillers but included three key works from the 1960s (1-3). In March 2025, we presented the topic in an extended format at the ACSA Conference in Tucson with a focus on the need for distillers to have the same manuals and guides at their disposal as are available to brewers and winemakers regarding the types of objects and matter to be seen floating or crashing out in distilled spirits. While that seminar covered all manner of issues, a concern specifically with calcium oxalates became apparent during the seminar preparation. Therefore, our approach concerning such details is now available.
Figure 1 presents an overview of the topic covering key terms, many of which will be noted and further defined below.
Additional notes (not fully detailed in the main text) include some brief definitions of terms in Figure 1. Cypselar walls come from a cypsela, a dry, single-seeded fruit, such as that found in dandelions or sunflowers, rather than a fleshy fruit like a berry or a drupe. Phyllodes are enlarged, photosynthetic petioles that replace the leaf lamina in some plant species. The petiole is a stalk that attaches a leaf to the plant stem. In petiolate leaves the leaf stalk may be long (like the leaves of celery and rhubarb) or short (such as basil). Styloids are a type of pencil-shaped calcium oxalate crystal found in some plants, alongside other forms like raphides (needle-shaped) and druses (rosette-shaped) crystalline forms (24). Morphometric analysis is a method used to study and quantify the morphology (shape and size) of calcium oxalate crystals. In the larger context of types and morphology, this analytical approach provides a more precise and objective way to characterize and differentiate between various crystal forms. Research Studies: Crystals may be identified via staining as noted in Figure 4 Health Implications: In addition to references cited in the text, a series of papers dealing with the increase in kidney stone cases has just been noted in 2025 (25).
History of Stains
Mechanisms of Stains
Systematics
Taxonomic significance
Ultrastructural changes
Crystal Structures
Thermal stability
Phase evolution
FIGure 2 Causes or origins of sediments, flocs, precipi tates, and crystal formation in distilled spirits — Distillers must consider many variables during processing to avoid the future (shelf-life aging) appearance of muddy sediments, flocs, gelatinous matters, chill hazes, and sharp looking fiber-like or needle-shaped crystals or other crystalline materials. The chart shows the prevalence of each condition/origin potential and the component causes of such visually deleterious or concerning matters that can appear (and as seen in a growing number of instances) in finished packaged spirits and cocktails. Details to be found elsewhere (author contact and https://www.eaton. com/content/dam/eaton/markets/ food-beverage/knowledge-center/ white-papers/as-clear-as-amberturbidity-in-whiskey-flaws-ortaste-criterion.pdf).
A final note here is the focus on metal ion salts precipitation and calcium oxalates due to the growing literature on the health concerns of these oxalates.
20 - 25%
20 - 25%
20 - 25%
ca. 15%
ca. 15%
< 10%
Causes/ Origins
Hazes
Floc
Sediments
Crystals in Spirits
** Oxalates key to this article
Figure 2 presents a quick glimpse of the origins and/or causes of anomalies including hazes, flocs, crystalline precipitates, and other sediments (unidentified floating objects aka UFOs) observed within the realm of finished distilled spirits. All such issues can be a cause for concern or alarm for distillers and consumers alike, especially when it comes to crystalline formulations of calcium salts such as calcium oxalates.
VODKA
Considerations for vodka production according to Warwicker (3):
1 Calcium and other mineral/metal depositions are possible with vodka spirits, although note here as not being pH dependent as it is for the brown or aged spirits (1, 3).
2 Calcium carbonates are suggested as more of an issue in vodka. (Not so much with oxalates — see below.)
3 Note it is important to prevent the contact of vodka with zinc, iron, and aluminum (unless metal surface protected) because of the corrosivity of alcohol/ acidity to metals.
4 Important to watch for water hardness — (Ca++, Mg++, ions) with bicarbonate and sulfate ions leading to bicarbonates and sulfate salts with such subsequent depositions noted as “muddy.” Dregs settle to the bottom and on the sides of bottles.
5 Water hardness (Ca++, Mg++ ion precipitation) can also assist in the precipitation of tannins, pectins, and organic acids.
6 Whitish floc and blue “crystal-like flocs” have been noted in vodkas after freezing temperatures.
As seen below, oxalates become an issue with fruit-flavored vodkas, especially if whole and natural fruits are used rather than purified juices/extracts/flavorings. Thus, it could be important to address the actual nature of any precipitates to either confirm or exclude the possibility of any of the origins noted above. See Figure 2
Minerals: calcium, magnesium, silicates**
Iron
Polysaccharides (pectins; wine-based brandies) and dextrins (short chain carbohydrates)
Considerations for gin production according to Warwicker (3):
1 As noted for vodka, calcium and other mineral/metal ion depositions are not as pH dependent as they are for the brown or aged spirits.
2 Calcium carbonates are suggested as more of an issue in gins. (Again, it was noted as much of an oxalates issue, though this could depend upon the botanicals used. See below.)
3 Preventing contact of gin with zinc, iron, and aluminum (unless the metal surface is protected) was also noted by Warwicker (3).
4 Use of demineralized water is important. Gins were observed to produce a white deposit with copper (within a few days) and a brown deposit with ferrous ions after only one day. (Orange “bits” have been noted both through consumer complaints found on the web and as seen in one instance by the author. However, the “substance” was not fully investigated or identified. An experiment with vodka and iron salts did throw an orange precipitate, however. Further work on such “tainted” products are needed.)
5
Slight white deposits were discovered after six weeks with large amounts of Mg++ and Ca++.
6 Deposits of calcium carbonate are possible.
Botanicals may add to the acidity and volatile oil content of gin, so silky turbidities and louching may occur (tannins, pectins, and organic acids could also be issues). Another consideration is that since Warwicker first reported on this topic in the 1960s, distillers are using many more botanicals in gin formulations today, and these new plants may contain considerable amounts of oxalate anions and calcium oxalate crystals (see below and Figure 3).
It should also be noted that wood contains high oxalate levels, thus there could be issues with rested gins (4,5).
me ZCAL, T e Q u ILA, AND SOTOL
Considerations for agave spirits are still being researched, but here are a few:
1 A type of calcium oxalate crystals known as raphides are abundant in tequila. They are needle-like with sharp spikes.
2 The acidic pH of agave liberates free oxalic acid, which is transferred to the alcoholic distillate (see oxalic acid reference in next section).
3 Low concentrations are found if the pH is below 4.0.
4 Distillers should avoid later distillation runnings (fractions) because that is when oxalates are predominantly found.
Further details can be found in the literature (6, 7). Much more research is necessary to hone in on
these issues and bring distillers up to speed. Because these issues have received more attention in beer and wine, brewers and winemakers have a plethora of pictorials and manuals discussing floc/haze/sediment issues in their beverages available to them.
ON TO OXALAT e S AND CALCI um OXALAT e S
Refer to Figures 1 and 2
Oxalic acid is a poisonous, colorless, crystalline solid that can cause severe damage to human tissues. It is found in plants and fungi, and its main industrial use is for bleaching and removing rust.
There are two types of oxalate-containing plants: those that contain insoluble oxalates (i.e., calcium oxalate) and those that contain soluble oxalates (i.e., sodium and potassium oxalate). Calcium binds very strongly to the oxalate anion forming calcium oxalate (very insoluble in water.)
Brewers use high amounts of calcium upfront (in process) to help precipitate out oxalate during the entire brewing process so it does not end up in the final product. Although not discussed, a similar precipitation might take place within spirits production stages. Then the balance tipping point for later precipitation (remaining Ca++ and oxalates in solution) may be affected by mineral-laden proofing/dilution water or filtration media.
FIGure 3 Botanicals and foods that are noted as containing high oxalate levels — The concept of this paper originated from a study of a client sample — a grapefruit vodka with the appearance of one type of oxalate crystal. That may now have been a rare instance of the crystal type known as raphides, but the frequent appearance of one odd-looking structure (revealed under the light microscope and multiple dye-staining conditions) led to understanding that there are myriad forms of oxalates present in nature.
Literature indicated that grapefruit and its juices are high in oxalates with one type known as druses detected in that fruit. Other high-concentration oxalate food sources are shown here, many with concerns for causing kidney stones and other calcium oxalate-related issues like skin sensitivity/ irritation. Druse-type oxalates and other calcium associated detritus (or assumed crystalline matter formations) is seen in Figure 4. Text notes on oxalates found in wood species included two key references (4, 5), and a more up-to-date work of interest (23). Cereal oxalates are also detailed (17, 18).
Initially the author was aware of two types of calcium oxalates: Weddellite, a Maltese cross-shaped or (octahedral) bipyramidal structure with, occasionally, a pseudo-barrel-like shape (dodecahedral) seen mainly in beers). For spirits, sharp needle-like crystals, such as those found in the tequilas studied, were observed (6). With such crystals sometimes forming interlaced structures; akin to one joining hands and having fingers pointing left and right. Multi-spike clusters! Weddellite and whewellite (ovoid shaped) are two forms of calcium oxalate, with whewellite being the monohydrate (CaC2O4·H2O) and weddellite the dihydrate (CaC2O4·2H2O) found in kidney stones and other natural environments.
Potatoes & Yams Wheat Bran
& Nuts Almonds
Black Tea
Dark Chocolate & Cocoa
Grains and wood also harbor calcium oxalates
& Juice
FIGure 4 Druse type oxalates from a grapefruit-flavored vodka — Composite portfolio of light microscopy images of druse-like calcium oxalates found in grapefruit-flavored vodka. A dusty gray suspension centrifuged to concentrate the suspended matter/sediment was stained with a dye called Alizarin red, which stains calcium material red under the correct pH conditions. Note some red matter was observed in other views. Here a differential (background) staining has revealed the material identified (from examination of the literature) as druse (or cluster type) oxalates. The 40x magnification under varied light/dark settings and focusing also revealed a lot of other smaller crystalline matter within this sample. Multiple other dye/stains also revealed these crystalline matter types.
Calcium oxalate monohydrate (whewellite) is closely associated with high oxalate concentration in the presence of normal or low calcium concentration.
So, we had observed two of the key shapes before. Then with the receipt of a grapefruit flavored (or infused) vodka, a new type to the author, known as druses, appeared (Figure 4). This resulted in a thorough literature search that has uncovered a vast world of oxalates and oxalate-related publications with a few relevant ones noted herein. See Figure 2 for an illustration of some of the crystal shapes possible.
OXALAT e S, I rr ITAT e D SKIN, AND KIDN e Y H e ALTH ISS ue S
The reasons to be aware of oxalates are for human safety and health purposes. High intake of calcium oxalates can have serious health implications for many individuals,including kidney stones, mouth irritation, skin irritation, and other health-related concerns. Oxalate nephropathy, a condition characterized by calcium oxalate crystal buildup in the kidneys, can lead to kidney damage and failure. This condition results from increased oxalate levels in the body, either through excessive intake (drinking) or increased absorption through the skin (8). Other health issues
associated with detection of oxalate in the urine include crystalluria (presence of crystals in urine), urolithiasis (hard deposits or “calculi” anywhere within the urinary tract), hyperoxaluria (excessive urinary excretion of oxalate), hypercalciuria and nephrolithiasis1 (renal stones within the kidneys) (9-13).
Relevant to the distilling industry, agave plantation workers and distillers who prepare the agave’s piñas are especially prone to severe skin rashes (6). Irritation of the skin or mouth might be associated with a little package of needle-sharp crystals called an idioblast (14). Crystal idioblasts are specialized cells within plants that are responsible for the production of calcium oxalate crystals creating the types and morphology of these crystals (raphides, prisms, druses, etc.) and their distribution. In fact, distinct types of idioblasts might exist, potentially contributing to the variety of crystal types and morphologies observed. The specific cellular environment within an idioblast, factors like ion concentration, pH, and the presence of organic matrices, likely influence the nucleation, growth, and final shape of the crystals (15). Thus, a diversity of idioblast types along with their distribution within a plant could also explain the presence of multiple crystal morphologies within the same species. One type of idioblast might produce needle-like raphides (as seen in agave), while another (like grapefruit) might produce the prismatic or druse-shaped crystals (see Figure 4) in a different tissue. In
simpler terms, the agave idioblast is like a little missile launcher, which opens and shoots out the crystals causing irritation2 (remember, it can remove rust!).3
In addition to biology, a further understanding of plant chemistry is now aiding in diagnostic approaches to this irritating aspect of the oxalate topic (16).
OXALAT e S
Types, Shapes, and Plants of Origin of Potential Concern for Distillers
Crystal shapes can vary by plant species based on physiology and terroir and in many ways such as single crystal, contact twins, penetration twins, along with more layered and various intricate structural-shaped objects (Figures 1 and 2). The growth and forms also vary in relation to the levels and availability of calcium and/or magnesium ions and upon the presence of and concentration of sucrose. Additionally, there might be calcium phosphate and other calcium salt crystals present within precipitated samples. Sweetened products, additives, proofing conditions (release of mineral ions from filtration media) along with formulations and processing stages might also affect the oxalate
2 Images of such skin rashes may be seen here: https://dermnetnz.org/topics/plant-dermatitis
3 Plants reported to cause dermatitis are detailed here: https://portal.ct.gov/caes/fact-sheets/ plant-pathology/plants-reported-to-cause-dermatitis and see: https://www.mdedge.com/dermatology/ article/245810/contact-dermatitis/plant-dermatitismore-just-poison-ivy.
content and other mineral deposits in spirits. This issue will be of most importance to distillers using botanicals; therefore, a list of foods/botanicals containing high oxalates levels, is presented in Figure 3. In addition, agave, blackberries, celery, cinnamon, cumin, figs, ginger, and rye (see 17 and 18 for cereals and oxalates) can be added to that list. Wood sources for spirits resting and maturation, plus prior barrel contents, should also be included. Sherry barrels, particularly those made of Spanish oak, have been noted as leaching oxalic acid over time, reacting with calcium to form the classic white calcium oxalate crystalline precipitate in the maturing whisky.4 For other floc issues with whiskies see the first reference by Warwicker (1). Key scientific articles consider the sources, distribution, and concentration of oxalates in various plants/foods of interest or in “poisonous” (allergically irritating) plants (19-22).5
CONCL u SION
While a vast amount of literature now exists on this topic, only a brief summary overview has been presented here with a few relevant references for further reading by inquiring readers. A fuller set of references is available upon request.
For distillers, the issue comes down to a need for further research and the creation of a pictorial atlas of such crystalline materials (and including iron, magnesium, copper salts, etc.). This is to better assess quality control issues and address any consumer complaints in the event of unsightly matters that may appear in spirit beverages. Case in
4 See https://www.rarewhisky101.com/rw101blog-cutting-spirit/rare-whisky-and-sediment and https://www.facebook.com/share/p/1BijreeLEe/.
5 A full listing of oxalates in foods may also be found here: https://ucikidneystonecenter.com/ wp-content/uploads/2020/06/Oxalate-Content-of-Foods.pdf and https://durwardblack.com/ wp-content/uploads/2016/08/DurwardBlack. com-Oxalate-Database.pdf , here https://www.stjoes. ca/patients-visitors/patient-education/patient-education-k-o/pd-9447-oxalate-in-food.pdf and, https://ohf.org/wp-content/uploads/2024/02/Oxalate-List-022724.pdf plus beverages list here: https:// ohf.org/beverages-oxalate/.
point, consumer review sites on the World Wide Web have described numerous issues with spirits using inflammatory commentary such as (paraphrasing here), “they look like shards of fiberglass and I would not consume it.” While likely wrong on identity, it is still a visually unappealing issue and might even be
a health concern to the point of recommending a recall.
Most important is the need to identify the culprit! While this goes well beyond the oxalate topic, hopefully the need for obtaining clarity and resolution in spirits has been made here.
Gary Spedding, Ph.D. is a brewing, distilling, and sensory analytical chemist, and owner of Brewing and Distilling Analytical Services, LLC in Lexington, KY.
reFereNCeS A few references cited are only within the Figure legends. Many other references to this vast and growing topic area are available upon request (via subscription/purchase or open access) or via standard search engine sites.
1) Warwicker, L. A. Instability in potable spirits. I.—Scotch whisky. Journal of the Science of Food and Agriculture 1960, 11 (12), 709-716. DOI: doi. org/10.1002/jsfa.2740111206.
2) Warwicker, L. A. Instability in potable spirits. II.—rum and brandy. Journal of the Science of Food and Agriculture 1963, 14 (6), 365-371. DOI: 10.1002/ jsfa.2740140601.
3) Warwicker, L. A. Instability in potable spirits. III.—gin and vodka. Journal of the Science of Food and Agriculture 1963, 14 (6), 371-376. DOI: 10.1002/ jsfa.2740140602.
4) Trockenbrodt, M. Calcium Oxalate Crystals in the Bark of Quercus robur, Ulmus glabra, Populus tremula and Betula pendula. Annals of Botany 1995, 75 (3), 281-284. DOI: 10.1006/ anbo.1995.1022.
5) Serdar, B.; Demiray, H. Calcium oxalate crystal types in three oak species (Quercus L.) in Turkey, Turkish Journal of Biology. 2012. Vol. 36: No. 4, Article 3.DOI: 10.3906/biy-1109-35.
6) Salinas, M. L.; Ogura, T.; Soffchi, L. Irritant contact dermatitis caused by needle-like calcium oxalate crystals, raphides, in Agave tequilana among workers in tequila distilleries and agave plantations. Contact Dermatitis 2001, 44 (2), 94-96. DOI: 10.1034/j.1600-0536.2001.440208.x.
7) Mondragon, M.; Elizalde, L.; Rejón, V. Biominerals in the leaves of Agave karwinskii Zucc. Results in Chemistry 2022, 4, 100309. DOI: 10.1016/j. rechem.2022.100309.
8) Rosenstock, J. L.; Joab, T. M. J.; DeVita, M. V.; Yang, Y.; Sharma, P. D.; Bijol, V. Oxalate nephropathy: a review. Clin Kidney J 2022, 15 (2), 194-204. DOI: 10.1093/ckj/sfab145.
9) Daudon, M.; Frochot, V.; Bazin, D.; Jungers, P. Crystalluria analysis improves significantly etiologic diagnosis and therapeutic monitoring of nephrolithiasis. Comptes Rendus Chimie 2016, 19. DOI: 10.1016/j.crci.2016.04.010.
10) Frochot, V.; Daudon, M. Clinical value of crystalluria and quantitative morphoconstitutional analysis of urinary calculi. International Journal of Surgery 2016, 36, 624-632. DOI: 10.1016/j.ijsu.2016.11.023.
11) Buysschaert, B.; Aydin, S.; Morelle, J.; Gillion, V.; Jadoul, M.; Demoulin, N. Etiologies, Clinical Features, and Outcome of Oxalate Nephropathy. Kidney Int Rep 2020, 5 (9), 1503-1509. DOI: 10.1016/j. ekir.2020.06.021.
12) Demoulin, N.; Aydin, S.; Gillion, V.; Morelle, J.; Jadoul, M. Pathophysiology and Management of Hyperoxaluria and Oxalate Nephropathy: A Review. American Journal of Kidney Diseases 2022, 79 (5), 717-727. DOI: 10.1053/j. ajkd.2021.07.018.
13) Bao, D.; Wang, Y.; Zhao, M.h. Oxalate Nephropathy and the Mechanism of Oxalate-Induced Kidney Injury. Kidney Diseases 2023, 9 (6), 459-468. DOI: 10.1159/000533295.
14) Coté, G. G. Diversity and distribution of idioblasts producing calcium oxalate crystals in Dieffenbachia seguine (Araceae). Am J Bot 2009, 96 (7), 1245-1254. DOI: 10.3732/ ajb.0800276.
15) Thongboonkerd, V.; Semangoen, T.; Chutipongtanate, S. Factors determining types and morphologies of calcium oxalate crystals: molar concentrations, buffering, pH, stirring and temperature. Clin Chim Acta 2006, 367 (1-2), 120-131. DOI: 10.1016/j. cca.2005.11.033.
16) Rozas-Muñoz, E.; Lepoittevin, J. P.; Pujol, R. M.; Giménez-Arnau, A. Allergic Contact Dermatitis to Plants: Understanding the Chemistry will Help our Diagnostic Approach. Actas DermoSifiliográficas 2012, 103 (6), 456-477. DOI: 10.1016/j.adengl.2012.07.006.
of Cereals and Cereal Products. Journal of Agricultural and Food Chemistry 2006, 54 (8), 3008-3011. DOI: 10.1021/jf052776v.
18) Brudzyński, A.; Salamon, A. The Oxalic Acid Content in Selected Barley Varieties Grown in Poland, as well as in their Malts and Worts. Journal of the Institute of Brewing 2011, 117 (1), 6773. DOI: 10.1002/j.2050-0416.2011. tb00445.x.
19) Tütüncü Konyar, S.; Öztürk, N.; Dane, F. Occurrence, types and distribution of calcium oxalate crystals in leaves and stems of some species of poisonous plants. Bot Stud 2014, 55 (1), 32. DOI: 10.1186/1999-3110-55-32.
20) Anitha, R.; Sandhiya, T. Occurrence of Calcium Oxalate Crystals in the Leaves of Medicinal Plants. International J. of Pharmacognosy 2014, 1 (6); 389-93. DOI: 10.13040/IJPSR.0975-8232. JP.1(6).389-93.
21) Salgado, N.; Silva, M.A.; Figueira, M.E.; Costa, H.S.; Albuquerque, T.G. Oxalate in Foods: Extraction Conditions, Analytical Methods, Occurrence, and Health Implications. Foods 2023, 12, 3201. DOI: 10.3390/ foods12173201.
22) Hussain, Z.; Mir, R.; Dar, M.; Somasundaram, R. Crystalline Chronicles : Navigating the Wonders and Worries of Plant Calcium OxalateA Review. Indian J. of Natural Sciences 2024, 15, 1-12.
23) Füchtner, S.; Alfredsen, G.; Thygesen, L. G. Oxalate found in wood cell wall during incipient brown rot degradation. International Biodeterioration & Biodegradation 2023, 177, 105531. DOI: 10.1016/j.ibiod.2022.105531.
24) Raman, V.; Horner, H. T.; Khan, I. A. New and unusual forms of calcium oxalate raphide crystals in the plant kingdom. J Plant Res 2014, 127 (6), 721-730. DOI: 10.1007/ s10265-014-0654-y.
25) Nazarian, R.; Lin, N.; Thaker, S.; Yang, R.; Wong, G.; Scotland, K. What Causes Calcium Oxalate Kidney Stones to Form? An Update on Recent Advances. Uro 2025, 5, 6. DOI: 10.3390/uro5010006.
A Jamaican Alchemy of Rum and Resilience
WRITTEN BY HARRY HALLER
THE DUNDER PIT
Jamaican rum is more than a spirit — it is an emblem, a distilled narrative of survival, ingenuity, and rebellion. Its bold, unmistakable “funk” carries a history that refuses to be simplified, a complexity tied to a quiet yet essential protagonist: the dunder pit. Unassuming in appearance and little more than a repository for liquid leftovers, it nonetheless occupies a mythic place in the alchemy of Jamaican rum. Here,the humblest of processes transforms byproducts into a liquid legacy celebrated around the world.
The dunder pit serves a deceptively simple purpose: It collects the nutrient-rich byproduct of sugarcane distillation, known as dunder. But to dismiss this liquid as mere waste is to miss the heart of the story. When reintroduced into fermentation tanks, the dunder creates a microbial playground. Wild yeasts, bacteria, and enzymes thrive in its depths, creating the conditions for an alchemy that produces high-ester rum. The result is a spirit bursting with overripe banana, spiced pineapple, and earthy undertones — a complexity that doesn’t just suggest Jamaica but declares it.
The funk — a term used reverently by rum aficionados — is no accident. It’s a meticulous balancing act, a microbial symphony nurtured in the warm, nutrient-rich environment of the dunder pit. Wild yeasts break down sugars, bacteria produce acids, and esters (the aromatic compounds responsible for Jamaican rum’s signature notes) are born. This is chemistry as art, driven as much by instinct as by tradition.
The funk — a term used reverently by rum aficionados — is no accident. It’s a meticulous balancing act, a microbial symphony nurtured in the warm, nutrient-rich environment of the dunder pit.
But the dunder pit is more than its microbial marvels. It is also a monument to Jamaica’s cultural resourcefulness. In the colonial era, when survival demanded ingenuity, rum-makers embraced a spirit of experimentation. Tales abound of goat heads, animal blood, rotting fruit, and even manure finding their way into dunder pits. These additions, while shocking to modern sensibilities, were believed to enhance microbial activity, intensifying the funk and deepening the rum’s complexity.
Were goat heads truly part of the process? The answer is both yes and no, a story that lies somewhere between practicality and myth. In a time when nothing could be wasted, it’s plausible that distillers added such elements to their pits, seeking to feed the microorganisms that fueled fermentation. Goat heads, after all, contain minerals that could aid microbial growth, while other organic matter might have subtly influenced flavor. The truth matters less than the story itself, which speaks to the fearless experimentation that has always defined Jamaican rum, a willingness to push boundaries and try the unthinkable.
Today, the dunder pit stands at a crossroads. At Jamaican distilleries like Hampden Estate and Long Pond, its role remains central and traditions meticulously preserved. These places operate as living relics, quiet rebukes to the homogenization that defines much of the modern rum industry. Yet, the survival of the dunder pit is not guaranteed. As global demand for rum grows, many producers are turning to controlled fermentation, trading the unpredictability of the pit for the efficiency of laboratory precision.
Even so, the dunder pit has become a rallying cry for purists and enthusiasts. Craft distillers, mixologists, and collectors champion high-ester rums as a testament to Jamaica’s artisanal integrity. Each sip of these spirits is an act of rebellion against uniformity, a celebration of tradition and innovation existing in harmony.
But the dunder pit’s significance transcends the technical. It is, at its core, a cultural artifact. For the enslaved people who labored on Jamaica’s sugar plantations, rum production was more than an economic enterprise — it was a form of creation, a transformation of the bleak into the beautiful.
From the detritus of the distillation process, they forged a spirit that would eventually conquer the world. That ingenuity, born of oppression, imbues every barrel of Jamaican rum with a quiet defiance.
The dunder pit, whether or not it ever held goat heads, carries that history forward. Its lore, audacious and improbable, embodies the spirit of Jamaican rum: unorthodox, inventive, and unapologetically bold. These stories, like the rum itself, reject convention, delighting in the unexpected and the extraordinary.
Harry Haller is a consultant for the food and beverage industry. His main focus is on innovative ways to produce and use alcohol and the development of high-end milk chocolate recipes.
Written by DOUG HALL
Distillery Team Member Engagement
Team member engagement, the strategy of actively encouraging employees to gather ideas and solve problems, could be the difference between distilleries that survive the current challenging times the spirits industry is facing and those that don’t. When employees are engaged they contribute ideas, advice, insights, and energy that enable your distillery to adapt to the inevitable ups and downs of the business.
Research by the Gallup Organization finds that when your team members are fully engaged, a chain reaction of positives occur including:
▶ 81 percent decrease in absenteeism
▶ 64 percent decrease in safety incidents
▶ 43 percent decrease in employee turnover
▶ 42 percent decrease in quality defects
▶ 23 percent increase in profitability
▶ 18 percent increase in productivity/sales
▶ 10 percent increase in customer loyalty
There are three steps for growing team member engagement:
Step 1: Engagement begins with you
It starts with you being fully engaged and aware of what is working and not working at your distillery. It also means being fully present with all of your team members, from your management team to the newest and lowest level employee.
The most effective starting place for growing engagement is to focus your energy on what I call “Stopping the Stupid.” Get with your team and ask them straight up, “What are the stupid things that get in your way as an individual or our way as a team?” You might be amazed at what you hear. Some will be big things. Some small things. Among the things employees tell us that are “stupid” are communication challenges, flawed tools, lack of training, and/or poor or missing standard operating procedures. However, all will be the kinds of things that prevent you and your team from realizing their potential.
Focusing your distillery team on “Stopping the Stupid” provides employees a clear, meaningful, and immediate personal benefit.
Step 2: Engagement grows when you explain what and why
With momentum from Step 1, your team members are ready for bigger challenges. For this they need help from their team leader, manager, or leaders who have a broader understanding of the systemic challenges your distillery faces. Therefore, to engage your team in bigger challenges, it’s important to explain your distillery’s what and why
What is the challenge you seek to solve? Why is this problem important? Summarize the problem’s what and why in a way that makes it easy for others to understand.
Problem solving takes work, and implementing solutions takes energy. The most effective energy source for powering change is understanding what the problem is and why solving it is important. This creates intrinsic energy within you and your organization. It creates “pull” from the organization to realize the benefits that come from solving a problem.
Step 3: Engagement sustains employee capability and confidence
Creating sustainable employee engagement requires leadership taking responsibility for continuous improvement in the capability and confidence of team members. It means one-on-one coaching, providing them with books, video and/or training courses to help them think smarter, faster, and more creatively.
It also means enabling active engagement by more of your team in the important challenges the organization faces. In our case, we taught a number of our distillery staff how to work as brand ambassadors when time permitted. Interestingly, we found that their personal knowledge and love of the brand made them incredibly effective brand ambassadors with trade customers and consumers.
BONUS:
An Extra 3.5 Hours a Day of Time For You
A national study we ran during the writing of our book finds that the average manager wastes 3.5 hours a day reacting to flawed company work systems and employee mistakes. Interestingly, 78 percent of this waste is from flawed company work systems such as poor work instructions, flawed digital systems, ineffective communications, and needless bureaucracy. Only 22 percent of wasted time is from employee mistakes. The best way I know to address this epidemic of waste is to engage the entire organization — employees, managers, and leadership — in proactively identifying and fixing work system problems.
Engaged teams not only perform better they also help businesses to adapt and thrive. Start small, stay consistent, and the results will speak for themselves.
Engaged teams not only perform better they also help businesses to adapt and thrive
.
Doug Hall is the co-founder and CEO of Brain Brew Custom WHISKeY, WoodCraft Bourbon Blender Franchising and founder/chairman of the Eureka! Ranch. He has spent 40+ years creating and commercializing innovations for companies such as Nike, Walt Disney, Diageo and over the past 22 years The Macallan of Scotland.
OPEN ACCESS
and available to the entire distilling community. Read all peer-reviewed articles online now.
SIGN UP TODAY for access to the digital version of the publication visit journaldistilling.com
Peer-reviewed, original scientific papers
• Reporting significant research
• Technical reports
• Applicable analytical techniques and methods
• Reviews
Scientific and technical disciplines applied to the distilling of high-quality, potable alcoholic beverages
• Biology/microbiology
• Chemistry/biochemistry
• Molecular biology
• Physics and engineering
International board members, contributors, and audience
• Universities and colleges
• Research institutes and industrial laboratories
• Distilleries
• Raw materials producers
• Allied industries supporting the testing and quality control functions of distilling operations
SPECIAL THANKS TO THE SPONSORS MAKING THIS POSSIBLE