
18 minute read
Aquafeed evaluation under specific farming conditions


Aquafeed evaluation under specific farming conditions: A RAS application
Ana Nobre, Filipe Soares, Tomé Silva, Jorge Dias, Luis Conceição, Sparos, Paulo Rema, UTAD
Advertisement
Salmonid aquafeeds have evolved over the last halfcentury to meet the increased industrialization of this sector with the formulations representing a balance between nutritional requirements, cost, ingredient availability and sustainability standards. Currently, there is a wide variety of commercial aquafeeds designed for different generic farming conditions and fish growth stages. A precise evaluation of the suitability of aquafeeds for the particular conditions of the farm is required to optimize fish feeding and economic feed conversion.
This is highly relevant for optimal fish growth and performance while ensuring optimal water quality, in RAS farms. Optimizing RAS production implies a balance between fish growth, feed efficiency and water quality. Monitoring feeding efficiency indicators is very important not only for the economics of feed conversion but also for planning and managing the biofilter. For instance, decreasing nutrient and solid loads per kg of fish produced enables increasing the fish stocking capacity of the system. In this context, decision-supporting tools for monitoring and forecasting fish nutrient waste, including virtual environments based on mathematical models of fish physiological and metabolic processes, are critical for RAS operation planning.
FEEDNETICSTM is a web application developed by SPAROS that includes a mechanistic nutrient-based model to predict fish growth and composition over time, using information on temperature, feed intake
Figure 1. FEEDNETICSTM validation charts for body weight: measured vs predicted. Based on a wide range of datasets regarding water temperature (8.5°C to 17.0°C) and feed composition: gross energy 17.5 - 24.5 MJ/kg, crude protein 37.5 - 53.5 %, crude lipids 5.8 - 27.9 %, ratio DP/DE 17.4 - 26.6.
Table 1. Rainbow trout aquafeeds evaluated, based on commercial specifications.
Trout feeds High energy RAS High energy
Pellet (mm) Price (% variation) Proximal composition (as fed basis)
Digestible protein (%) Digestible lipids (%) Ash (%) Fiber (%) Digestible P (%) Digestible energy (MJ/kg)
DP/DE (g/MJ)
3 4.5 6 reference
38.6 37.0 33.9 23.5 25.4 27.1 7.0 6.0 6.0 2.1 2.1 2.1 0.8 0.7 0.6 21.1 21.4 21.9 18.3 17.3 15.5 3 4.5 6 +6%
41.6 40.5 35.2 26.9 28.7 29.7 5.2 5.4 4.3 2.0 2.0 2.0 0.6 0.6 0.5 22.4 22.6 22.8 18.5 17.9 15.4
To focus on evaluating the different feed concepts, the amino and fatty acid profiles were the same for the 2 feeds, and comply with trout requirements.
and feed properties. The model has been calibrated with highly variable data and is currently available for gilthead seabream, European seabass, rainbow trout and Nile tilapia. Other species will follow and further calibration for a specific strain or other species not available can be provided upon request and pending on data availability. The validation charts shown in Figure 1 illustrate the model robustness for this use case.
Herein, we illustrate a FEEDNETICSTM application to compare two high-energy feeds, including one that is designed for RAS. Similar aquafeed performance evaluation can be carried out directly in the web application by fish farmers or aquafeed customer support teams.
Farming conditions and feeding regimes
We considered a trout harvest size of 1 kg and the following typical trout farming conditions: initial stock of 15,000 trout of 50 g, a mortality rate of 1% per month, and two scenarios of water temperature, a reference profile ranging between 13°C and
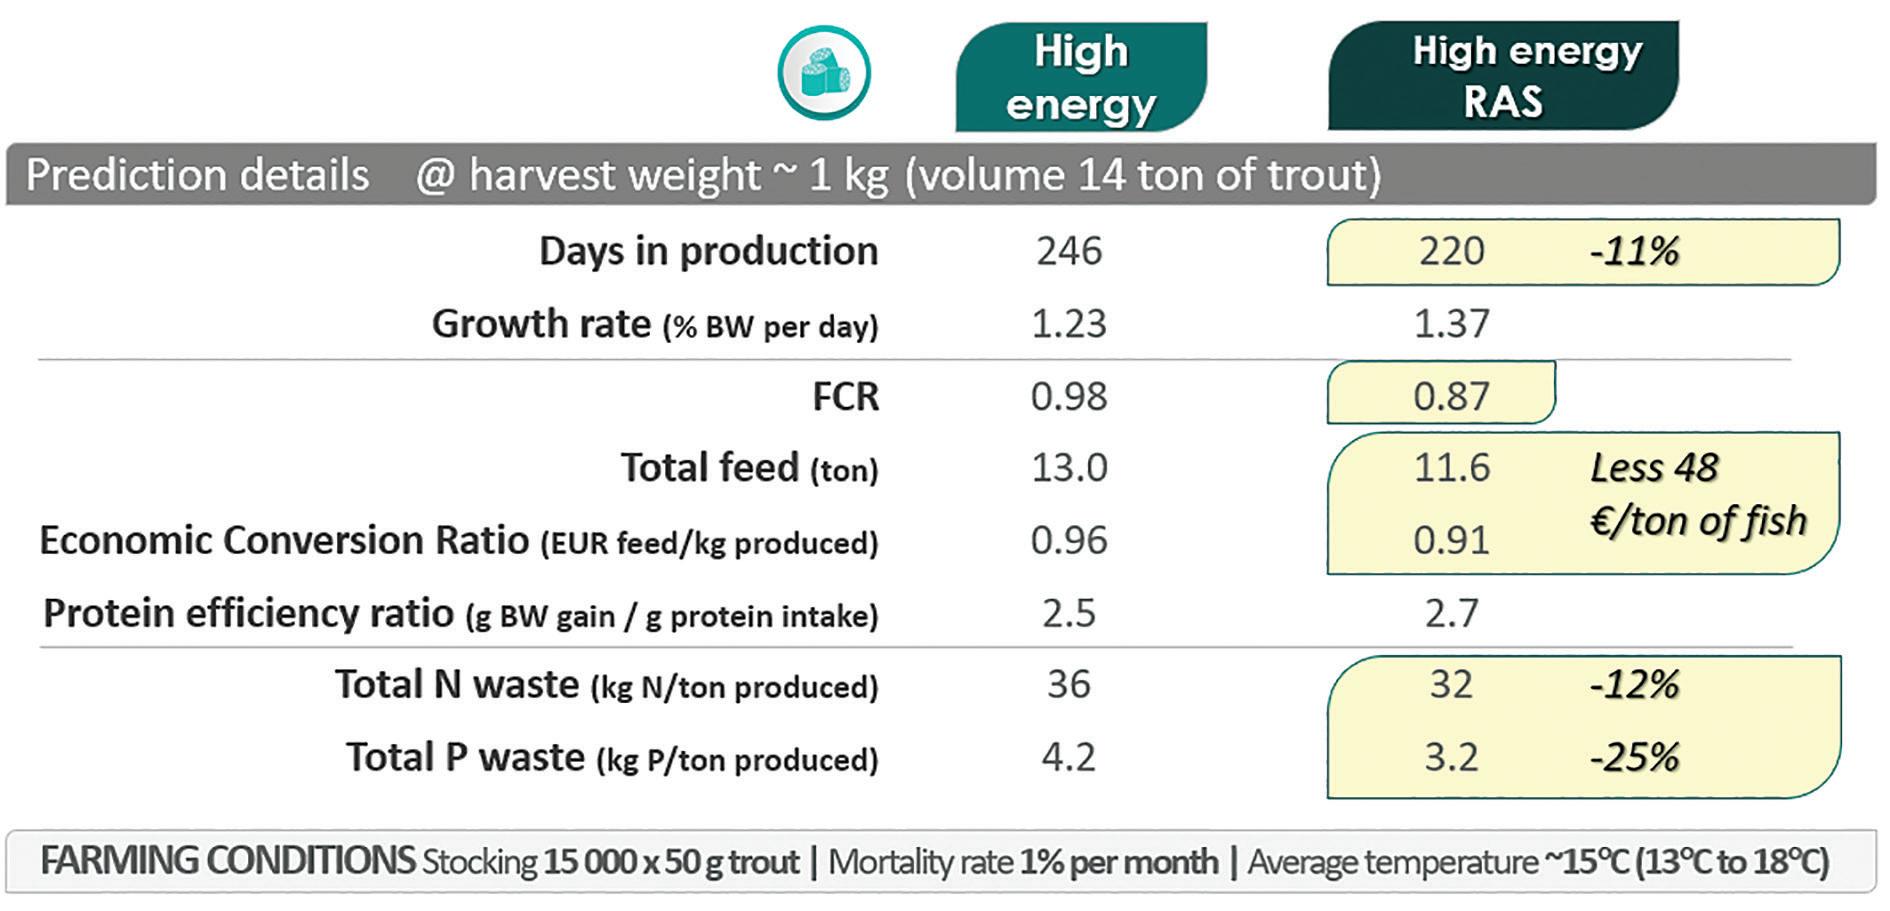
Figure 2. FEEDNETICSTM model results for the comparison of two high-energy feeds under a temperature profile around 15°C (ranging between 13°C and 18°C).
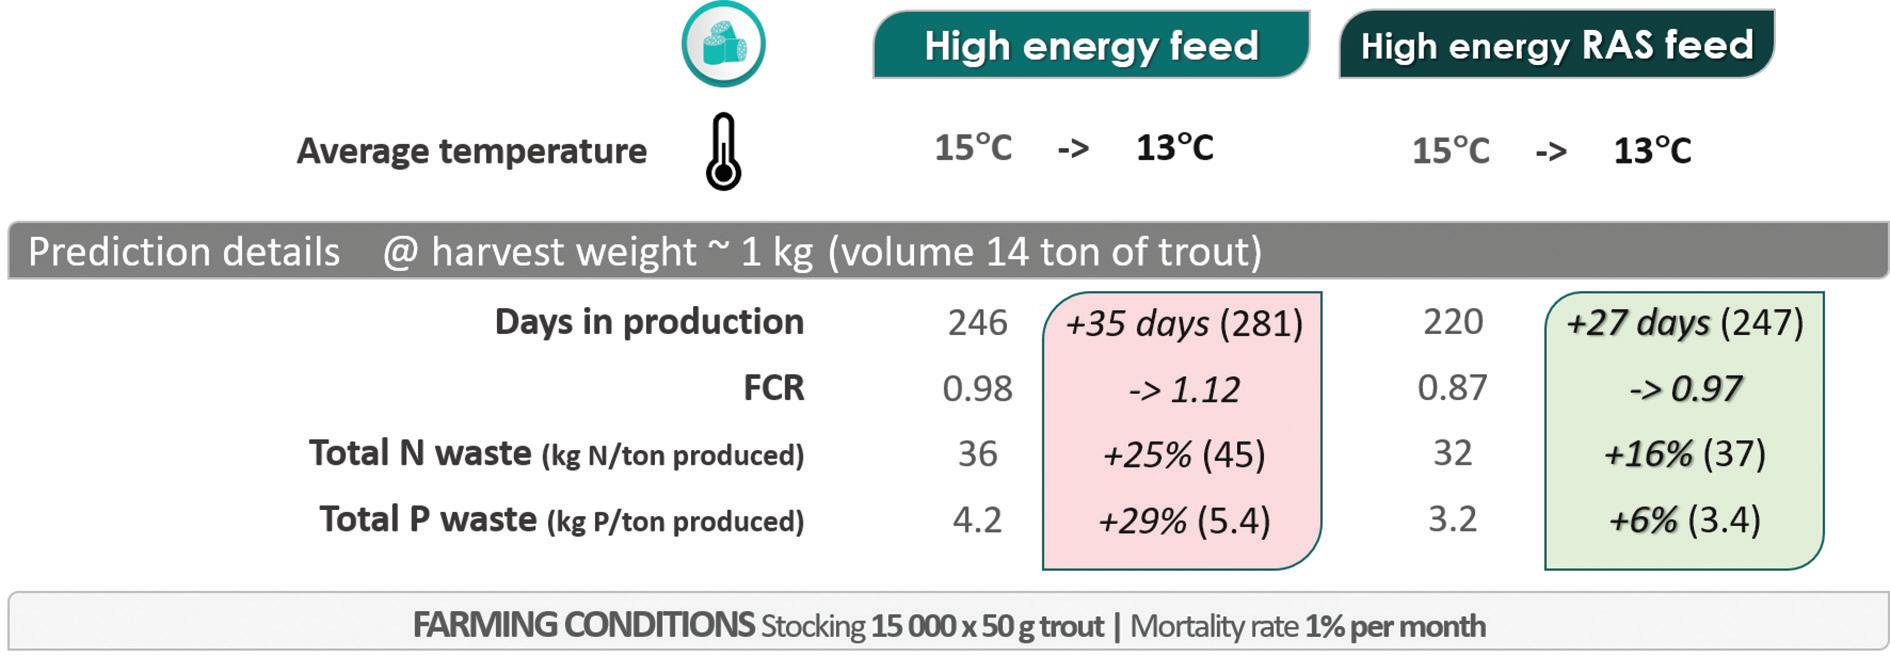
Figure 3. FEEDNETICSTM model results for the comparison of two high-energy feeds under two temperature profiles around 15°C (ranging between 13°C and 18°C) and around 13°C (ranging between 11°C and 16°C).
18°C with an average around 15°C, and a lower temperature profile (2°C lower than the reference).
The feed characteristics are presented in Table 1. Both feeds have a high energy content. However, the RAS feed is denser in nutrients, with higher digestible protein and lipid levels, targeting a reduced FCR thus allowing an increase in the farm fish production capacity maintaining the same waste discharges. In terms of DP/DE ratios, the feeds are similar. The feed improvements come at a higher cost (+ 6%).
The feeding table considered is consistent with the commercial advised feeding rates for a high-energy feed. In a real application, we recommend that feeding tables are generated per feed and growth curve of the farm or production unit using FiT feeding tablesTM .
Evaluation of two high-energy aquafeeds
The objective of this application is to compare the performance of the two high-energy trout feeds (Table 1). With FEEDNETICSTM, we can quantify the performance indicators for an overall production cycle, such as days in production to reach the target harvest weight, FCR, growth rate, total feed consumed, economic conversion, protein efficiency ratio and nitrogen (N) and phosphorus (P) wastes (total, metabolic and fecal). As expected, the FEEDNETICSTM simulations (Fig. 2) indicate that the high-energy RAS feed leads to a better performance: shorter (11%) production cycle, improved FCR by 0.1 units, and a decrease in total N and P wastes of about -12% and -25%, respectively.
While there may be deviations between the simulation results and real measurements (due to, for instance,
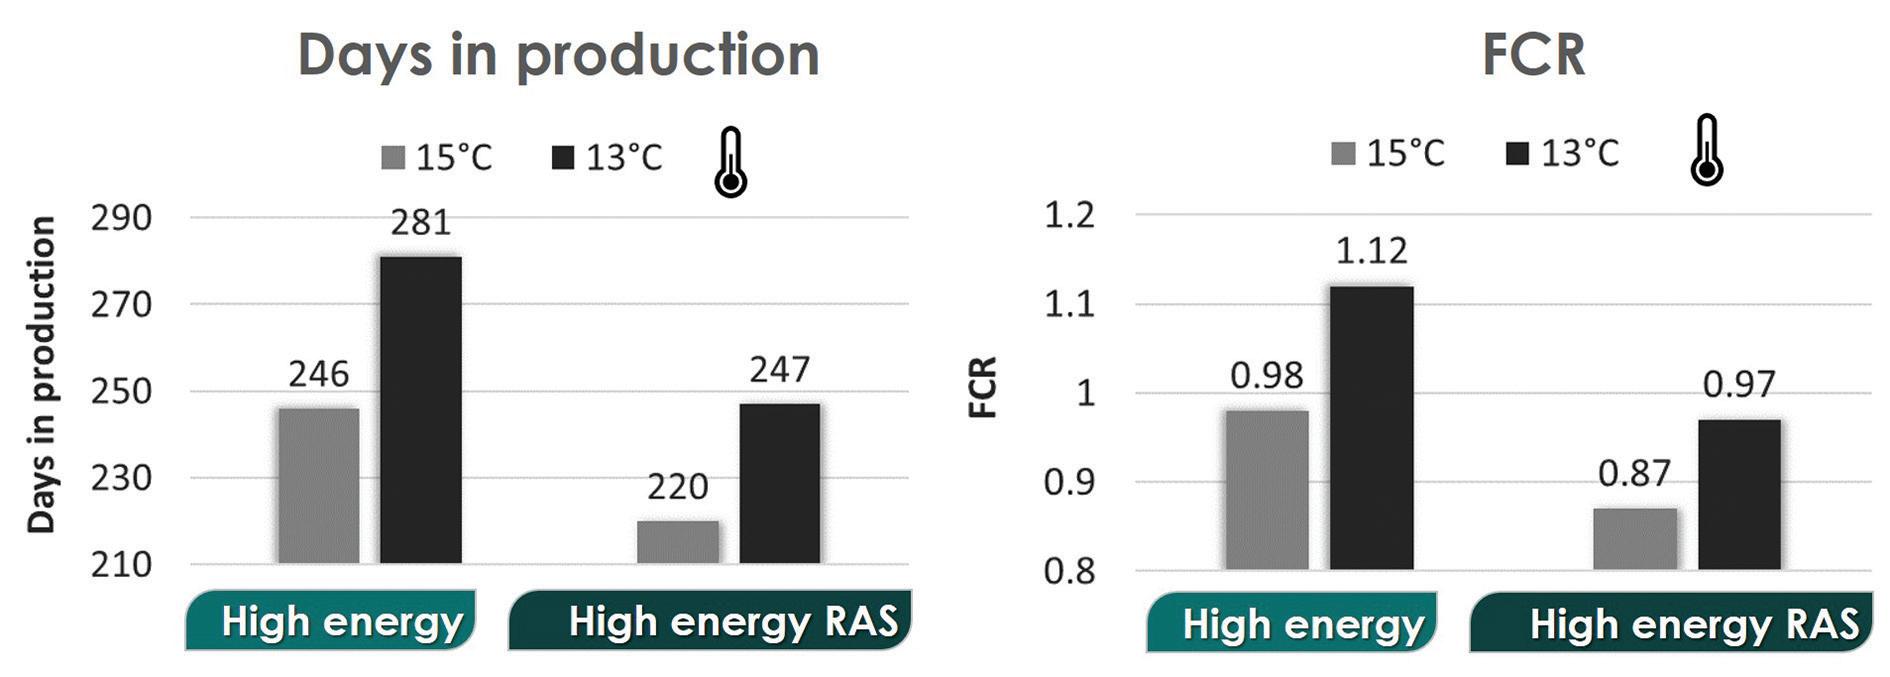
Figure 4. FEEDNETICSTM model results for days in production and FCR, for the comparison of two high-energy feeds under two temperature profiles around 15°C (ranging between 13°C and 18°C) and around 13°C (ranging between 11°C and 16°C).
different fish origins, different stress factors, variations in the batch of the feed used, among many other), a mechanistic tool such as FEEDNETICSTM can be particularly useful to evaluate overall trends and carry out a cost-benefit analysis. For the particular simulated conditions, the RAS feed leads to a better economic conversion, lower N and P discharges, and with saving estimated around less €48 of feed per ton of fish produced, despite its higher unit cost.
Temperature is an important parameter that affects fish intake, growth and metabolism and has a high impact on production performance. As such, the precise evaluation of aquafeeds will also depend on the particular temperature profiles under which fish are reared (i.e., not only the average temperature, but also its variation along time). To illustrate this, the objective of this second use case is to compare the performance of the two high-energy trout feeds detailed in Table 1, considering a second temperature profile with a lower average temperature compared to the reference used in the previous use case (Fig. 2).
According to the FEEDNETICSTM results, the decrease in the average water temperature affects proportionally more the production performance with the non-RAS feed (Fig. 3). In particular, the results show a higher metabolic P waste for the non-RAS high-energy feed (0.7 kg P/ton produced at 15°C and 1.4 kg P/ton produced at 13°C) compared with the RAS feed (0.4 kg P/ton produced at both 15°C and 13°C). For the nonRAS feed, the Total P waste increases about 29% when decreasing the temperature by 2°C, which is due to a decrease of the P retention.
With the high-energy RAS feed, the FCR at the lower temperature is still within the sector standard (around 1), while the FCR increases to 1.1 with the non-RAS feed (Fig. 3, 4). With the high-energy feed, the production cycle (to grow fish from 50 g to 1 kg) increases by 35 days under the low temperature profile (Fig. 3, 4). At 13°C, the total production time considering the two feeds lags by about 1 month, with the RAS feed representing savings on feed of around €82 per ton of fish produced when compared with the non-RAS feed.
Conclusion
The FEEDNETICSTM mechanistic nutrient-based model includes the fish physiological and metabolic processes that are required to predict the effects of feed composition and temperature on fish growth, feed conversion and wastes, among other variables. As illustrated in this use case, this type of tools can be used by the aquaculture industry for precision aquafeed evaluation under specific farm conditions. Besides enabling aquafeed evaluation, the FEEDNETICSTM results can help the design and planning of the RAS facilities concerning, for example, biofilter capacity and the cost-benefit assessment of active temperature control, and planning feed changes. FEEDNETICSTM is available to be used by fish farmers and the aquafeed sector as a web app.
More information: Ana Nobre
Product Manager Sparos, Portugal E: ananobre@sparos.pt


Aquafeed magazine
NEXT ISSUE
Marine oils & proteins l Gut health Feed safety l PC & management systems
2022 Media Packs now available: sales@aquafeed.com
Nutritional fish & shrimp pathology - III
Albert G. Tacon, Ph.D.
Dr. Albert Tacon is a Technical Editor at Aquafeed.com and an independent aquaculture feed consultant. E: agjtacon@aquahana.com
Disorders in mineral nutrition

This column is the third of a six-part series extracted from a forthcoming publication by the author dealing with the major reported nutritional disorders in farmed fish and shrimp, and represents an update to a previous review published by FAO in 1992 (Tacon, 1992).
In common with most farm animal species, fish and shrimp have a physiological requirement for over 20 minerals, including, 1) the macro-minerals: Calcium (Ca), Phosphorus (P), Potassium (K), Sodium (Na), Sulphur (S), Magnesium (Mg), Chlorine (Cl); 2) the trace minerals Iron (Fe), Zinc (Zn), Copper (Cu), Manganese (Mn), Cobalt (Co), Iodine (I), Selenium (Se), Chromium (Cr), Molybdenum (Mo); and 3) possibly the newer trace elements Aluminium (Al), Arsenic (As), Boron (B), Bromine (Br), Fluorine (F), Germanium (Ge), Lead (Pb), Lithium (Li), Nickel (Ni), Rubidium (Rb), Silicon (Si), Tin (Sn), and Vanadium (V).
In marked contrast to terrestrial farm animals, fish and shrimp live immersed in an aquatic environment, and as such, have the ability (depending upon the species and culture environment) to satisfy all and/ or part of their dietary mineral requirement through mineral absorption across the gills, body surface and/or through water ingestion.
The following tables show the major reported deficiency signs and health impacts of fish and shrimp fed diets deficient in macro-minerals and trace minerals, including the macro-minerals calcium, phosphorus, potassium, and magnesium, and the trace minerals iron, zinc, copper, manganese, selenium, chromium, iodine and cobalt.
Table 1. Reported mineral/element deficiency signs and health impacts on fish and shrimp.
CALCIUM (Ca) Reported deficiency signs & health impacts
Atlantic salmon (Salmo salar) Reduced bone mineralization when dietary phosphorus was below requirement level
Blue tilapia (Oreochromis aureus)
Channel catfish (Ictalurus punctatus) Reduced growth & bone mineralization in low-calcium water, reduced growth & feed efficiency, reduced growth, feed efficiency & bone mineralization Reduced growth & feed efficiency in calcium-free water
Grass carp (Ctenopharyngodon Idella) Tiger puffer (Takifugu rubripes) Reduced growth, feed efficiency & bone mineralization Hybrid tilapia (Oreochromis niloticus x O. aureus) Reduced growth & bone/scale mineralization Indian major carp (Labeo rohita) Reduced growth, feed efficiency, protein efficiency ratio, and whole-body, vertebrae & scale Ca content Japanese flounder (Paralichthys olivaceus) Red lip mullet (Liza haematocheila) Nile tilapia (Oreochromis niloticus) Reduced growth
Increased body deformity (short body) - closed recirculating aquaculture systems
Grouper (Epinephelus coioides) Rainbow trout (Oncorynchus mykiss) Red seabream (Pagrus major) Reduced feed efficiency & scale mineralization Delayed ossification of bone endochondral structures Reduced bone K and Mn content
White shrimp (Litopenaeus vannamei) Reduced growth, feed efficiency & survival
Table 1. Continued.
PHOSPHORUS (P) Reported deficiency signs & health impacts
Atlantic salmon (Salmo salar) Reduced growth, feed efficiency & bone mineralization, reduced whole-body P content, bone deformities and low Ca and P content of vertebrae
Black seabream (Sparus macrocephalus) Chinese sucker (Myxocyprinus asiaticus) Grass carp (Ctenopharyngodon Idella) Blue tilapia (Oreochromis aureus) Crucian carp (Carassius auratus) Red lip mullet (Liza haematocheila) Catla (Catla catla) Common carp (Cyprinus carpio) Reduced growth, feed efficiency, protein efficiency ratio & reduced bone, skin & scale mineralization
Reduced growth, feed efficiency & bone mineralization
Reduced growth & body P content Reduced growth, feed efficiency, bone mineralization, body ash and P, Ca & Mg content
Channel catfish (Ictalurus punctatus) Chum salmon (Oncorhynchus keta) Japanese seabass (Lateolabrax japonicus) Milkfish (Chanos chanos) Reduced growth & bone mineralization
Mozambique tilapia (Oreochromis mossambicus) Siberian sturgeon (Acipenser baerii) Yellow catfish (Pelteobagrus fulvidraco) European seabass (Dicentrarchus labrax) Reduced growth, feed efficiency, protein efficiency ratio & increased mortality Gibel carp (Carassius auratus gibelio var. CASIII) Reduced growth, feed efficiency, ash & fish P content Gilthead seabream (Sparus aurata) Reduced growth Haddock (Melanogrammus aeglefinus) Poor growth, loss of appetite, poor bone mineralization, deformed vertebrae and an increase in body lipid content Indian major carp (Labeo rohita) Reduced growth, feed efficiency, protein efficiency ratio, alkaline phosphatase activity & P utilization efficiency Mrigal (Cirrhinus mrigala) Reduced growth & feed efficiency Nile tilapia (Oreochromis niloticus) Reduced growth, feed efficiency & survival White shrimp (Litopenaeus vannamei) Olive flounder (Paralichfhys olivaceus) Reduced growth, feed efficiency & protein efficiency ratio Rainbow trout (Oncorynchus mykiss) Reduced growth & body P content, reduced growth, feed efficiency, bone ash, and whole-body ash contents, reduced growth & bone mineralization
Stinging catfish (Heteropneustes fossilis) Striped bass (Morone saxatilis) Reduced growth, feed efficiency, hematology (hemoglobin, hematocrit) & antioxidant status Reduced growth, feed efficiency & reduced scale, vertebral and dorsal fin mineralization, scoliosis
Sunshine bass (Morone chrysops) Tambaqui (Colossoma macropomum) Walking catfish (Clarias leather) Yellow croaker (Pseudosciaena crocea) Reduced growth & bone mineralization, tetany Reduced bone mineralization and hematology Reduced growth, protein efficiency ratio, body and vertebrae P content Reduced growth, bone mineralization & body P content
POTASSIUM (K) Reported deficiency signs & health impacts
Chinook salmon (Oncorhynchus tschawytscha) Anorexia, convulsions, tetany & death Fleshy prawn (Penaeus chinensis) Reduced growth Giant tiger prawn (Penaeus monodon) Reduced growth Grass carp (Ctenopharyngodon Idella) Reduced growth & antioxidant enzyme level Indian major carp (Labeo rohita) Reduced growth, feed efficiency, protein efficiency ratio & antioxidant enzyme levels Kuruma prawn (Penaeus japonicus) Reduced growth & protein efficiency ratio
MAGNESIUM (Mg) Reported deficiency signs & health impacts
Atlantic salmon (Salmo salar) Common carp (Cyprinus carpio)
Reduced whole body, serum and vertebrae Mg content Loss of appetite, poor growth, high mortality, sluggishness & convulsions, reduced vertebrae Mg content Grass carp (Ctenopharyngodon Idella) Reduced growth, feed efficiency & decreased whole body, vertebrae, scales and plasma Mg content, reduced growth Hybrid tilapia (Oreochromis niloticus × O. aureus) Reduced growth Kuruma prawn (Penaeus japonicus) Reduced growth Rainbow trout (Oncorhynchus mykiss) Reduced growth & electrolyte balance, reduced growth, appetite & movement, vertebral curvature & histological alterations of muscle, pyrolic caeca, and gill filaments.
Whiteleg shrimp (Litopenaeus vannamei) Reduced growth
Table 1. Continued.
IRON (Fe)
Atlantic salmon (Salmo salar) Channel catfish (Ictalurus punctatus) Red sea bream (Chrysophrys major)
Reported deficiency signs & health impacts
Reduced hematological values, liver and whole body Fe content Reduced growth, hemoglobin, hematocrit, plasma iron, transferrin saturation and erythrocyte count values Reduced mean corpuscular constants of blood and Fe content
ZINC (Zn) Reported deficiency signs & health impacts
Channel catfish (Ictalurus punctatus) Common carp (Cyprinus carpio) Grass carp (Ctenopharyngodon Idella) Reduced serum and bone Zn content, reduced growth Reduced appetite, growth & increased mortality, skin & fin erosion Reduced growth & whole body, scale, vertebrae and plasma Zn content
Grass shrimp (Penaeus monodon) Malabar grouper (Epinephelus malaricus)
Reduced growth, whole-body Zn content & non-specific immune response Reduced growth & serum, muscle, vertebrae & scale Zn content Nile tilapia (Oreochromis niloticus) Reduced growth, feed efficiency & bone Zn content, reduced growth & decreased liver, muscle, bone, and scale Zn content, reduced serum antioxidant enzymes, and altered liver histological signs (considerable nuclear migration) Orange-spotted grouper (Epinephelus coioides) Reduced growth, feed efficiency, antioxidant enzyme activity and reduced whole body and vertebrae Zn content
Rainbow trout (Oncorynchus mykiss) Red drum (Sciaenops ocellatus) Siberian sturgeon (Acipenser baerii) Yellow catfish (Pelteobagrus fulvidraco) Reduced growth, high mortality, cataract, fin & skin erosion, reduced body Zn content Reduced bone & scale Zn content Reduced growth, feed efficiency, erythrocyte & leucocyte count, hemoglobin & hematocrit value Reduced growth & feed efficiency, reduced whole body Zn content, reduced lipase & antioxidant (SOD) enzyme level
COPPER (Cu) Reported deficiency signs & health impacts
Channel catfish (Ictalurus punctatus) Cobia (Rachycentron canadum) Common carp (Cyprinus carpio) Indian catfish (Heteropneustes fossilis) Reduced liver antioxidant enzyme level Reduced growth, feed efficiency, survival & whole-body and vertebrae Cu content Reduced growth in carp& tissue Cu content Reduced growth, feed efficiency & liver antioxidant enzyme activity
Grass shrimp (Penaeus monodon)
Reduced growth, feed efficiency, protein efficiency, whole-body Cu content & non-specific immune response Malabar grouper (Epinephelus malaricus) Reduced growth & liver antioxidant enzyme activity Orange-spotted grouper (Epinephelus coioides) Reduced growth, feed efficiency & non-specific enzymes immunity Russian sturgeon (Acipenser gueldenstaedtii) Reduced growth, feed efficiency & liver antioxidant activity Snakehead (Channa punctatus) Reduced growth, feed efficiency, protein efficiency ratio, hemoglobin, hematocrit, RCBs & whole body Cu content White shrimp (Penaeus indicus) Reduced growth, survival & whole-body Cu content
Whiteleg shrimp (Litopenaeus vannamei) Reduced growth, enlarged hearts & reduced hemolymph, carapace, and hepatopancreas Cu content
Yellow catfish (Pelteobagrus fulvidraco) Yellow croaker (Larimichthys croceus) Reduced growth & whole-body and liver Cu content Reduced growth, total antioxidant activity & whole-body and vertebrae Cu content
MANGANESE (Mn) Reported deficiency signs & health impacts
Atlantic salmon (Salmo salar) Cobia (Rachycentron canadum)
Common carp (Cyprinus carpio) Grass carp (Ctenopharyngodon Idella) Reduced whole-body Mn content & liver oxidation enzyme activity Decreased growth, feed efficiency, survival, whole-body, vertebrae & liver Mn content & decreased liver antioxidant enzyme activity Reduced growth Reduced growth, feed efficiency & whole body, vertebrae and skin Mn content
Hybrid grouper
Reduced growth, feed efficiency, protein efficiency ratio, whole-body, liver and vertebrae Mn content, (Epinephelus lanceolatus × E. fuscoguttatus) reduced antioxidant enzyme activity, and increased oxidative stress Hybrid tilapia (Oreochromis niloticus × O. aureus) Reduced liver, bone and muscle Mn content & reduced liver antioxidant enzyme activity Rainbow trout (Oncorynchus mykiss) Reduced growth, abnormal tail growth, short body dwarfism Whiteleg shrimp (Litopenaeus vannamei) Reduced growth Yellow catfish (Pelteobagrus fulvidraco) Reduced growth & feed efficiency, decreased whole-body Mn content & decreased liver antioxidant activity Yellow croaker (Larimichthys croceus) Reduced growth, feed efficiency, whole-body, liver and vertebrae Mn content, reduced antioxidant enzyme activity, and increased oxidative stress
Table 1. Continued.
SELENIUM (Se) Reported deficiency signs & health impacts
Atlantic salmon (Salmo salar) Channel catfish (Ictalurus punctatus) Reduced plasma antioxidant (Glutathione Peroxidase - GPx) enzyme activity Reduced growth & liver and plasma antioxidant enzyme activity
Cobia (Rachycentron canadum) Reduced growth, feed efficiency, survivak & whole-body and vertebrae Se content, and reduced
antioxidant enzyme activity Gibel carp (Carassius auratus gibelio var. CASIII) Reduced growth & antioxidant capability Japanese seabass (Lateolabrax japonicus) Rainbow trout (Salmo gairdneri) Reduced growth Malabar grouper (Epinephelus malabaricus) Reduced growth, reduced growth, feed efficiency & liver antioxidant enzyme activity Nile tilapia (Oreochromis niloticus)
Yellow croaker (Larimichthys croceus) Reduced growth & antioxidant capability, reduced growth, feed efficiency, survival & antioxidant enzyme activity Reduced growth & whole-body and vertebrae Se content, reduced total antioxidant activity
CHROMIUM (Cr)
Common carp (Cyprinus carpio) Grass carp (Ctenopharyngodon)
Indian major carp (Labeo rohita) Nile tilapia (Oreochromis niloticus) Rainbow trout (Oncorhynchus mykiss)
Reported deficiency signs & health impacts
Reduced growth & carbohydrate utilization Reduced growth, feed efficiency, protein efficiency ratio, protein retention, and altered carbohydrate & lipid metabolism Reduced growth, feed efficiency, protein efficiency ratio & apparent net protein utilization Reduced growth Reduced immune response, reduced growth & feed efficiency
Due to space limitations Cobalt and Iodine were removed from the Table.
Notwithstanding the above-reported mineral deficiency signs, it should be stated that the majority of these studies were performed with animals fed semi-purified experimental diets (so as to elicit a deficiency response), and as such may not be applicable to animals fed practical diets. Animal and marine feed ingredient sources usually being richer sources of essential minerals and trace elements, compared with plant feed ingredient sources where many minerals and trace elements are usually less biologically available. This difference between animal and plant feed ingredient sources is particularly important for marine protein (ie. fishmeal) dependent cultured species, and the necessity to reduce their dependency on these finite feed resources with alternative terrestrial land animal and plant-based feed ingredient sources.
As a general rule, animals reared under nutrient-poor freshwater environments are more likely to require dietary mineral and trace element supplementation than animals reared under marine culture conditions, and as such feeds should be formulated using a dietary mineral and trace element premix. Moreover, in view of the pro-oxidant properties of many inorganic mineral salts, it would be advisable to use minerals chelated to organic molecules (such as specific amino acids or microorganisms) so as to maximize biological availability, and at the same time, limit unwanted biological interactions and nutrient leaching in the case of soluble inorganic mineral salts.
As with other dietary essential nutrients, many minerals and trace elements have important functional properties, and as such, these minerals may require higher dietary fortification for maximum health and immune response, and in particular the immunestimulating trace elements zinc, copper, manganese, selenium and chromium.
However, it is also important to mention here that most minerals and trace minerals may exert a negative effect on fish/shrimp growth and health if supplied in excess of dietary requirement, either due to direct toxicological effects or due to negative interactions with other minerals. For example, an excess of dietary calcium (calcium carbonate or limestone often being used as an inexpensive filler in aquafeeds) has been reported to exert a negative effect on the bone mineralization and the biological availability of other essential minerals, including P, Mg, K, Zn, Mn, and Fe. As a general guideline, the dietary Ca:P ratio should be kept at about <2:1.


