21 minute read
GENETICS


Genetics and Breeding You can’t know where you’re headed if you don’t consider where you’ve been, or …how our path up to now has led us to this new frontier
C. G. Lutz / Louisiana State University Agricultural Center
Nonetheless, most advances in genetic improvement can still be understood within a framework of traditional approaches, in particular improvement through selection of superior breeding stock. Current research in aquaculture genetics and genomics involves a great number of topics, ranging from control of phenotypic sex to genomic-based selection to up- and/ or down-regulation of specific genes in response to disease or nutritional conditions. Not to mention the new and occasionally frightening frontier known as Crispr/Cas9.
Identifying distinct populations, strains and individuals To this day, one of the most practical approaches to identifying suitable hatchery stock involves the use of population genetics analyses. Historically, researchers used genetic markers like mitochondrial DNA (found in the energy-producing mitochondria inside each cell, and inherited maternally) and microsatellites (small, variable sequences of bases scattered throughout chromosomes between functional genes) to look for genetic differences between populations, both wild and farmed. An important aspect of using these techniques was the choice of markers, in order
Some 10 or 15 years back, it was fairly easy to discuss the application of traditional animal and plant breeding technology to aquaculture species. Today, molecular methods and biotechnology are advancing so rapidly that by the time one understands the science, it has already evolved.
to properly discriminate between groups.
Population genetics is certainly useful in identifying unique wild populations of species of interest, and in showing how captive populations can diverge over time as a result of selection, inbreeding or genetic drift. Now, however, much of this work involves a molecular technique commonly referred to as GBS, which stands for genotyping by sequencing. And just as early population genetics tools were adapted for use in improvement programs, GBS has that potential as well. GBS is a cheaper way to look at multiple markers simultaneously, but sometimes it relies on reading one strand of the chromosome’s doublehelix. It’s a numbers game to be sure you aren’t missing something on the other strand, so more is better.
Unfortunately, many industry observers are of the opinion that GBS, while cheaper than more traditional methods, is still far too costly for practical application in selection programs for aquaculture species. Additionally, large numbers (>1000) of animals are required to make this technique applicable for most species. Luckily, prevailing trends suggest costs will continue to fall over time so hopefully the industry will be poised to adopt this technology when the time is right.
Genomics Genomics refers to a wide range of methods, but the fundamental philosophy is to look at how individual genes interact. In the past, researchers were forced to look at individual genes one at a time in spite of the fact that most traits of economic importance in aquaculture are controlled by many genes. The more genes that can be included in a genomic analysis, the clearer the picture becomes as to what is going on within an organism. Genome sequencing, or deciphering the order of specific nucleotides (A’s, C’s, G’s and T’s) along a strand of DNA, is involved in most genomics studies. In aquaculture species, genome technology is being used to investigate disease resistance, sterility and other important traits.
One example of this approach as applied to the flatfish Cynoglossus semilaevis in China was recently published (Zhou et al. 2019, https://doi. org/10.3389/fgene.2019.01167). The authors used genome-wide association mapping to investigate mechanisms of disease resistance, and found 33 single nucleotide polymorphism (SNP) markers associated with disease resistance. The SNP with the strongest association with resistance was found on chromosome 17, near a major quantitative trait locus (see Selection discussion below). Results
Current research in aquaculture genetics and genomics involves a great number of topics, ranging from control of phenotypic sex to genomic-based selection to up- and/or down-regulation of specific genes in response to disease or nutritional conditions. Figure 1
An example of how genetic markers tend to track with important loci. In this example, the chromosome segments in the individual shown in the center of the diagram originated from its Dam and Sire. The segment inherited from the dam was transmitted without crossing over, such that both the blue allele for locus one (L1) and the yellow allele for locus 2 (L2) were inherited together. In contrast, the chromosome segment inherited from the sire is the result of crossing over: the association of the green allele at locus 2 and the blue allele at locus one is altered through a crossing over event, with the individual in question inheriting a new combination of L1 and L2 alleles. Although any number of combinations of alleles from the two loci seems possible with crossing over (the blue allele for L1 occurs with yellow, green and red alleles at L2), the markers are much more closely associated with the alleles at L1, with little possibility of separation due to crossing over of chromosome pairs.

indicated that several other genes also appeared to influence disease resistance, and some appeared to be regulated by epigenetic control (outside factors).
Another recent study involved the use of genomic tools to identify resistance to bonamiosis in European flat oysters (Ostrea edulis) (Vera et al. 2019 https://doi.org/10.1111/eva.12832). They examined three long-term affected oyster beds, comparing them with populations from three naïve beds, and detected a set of 22 SNP markers within a single region of the genome suggesting the presence of a locus with a major quantitative influence over Bonamia resistance. As a bonus, the researchers were also able to identify 84 discriminative markers to differentiate oyster populations.
A more ‘invasive’ form of genomic technology involves literal editing of the nucleotides on a strand of DNA in order to remove or create new gene variants. The most widely recognized method to accomplish this is known as Crispr/Cas9. This can be a somewhat informed process, but it can also involve a “let’s snip this section and see what happens” technique. Sequencing genomes can shed light on where specific ‘genes’ are located on the chromosomes and how they are written, but this activity also provides a first step in the tinkering process.
In recent years, Crispr/Cas9 has been used to knock out the dead end (dnd) gene in Atlantic salmon in Norway. The dnd gene encodes an RNAbinding protein that is required for migration and survival of primordial germ cells. In the absence of dnd, primordial germ cells in embryos fail to acquire motility, lose specific marker gene expression, and die. So, no germ cells = no reproduction. Crispr/Cas9 has also recently been used to genetically alter the color of Mozambique tilapia in Singapore.The gene that codes for black / golden color (PMEL17) was transformed with an insertion that ultimately inhibited the deposition of skin pigment.
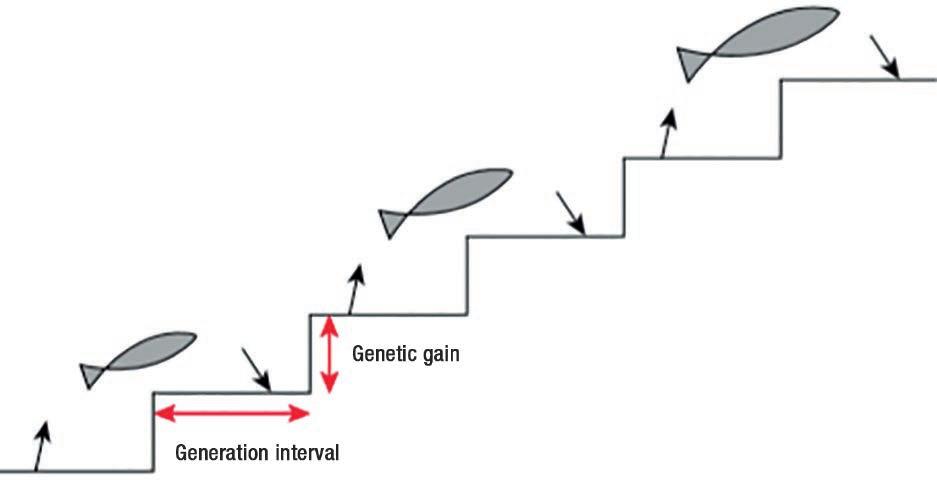
Selection Some genetic attributes are heritable, and transmitted directly from parents to offspring, while others are the re

Figure 2
A Manhattan Plot, illustrating the positions and impacts of multiple sites on a series of chromosomes. These plots are widely used for Genome-Wide Association Studies (GWAS). While numerous locations on all chromosomes appear to be related to some degree to the trait in question, only chromosomes 4, 7, 13 and 15 appear to have significant effects, with a number of associated locations on chromosome 13.
sult of specific combinations of parents and cease to exist once chromosome pairs are pulled apart to form gametes. A long-utilized approach to estimating the heritability of traits of interest involves the production of large numbers of families, some with one parent in common and some with both parents in common. This allows a statistical comparison of animals that share only one parent (and therefor the genetic effects transmit
Genomics refers to a wide range of methods, but the fundamental philosophy is to look at how individual genes interact. In aquaculture species, genome technology is being used to investigate disease resistance, sterility and other important traits.
ted directly from a single individual) and those that share both parents (sharing both the direct effects AND those that result from combinations). In the old days, we had to use physical markings like tags or cold brands to identify individual fish. Modern molecular methods make it possible to use specific genetic markers that can reliably identify an individual’s parents. This has allowed these types of designs to be conducted without having to keep track of which animals are from which families, since this can be determined at the end of the study. So, once again, the same concept but with better tools.
The underlying struggle in genetic improvement of aquatic species through selection has always involved the need to determine which animals are actually “superior.” This is because only part of the performance we observe (be it growth,

disease resistance, feed conversion or some other trait of interest) is attributable to the genetic makeup of the organism. The rest is attributable to random effects that are difficult to control, or even quantify. As a result, some truly superior animals may appear to be average at best, while some animals that appear to be superior may not actually possess the genes required to improve the subsequent generation. Over time, animal breeders adopted the use of pedigrees and family information to better predict the genetic worth of livestock and this approach was adopted for aquatic species such as salmon. Accuracy improved, but there was still a lot of ‘noise’ in the assessment of breeding values.
A large portion of the genetic research going on in aquaculture at this time is focused on trying to obtain more accurate assessments of the genetic ‘worth’ of individual animals, in order to improve the efficiency of the selection process. Over the past several decades, a number of approaches have been borrowed from traditional animal and plant breeding to address this issue. One tried and true method is Marker Assisted Selection, or MAS. Marker assisted selection is based on the identification of specific sequences of DNA that are associated with traits of interest. These markers are physically associated with important genes, in close proximity on the same chromosomes. All the genes on a chromosome are not inherited as a package and passed down together from parent to offspring. To the contrary, the two chromosomes in a pair can (and do) “cross over,” making contact and subsequently separating while exchanging portions of double-helix in the process. However, the closer two points (two genes, two markers, or a gene and a marker) are on a chromosome, the less likely it is that a random crossover event will occur in between them, so they will tend to be inherited together. Although it may be difficult to isolate the specific genes associated with superior performance for any given trait, it is comparatively easy to identify markers that tend to track with those genes both within populations and across generations. Hence the term MAS, and this approach can be extended to search for Quantitative Trait Loci (QTL’s), specific gene locations on chromosomes (loci), which have significant influence over traits even when a number of other loci are also involved. Once the locations of the markers on the chromosomes are known, researchers can have a general idea of where the important QTL’s are. If the impacts of QTL’s are large, only a handful are needed to greatly accelerate selection programs. As GBS technology has evolved and costs of genome sequencing and genotyping have gone down, genomic principles have been applied to allow for “genomic selection.” In this method, an evaluation of all (or at least, most) genes influencing a trait can be undertaken, taking into account both the direction (high vs low, better vs worse) and the magnitude of the individual genes in order to estimate a ‘breeding value’ (the projected performance of offspring) for the individual in question. In many species, this approach has been shown to greatly improve the accuracy of predicting the genetic ‘worth’ of an individual. Once more, the underlying principles of selection are unchanged, but the tools available are a significant improvement.
Now, back to Crispr/Cas9. The logical progression from gene editing (discussed above) to practical application involves… yes, you guessed it! selection. A group from the Netherlands recently examined this process (Bastiaansen et al., https://www.jcu. edu.au/international-symposium-ofgenetics-in-aquaculture/our-committee) and reported that if a disease resistance allele could be introduced into a population with only a 1% success rate of genome editing, the fre
The underlying struggle in genetic improvement of aquatic species through selection has always involved the need to determine which animals are actually “superior.” This is because only part of the performance we observe is attributable to the genetic makeup of the organism.
quency of the new allele would reach a mere 1% if only 6 families were edited. However, with moderate selection for the allele, its frequency would reach almost 100% in the population after 13 generations. This goal could be reached in only 6 generations of selection if all families were initially edited and the success rate was 10%. This, however, is a simplified example because most traits of importance in aquatic species are controlled by many distinct genes scattered across the chromosomes. And it is for this very reason that, for the foreseeable future, genomics will continue to provide aquaculture with useful tools to advance the identification of key loci and chromosome segments involved in all sorts of commercially important traits.
Dr. C. Greg Lutz is the author of the book Practical Genetics for Aquaculture and the Editor in Chief at Aquaculture Magazine. Professor and Specialist with the LSU AgCenter editorinchief@dpinternationalinc.com
TILAPIA, PANGASIUS AND CHANNEL CATFISH UPDATES FROM URNER BARRY
By: Lorin Castiglione, Liz Cuozzo *
Tilapia Total tilapia imports for September grew by 9.5 percent, while on a YTD basis overall volume across all categories had fallen 4.6 percent compared to 2018 totals. Fresh categories were imported less this September, while frozen markets saw gains.
Imports of Whole Fish Tilapia As of September, imports of frozen whole fish had increased by 21.1 percent, totaling 10.6 million pounds. Monthly volume had been increasing month-over-month since March. On a YTD basis 2019 imports were 5 percent above the same 2018 timeframe, totaling 68.3 million pounds for January through September volumes. Looking at cyclical behavior of import volume, September 2019 was 54.1 percent above the previous 3-year average for the month of September.
Imports of Fresh Tilapia Fillets Imports in September diminished again, falling 5 percent from the previous month and 12.9 percent from the same month last year. Imports from Honduras, the largest supplier of this commodity to the U.S. market, were 6.6 percent lower through September compared to the same period last year, while Colombia YTD volumes fell 17.4 percent. Total imports of this commodity were 6 percent lower on a YTD basis through September with the entire year falling under the three-year average.
Fresh Tilapia Fillet Pricing From a replacement cost basis, as well as the adjustments made to the weighted import price per pound (which includes only the top five suppliers), we found that the September figure of $2.67 fell $0.05 per pound from the previous month and was the lowest import price on record since June 2017.
Imports of Frozen Tilapia Fillets September 2019 imports of frozen tilapia fillets gained 7.5 percent from the previous month, totaling 23.2 million pounds. Volume was 1.3 percent above the previous 3-year average of 22.9 million pounds. Looking at YTD totals, 2019 was tracking 7.5 percent below 2018 volumes, by 13.8 million pounds.
Frozen Tilapia Fillet Pricing Replacement prices fell $0.12 in September to the lowest price of the year, at $1.54 per pound. With replacement costs depreciating and wholesale price strengthening slowing, the ratio of these two numbers

adjusted to 1.35. Wholesale prices are currently at an average of $2.13 per pound.
Frozen Analysis & Other Inputs YTD weighted replacement costs fell $0.03 to $1.69 for January through September timeframe, registering $0.03 lower than the value from this time last year. YTD import volume still falls below previous years and is the lowest on record since 2008 brought in 150.9 million pounds for the same timeframe.
Pangasius and Channel Catfish September imports of Pangasius re

mained somewhat steady, falling less than 2 percent. However, compared to the same month a year ago, imports fell 72.6 percent, while on a YTD basis 2019 volume tracked 32.3 percent lower. Frozen channel catfish fillet imports fell 25 percent from the previous month, and compared to the same month a year ago, volume was down 54.6 percent.
Imports of Frozen Channel Catfish (Ictalurus) Fillets Imports of frozen channel catfish fillets fell again in September, down 25 percent or 169,525 pounds from the previous month, totaling 507,479 pounds. Compared to the 5-year average, September registers 22 percent below average. On a YTD basis, the January through September total was the lowest on record since 2011.
Shipments in September entered the U.S. with a declared value of $2.32 per pound, falling $0.13 from the previous month, but down by $0.31 cents when compared to the September 2018 value of $2.63. Currently, prices are averaging $4.03 with reports the market could continue to strengthen throughout the end of Q4.
Imports of Frozen Pangasius (Swai) Fillets September imports of frozen pangasius fillets fell slightly from the previous month, down 1.9 percent and totaling 6.7 million pounds. September 2019 was the lowest volume September since 2008. Looking at cyclical behavior of total imports, September fell 66.5 percent below the previous 3-year average for the month (20.1 million pounds). European data still runs through August 2019 recording 12.5 million pounds. On a YTD basis, the U.S. had fallen 33.4%, while Europe was up 4.5 percent compared to 2018. Historically, the U.S. imports more volume of pangasius than Europe, but this trend has switched ever since March of this year.
According to data from the USDOC, replacement prices for September 2019 fell $0.09 per pound from the previous month, recording at $1.49, the lowest price of the year. The replacement cost we publish from the USDOC is not Delivery Duty Paid (DDP); therefore, if we are to properly assess this cost we must add extra to this price per pound. If diminishing demand wasn’t causing prices to weaken, it was industry players discounting product in order to take advantage of the much lower import prices now being offered overseas.
Shrimp UPDATES FROM URNER BARRY
By: Jim Kenny, Gary Morrison *
U.S. Imports All Types, By Type September imports showed a 1.1 percent decline in total volume, but the nine-month total remained 1.1 percent ahead of Jan-Sep 2018.
Of the U.S.’s top seven trade partners, India (+11.4%), Indonesia (+5.6%), Vietnam (+8.2%) and Mexico (+72.9%) shipped more. Meanwhile, Ecuador (-2.4%), Thailand (-11.1%) and China (-70.4%) sent less shrimp to the U.S. In terms of product form, the U.S. continued to import more headless shell-on, which includes easy peel, (+1.1%) and peeled (+3.6%); but continued to import less cooked (-22.6%) and breaded (-13.1%).
U.S. Shrimp Imports by Country (All Types) India: The relevance of India continues to increase as their share of total shrimp imports for the month of September widened to over 43 percent. They shipped an additional 11.4 percent compared to the same time last year and as year-over-year gains widen, a new record is within reach. In fact, year-to-date imports in 2019 were up 13 percent and on pace to smash through 600 million pounds. Indonesia: For the fifth consecutive month, imports from Indonesia advanced (+5.6%) from last year, narrowing the overall YTD figure, which was still slightly below 2018. Indonesia accounted for nearly 17 percent of the monthly total, a good frame of reference to see how the number one and two importers stack-up.
Ecuador: Imports from Ecuador continued to decline when compared to last year. Products brought in from this country were 2.4 percent lower and shell-on (-5.1%) and peeled (-7.5%) declined.
Thailand and Vietnam: Monthly imports for September were higher for Vietnam (+8.2%) but lower for Thailand (-11.1%). China saw a very steep decline (-70.4%) as well. This was driven by African Swine Fever related buying in this region.
Shell-On Shrimp Imports, Cyclical & by Count Size Headless Shell-On Imports, including easy peel edged 1.1 percent higher in September than the same month last year. Replacement values (import $/lb.) for HLSO shrimp continued higher as prices overseas have seen significant rises. With China such a heavy buyer of all protein, this is becoming a common theme in the


market. The average for the month was $3.80 per pound, up $0.04 per pound from last month, and $0.18 per pound above last year.
Value-Added, Peeled Shrimp Imports Peeled and deveined shrimp continued to find support among buyers. Imports in the month of September were 3.6 percent higher than last year despite falling month-to-month. Replacement values for peeled shrimp also increased by $0.09 per pound to $4.05 for September. Cooked (warm water) imports continued to be pressured lower. September figures declined 22.6 percent from last year, with broad-based losses. India was the only positive country. Breaded imports were also lower, coming in at 13.1 percent below 2018 numbers.
Shrimp Price Timelines; Retail Ads Retail: Now that the calendar has turned, there is increased focus on shrimp at retail. Buying opportunities in September increased nearly 16 percent from August, and over 21 percent from last year. The average price also increased to $7.56 per pound.
U.S. Shrimp Supply & Gulf Situation Pricing has been quite scattered and largely reflective of an individual company’s position in the market, but the averages generally suggest strength and therefore premiums have surfaced throughout the complex. Supplies are limited and replacement pricing is rising. Monthly Gulf Coast landings continued to fall short of year earlier figures. The National Marine Fisheries Service reported September 2019 landings (all species, headless) of 9.041 million lbs. compared to 10.322 million in September 2018. The YTD landings were at 57.4 million pounds, versus 71.1 million pounds in 2018.
Upcoming
aquaculture events
2020 JANUARY 2° CIAC – INTERNATIONAL SYMPOSIUM OF SHRIMP AQUACULTURE Jan. 23 – Jan. 24 Sonora, Mexico T: +52 1 331 466 0392 E: crm@dpinternationalinc.com W: www.panoramaacuicola.com
FEBRUARY AQUACULTURE AMERICA 2020 Feb. 09 – Feb. 12 Honolulu, Hawaii T: +1 760 751 5005 E: worldaqua@aol.com W: www.was.org
JUNE WORLD AQUACULTURE 2020 Jun. 08 – Jun. 12 Singapore, Singapore T: +1 760 751 5005 E: worldaqua@aol.com W: www.was.org
AUGUST WAS NORTH AMERICA & AQUACULTURE CANADA 2020 Ago. 30 – Sep. 02 St John’s Newfoundland, Canada T: +1 760 751 5005 E: worldaqua@aol.com W: www.was.org
NOVEMBER RASTECH 2020 Nov. 16 – Nov. 17 South Carolina, USA. T: +1 760 751 5005 E: worldaqua@aol.com W: www.ras-tec.com
SEPTEMBER WORLD SEAFOOD INDUSTRY 2020 Sep. 23 – Sep. 25 Guadalajara, Jalisco, Mexico T: +52 1 331 466 0392 E: crm@dpinternationalinc.com W: www.panoramaacuicola.com
AQUACULTURE EUROPE Sep. 29 – Oct. 02 Cork, Ireland T: +1 760 751 5005 E: worldaqua@aol.com W: www.was.org
AERATION EQUIPMENT, PUMPS, FILTERS AND MEASURING INSTRUMENTS, ETC AQUATIC EQUIPMENT AND DESIGN, INC.....................................31 522 S. HUNT CLUB BLVD, #416, APOPKA, FL 32703. USA. Contact: Amy Stone T: (407) 717-6174 E-mail: amy@aquaticed.com DELTA HYDRONICS LLC...............................................................69 T: 727 861 2421 www.deltahydro.com MDM INC.....................................................................................25 T: 1 800 447 8342 E-mail: sales@mdminc.com www.pmdminc.com ANTIBIOTICS, PROBIOTICS AND FEED ADDITIVES LALLEMAND ANIMAL NUTRITION................................................35 Contact: Bernardo Ramírez DVM Basurto. T: (+52) 833 155 8096 E-mail: bramirez@lallemand.com www.lallemand.com EVENTS AND EXHIBITIONS AQUACULTURE AMERICA 2020..............................................33 February 09 – 12, 2020. Honolulu, Hawaii T: +1 760 751 5005 E: worldaqua@aol.com W: www.was.org GUATEMALA AQUALCULTURE SYNPOSIUM 2020.....................1 May 07 – 09, 2020. Santo Domingo del Cerro, La Antigua Guatemala, Guatemala. E: simposiodeacuiculturagt@agexport.org.gt W: www.simposio.acuiculturaypescaenguatemala.com
advertisers Index
INFORMATION SERVICES
AQUACULTURE MAGAZINE...................63, INSIDE COVER, INSIDE BACK COVER Design Publications International Inc. 203 S. St. Mary’s St. Ste. 160 San Antonio, TX 78205, USA Office: +210 504 3642 Office in Mexico: +52(33) 8000 0578 - Ext: 8578 Subscriptions: iwantasubscription@dpinternationalinc.com Sales & Marketing Coordinator. Juan Carlos Elizalde crm@dpinternationalinc.com | Cell: +521 33 1466 0392 Sales Support Expert, Claudia Marín sse@dpinternationalinc.com | Cell:+521 333 968 8515
AQUAFEED.COM..........................................................................57 Web portal · Newsletters · Magazine · Conferences · Technical Consulting. www.aquafeed.com URNER BARRY........................................................................79 P.O. Box 389 Tom Ride. New Jersey, USA. Contact: Steven Valverde. T: (732)-575-1967 E-mail: svalverde@urnerbarry.com PANORAMA ACUÍCOLA MAGAZINE Empresarios No. #135 Int. Piso 7 Oficina 723 Col. Puerta de Hierro, C.P.45116 Zapopan, Jal. México Office: +52 (33) 8000 0578 Contact 1: Subscriptions E-mail: suscripciones@panoramaacuicola.com Office: +52 (33) 8000 0629 y (33) 8000 0653 Contact 2: Juan Carlos Elizalde, Sales & Marketing Coordinator. crm@dpinternationalinc.com | Cell: +521 33 1466 0392 Contact 3: Claudia Marín, Sales Support Expert E-mail: sse@dpinternationalinc.com www.panoramaacuicola.com
TANKS AND NETWORKING FOR AQUACULTURE REEF INDUSTRIES..................................................................37 9209 Almeda Genoa Road Z.C. 7075, Houston, Texas, USA. Contact: Gina Quevedo/Mark Young/ Jeff Garza. T: Toll Free 1 (800) 231-6074 T: Local (713) 507-4250 E-mail: gquevedo@reefindustries.com / jgarza@reefindustries.com / myoung@reefindustries.com www.reefindustries.com