3 minute read
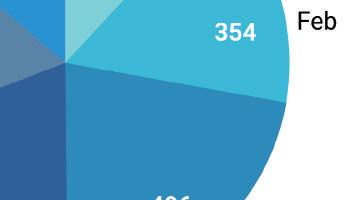
KEY BISCAYNE JAN-JUNE PERIOD


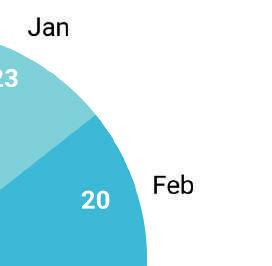
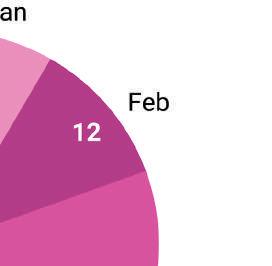
CONDOS/TOWNHOMES $1M+ CONDOS/TOWNHOMES
2023
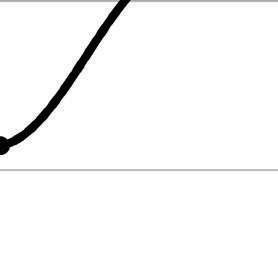
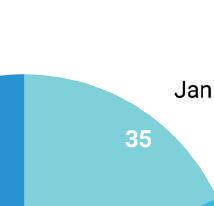
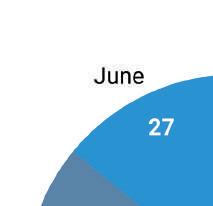
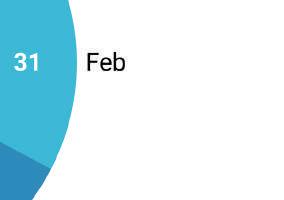
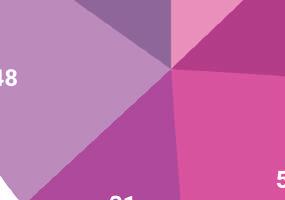
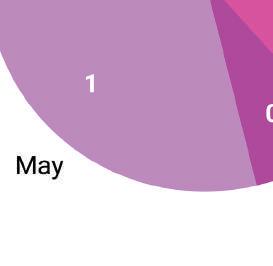
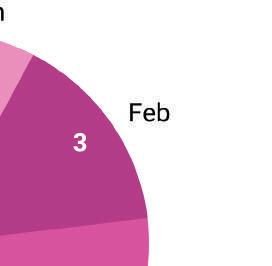
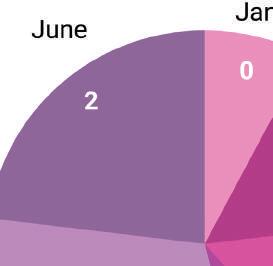
AVG. SALES BY MONTH
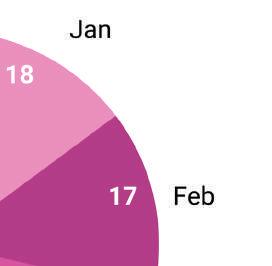
Total number of sales: 108
2022
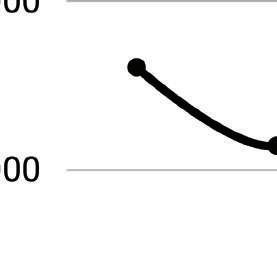
AVG. SALES BY MONTH
Total number of sales: 161


2023
AVG. SALES BY MONTH
Total number of sales: 76
2022
AVG. SALES BY MONTH


Total number of sales: 114

- Excluding previous year boom, average sales prices are at historic levels. They are up an astounding 67% from pre-Covid 2019
- The average sales price has decreased by 2.7%, bringing it to new record levels of $5,379,743 except for the average sales prices seen during last year’s housing boom
-The average sales price per square foot for all homes slipped 5% to $1,277/SF and for $1M+ homes by 8% to $1,323/SF
- Number of home and $1M+ home sales declined year over year
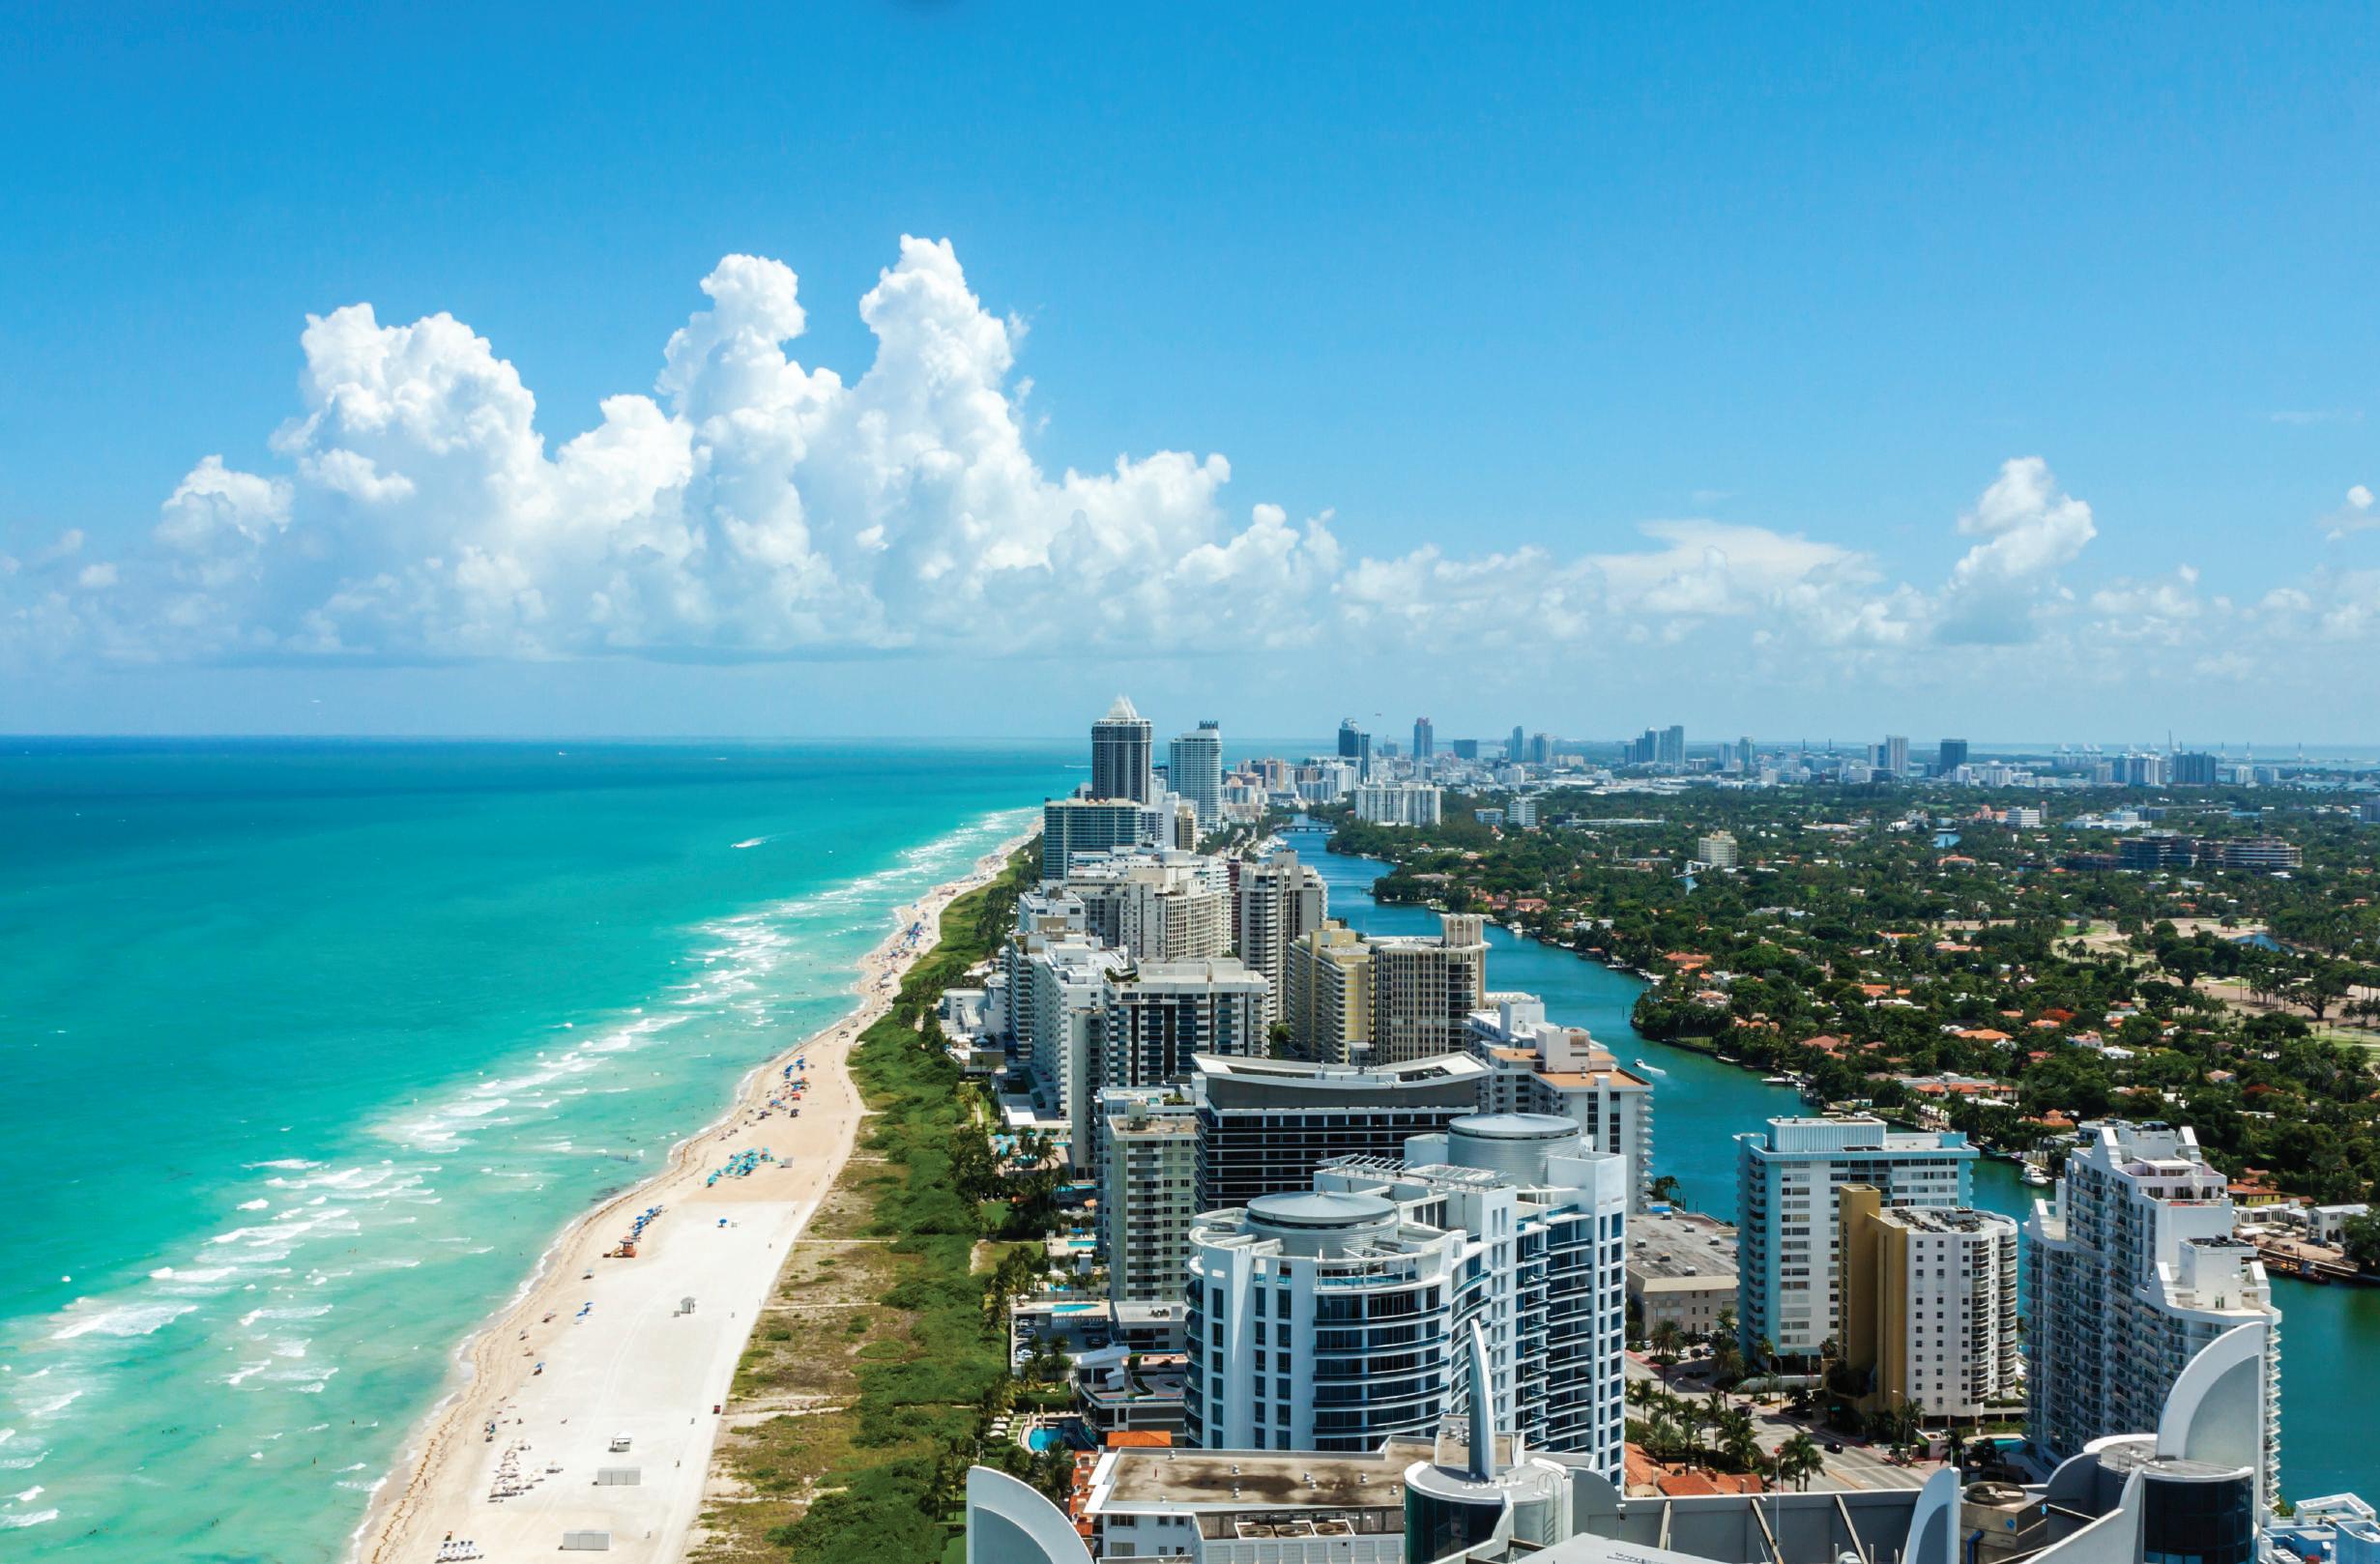
Miami Beach Average Sales Price


Excluding previous year boom, average sales prices are at historic levels. They are up an astounding 67% from pre-Covid 2019. In the $1M+ market, they are up from 23% from 2019. In the $1M+ home category, 4 bedrooms now trade 23% higher than 5 beds did in 2019.
MIAMI BEACH JAN-JUNE PERIOD
SINGLE-FAMILY HOMES
The average sales price for all single-family homes slipped 2.7% from previous year and 6.5% for the $1M+ sector. Average sales prices are also down but have attained unprecedented heights post pandemic frenzy. Days on the market rose.
SINGLE-FAMILY HOMES

Miami Beach
JAN-JUNE PERIOD

SINGLE-FAMILY HOMES $1M+ SINGLE-FAMILY HOMES


2023
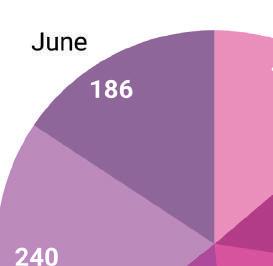
AVG. SALES BY MONTH
Total number of sales: 122
2022
AVG. SALES BY MONTH
Total number of sales: 214


2023
AVG. SALES BY MONTH
Total number of sales: 115
2022

AVG. SALES BY MONTH


Total number of sales: 192
Miami Beach Average Sales Price


The real estate market for condos and townhomes in Miami Beach is beginning to readjust following the impact of the pandemic, yet it continues to exceed the levels seen before the pandemic.The average sales price is now $814,000 for a one bedroom. Conversely, two bedrooms in the $1M+ condo/townhome sector now trade at $2,563,847.
MIAMI BEACH JAN-JUNE PERIOD
Sales volume is returning to normalcy after the Covid-19 frenzy, with the number sold reduced by 50%. Pace of market for all condos has quicken, reducing the average days on market by nearly 23%. In the $1M+ category, there is a 6.7% increase in average days on market. Average sales price per square foot for all condos/townhomes sold is up 3.1% the previous period in 2022.
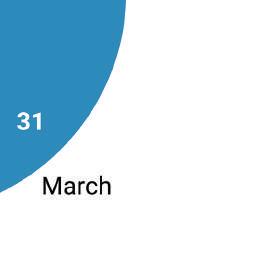
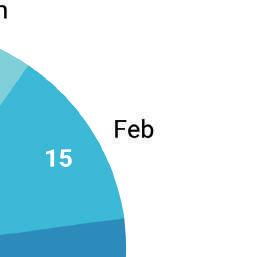
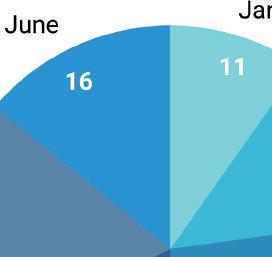
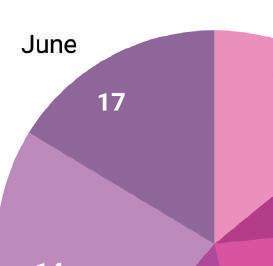
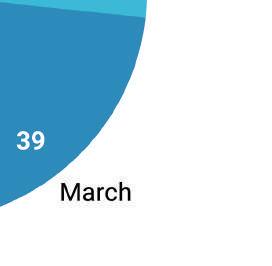
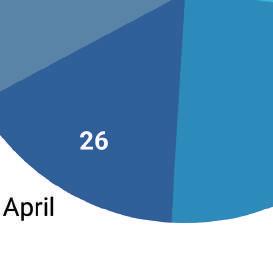
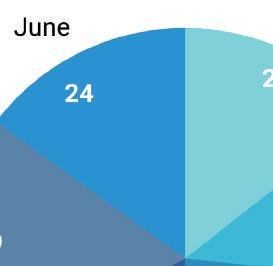
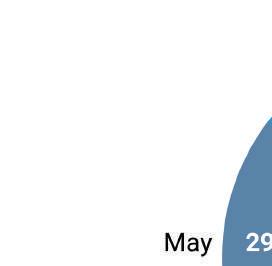
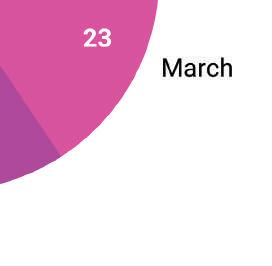
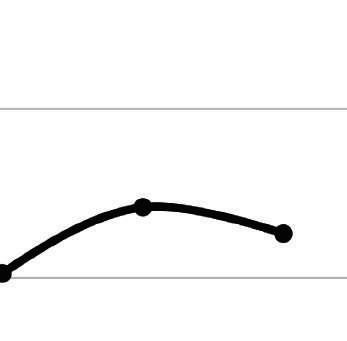
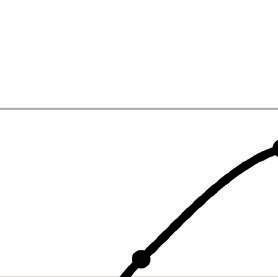
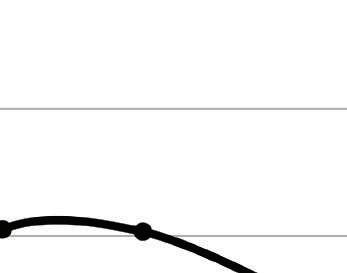
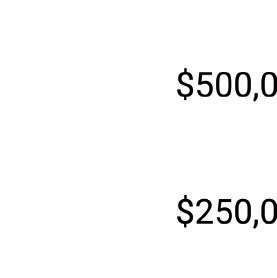
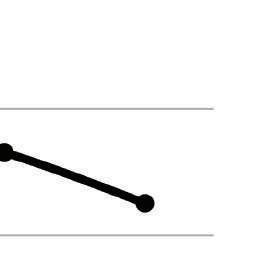
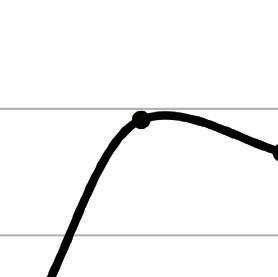
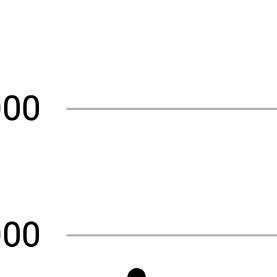
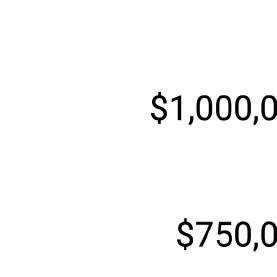
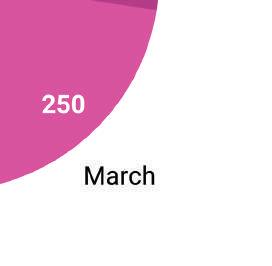
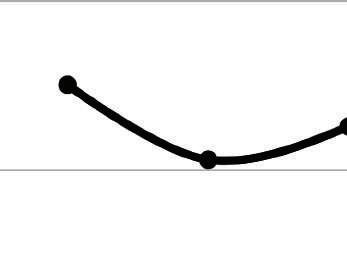
(right) Sales reached reached their peak in March, with the average price being around $1.1 million. Luxury condos priced at $1 million or more also peaked in March, with an average sales price of $3.4 million. It is worth noting that the average selling price for all Miamii-Dade county condos sold during the same period in 2023 was $409,000.
Total number of sales: 1,191


CONDOS/TOWNHOMES
AVG. SALES BY MONTH
CONDOS/TOWNHOMES 2023 AVG. SALES BY MONTH


AVG. SALES BY MONTH

-The average sales prices is up 65% from 2022, and nearly 95% before pandemic
- A significant reduction in the average number of days it takes to sell a property of almost 70%

-Average sales price per square foot increase of 53%
- The Palm & Hibiscus Islands real estate market has seen a 37% decrease in sales due to increased price gains and limited inventory

PALM, HIBISCUS & STAR ISLANDS MIDYEAR HIGHLIGHTS
& STAR ISLANDS AVERAGE SALES PRICE


PALM,
We have narrowed down the comparisons to Palm and Hibiscus Islands. Star Island, which has just 34 estates on the island, rarely if ever has a property available for sale. When there are no sales, it’s not because the property didn’t sell, but rather because there was no inventory in the first place. As a result, there is limited data for a comprehensive analysis.
PALM, HIBISCUS & STAR ISLANDS JAN-JUNE PERIOD
The trio of Palm, Hibiscus, and Star Islands, have consistently shown outstanding performance. Amidst the Covid pandemic, their value skyrocketed. The average sales price of Palm and Hibiscus Islands surged by almost 65% compared to the same period in 2022. Days on market cut by nearly 69%.
(Note) Not enough data for Star Island to provide meaningful comparables or charts.

PALM, HIBISCUS & STAR ISLANDS
Average Sales Price


SINGLE-FAMILY
Price trend indicators for Palm & Hibiscus Islands reveal that there has been a significant 65% year-on-year increase. It is important to note that months with no sales should not be considered for comparative analysis.


SINGLE-FAMILY
-The average sales prices is up 65% from 2022, and nearly 95% before pandemic
- A significant reduction in the average number of days it takes to sell a property of almost 70%
-Average sales price per square foot increase of 53%
- The Palm & Hibiscus Islands real estate market has seen a 37% decrease in sales due to increased price gains and limited inventory