1 minute read
BRICKELL MIDYEAR HIGHLIGHTS


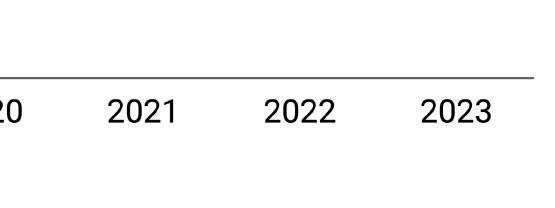
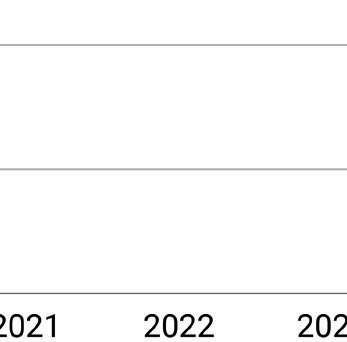
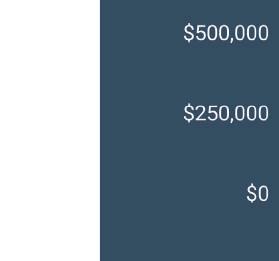
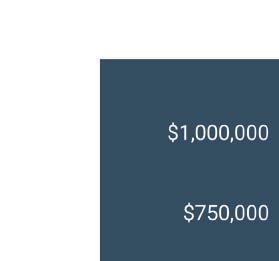
Brickell Average Sales Price

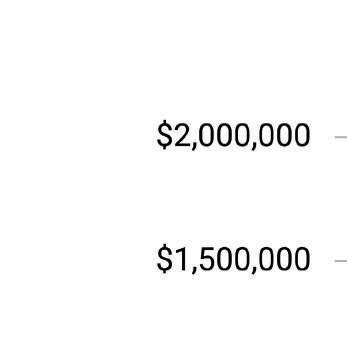

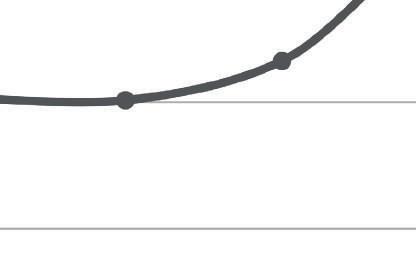
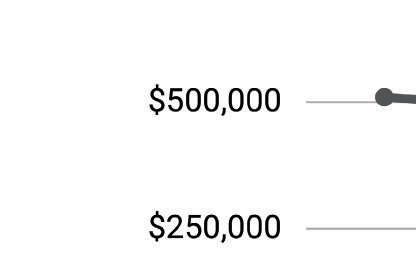
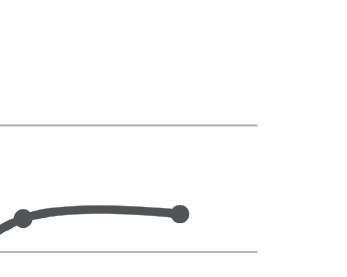
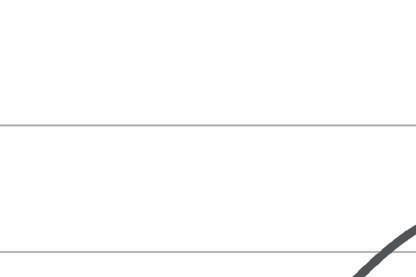
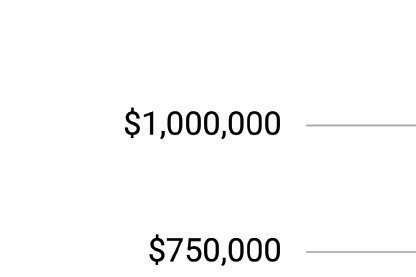
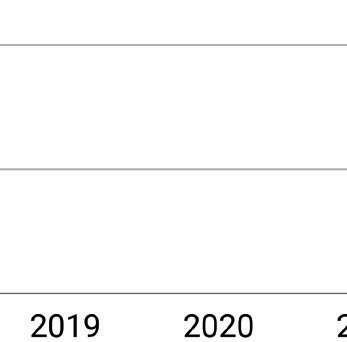
The condo and townhome sector is recalibrating and yet is up from pre-pandemic year. The average sales price is now 61.7% higher compared to same period 2019. In the $1M+ condo/townhome sector, average sales price is nearly 7% more than during the first six months of 2019.
BRICKELL JAN-JUNE PERIOD
CONDOS/TOWNHOMES
Average sales price per square foot increased for the general Brickell condo/townhome market as well as for those priced $1M and above, putting a downward pressure on overall prices for $1M+ condos/townhhomesand number of sales post heightened levels. Days on the market increased as a result.
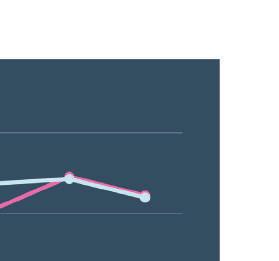
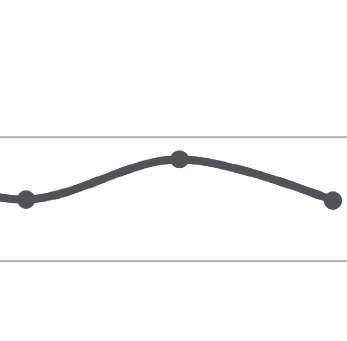
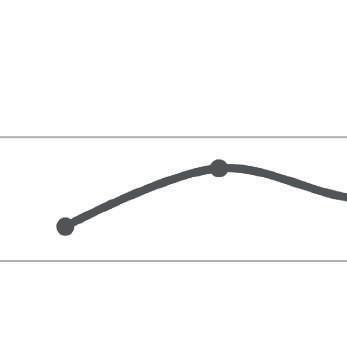
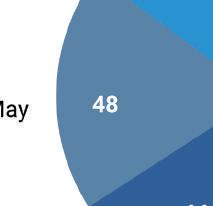
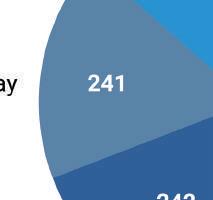
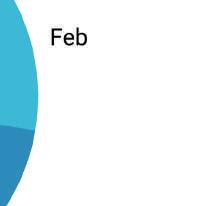
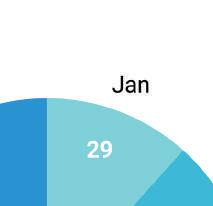
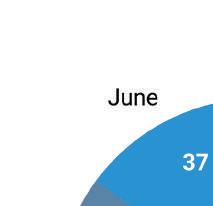
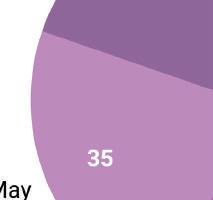
(right) In the Brickell condo/townhome market, the sales reached their highest marks in February, March and May. The $1M+ condo/townhomes had their highest average in March but its mid year dropped from 2022.

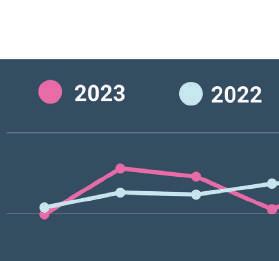
2023
AVG. SALES BY MONTH
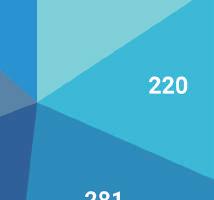
Total number of sales: 690


CONODS/TOWHOMES $1M+ CONDOS/TOWNHOMES

2022
AVG. SALES BY MONTH
Total number of sales: 1,391


2023
AVG. SALES BY MONTH
Total number of sales: 137
2022


AVG. SALES BY MONTH


Total number of sales: 250
- Coconut Grove has experienced a staggering percentage change since 2019. This makes it one of the most highest-gaining areas
-Single-family homes are recalibrating following the extreme record levels, outperforming pre-pandemic 2019 by 121%
-$1M+ single-family homes average salesprice is up 68% from 2019
- Sales transactions fell short of the frenzied Covid levels due to inventory shortage
- Condos/townhomes are up by 156% from 2019 & $1M+ condos/townhomes are 83% above 2019


