Evolution Ten machines have occupied the first spot on the list since 1993 1. TMC CM-5 The Thinking Machines Corporation CM5 at LANL was #1 on the first list in ‘93, and used a MIMD architecture based on a fat tree network of SuperSPARC I 32 MHz processors. 2. Fujitsu Numerical Wind Tunnel Conquered #1 on the November ‘93 list and stayed on top until ’95. The Numerical Wind Tunnel used a Full distributed crossbar to connect 140 Fujitsu 105 MHz cores. 3. Intel Paragon XP/S140 Briefly took the #1 spot in June ’94. This MPP had an astonishing 3680 Intel 80860 50 MHz cores and used a 2D mesh interconnect. 4. Hitachi SR2201 In June ‘96 this machine captured the top spot with 220,4 Gflops. 1024 PARISC HARP-1E 150 MHz processors, using a Hyper crossbar . 5. Hitachi CP-PACS Top performer on the November ’96 list. Doubled the amount of PA-RISC HARP-1E 150 MHz processors of it’s predecessor. 6. Intel ASCI Red The ASCI Red was a mesh-based MIMD MPP machine initially consisting of 4510 Intel Pentium Pro processors @ 200MHz. First to break the teraflop barrier and stayed on top until June 2000. 7. IBM ASCI White Nov 2000. Based on IBM's RS/6000 SP computer. 512 nodes of 16 POWER3 375 MHz processors. 8. NEC Earth Simulator Jun ’02. NEC’s ES runs global climate models at 35,8 teraflops using 640 nodes of 8 vector processors. 9. IBM Blue Gene/L Nov ’04. The last top ranked MPP. 70,72 teraflops with PowerPC cores. 10. IBM Roadrunner Current #1 since June ‘08. A hybrid (Opteron + Cell) cluster with Infiniband interconnects.
Evolution of architecture types 100%
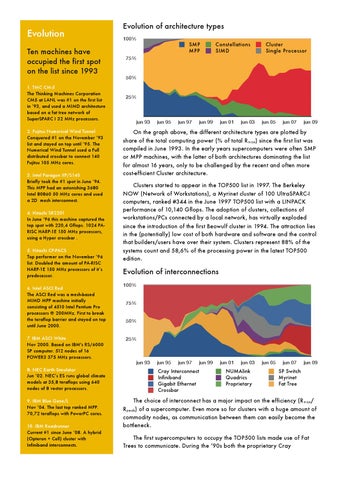
SMP MPP
Constellations SIMD
Cluster Single Processor
75%
50%
25%
jun 93
jun 95
jun 97
jun 99
jun 01
jun 03
jun 05
jun 07
jun 09
On the graph above, the different architecture types are plotted by share of the total computing power (% of total Rmax) since the first list was compiled in June 1993. In the early years supercomputers were often SMP or MPP machines, with the latter of both architectures dominating the list for almost 16 years, only to be challenged by the recent and often more cost-efficient Cluster architecture. Clusters started to appear in the TOP500 list in 1997. The Berkeley NOW (Network of Workstations), a Myrinet cluster of 100 UltraSPARC-I computers, ranked #344 in the June 1997 TOP500 list with a LINPACK performance of 10,140 Gflops. The adoption of clusters, collections of workstations/PCs connected by a local network, has virtually exploded since the introduction of the first Beowulf cluster in 1994. The attraction lies in the (potentially) low cost of both hardware and software and the control that builders/users have over their system. Clusters represent 88% of the systems count and 58,6% of the processing power in the latest TOP500 edition.
Evolution of interconnections 100% 75% 50% 25%
jun 93
jun 95
jun 97
jun 99
Cray Interconnect Infiniband Gigabit Ethernet Crossbar
jun 01
jun 03
NUMAlink Quadrics Proprietary
jun 05
jun 07
jun 09
SP Switch Myrinet Fat Tree
The choice of interconnect has a major impact on the efficiency (Rmax/ Rpeak) of a supercomputer. Even more so for clusters with a huge amount of commodity nodes, as communication between them can easily become the bottleneck. The first supercomputers to occupy the TOP500 lists made use of Fat Trees to communicate. During the ‘90s both the proprietary Cray