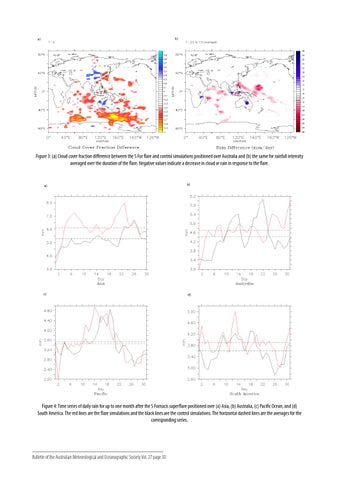
Figure 3: (a) Cloud cover fraction difference between the S For flare and control simulations positioned over Australia and (b) the same for rainfall intensity averaged over the duration of the flare. Negative values indicate a decrease in cloud or rain in response to the flare.
Figure 4: Time series of daily rain for up to one month after the S Fornacis superflare positioned over (a) Asia, (b) Australia, (c) Pacific Ocean, and (d) South America. The red lines are the flare simulations and the black lines are the control simulations. The horizontal dashed lines are the averages for the corresponding series.
Bulletin of the Australian Meteorological and Oceanographic Society Vol. 27 page 30