WAB 500102 012
page 51 of 108
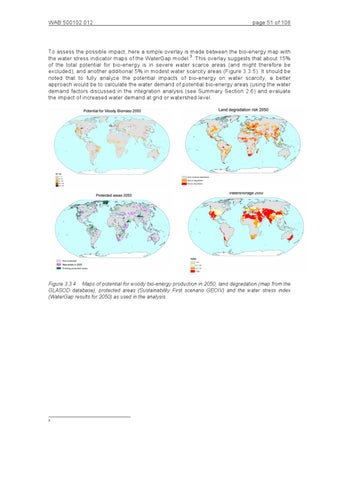
To assess the possible impact, here a simple overlay is made between the bio-energy map with the water stress indicator maps of the WaterGap model 3. This overlay suggests that about 15% of the total potential for bio-energy is in severe water scarce areas (and might therefore be excluded), and another additional 5% in modest water scarcity areas (Figure 3.3.5). It should be noted that to fully analyze the potential impacts of bio-energy on water scarcity, a better approach would be to calculate the water demand of potential bio-energy areas (using the water demand factors discussed in the integration analysis (see Summary Section 2.6) and evaluate the impact of increased water demand at grid or watershed level.
Figure 3.3.4 Maps of potential for woody bio-energy production in 2050, land degradation (map from the GLASOD database), protected areas (Sustainability First scenario GEOIV) and the water stress index (WaterGap results for 2050) as used in the analysis.
3