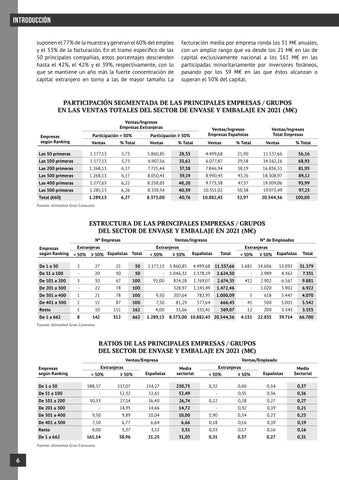
INTRODUCCIÓN facturación media por empresa ronda los 31 M€ anuales, con un amplio rango que va desde los 21 M€ en las de capital exclusivamente nacional a los 161 M€ en las participadas minoritariamente por inversores foráneos, pasando por los 59 M€ en las que éstos alcanzan o superan el 50% del capital.
suponen el 77% de la muestra y generan el 60% del empleo y el 53% de la facturación. En el tramo específico de las 50 principales compañías, estos porcentajes descienden hasta el 42%, el 42% y el 39%, respectivamente, con lo que se mantiene un año más la fuerte concentración de capital extranjero en torno a las de mayor tamaño. La
PARTICIPACIÓN SEGMENTADA DE LAS PRINCIPALES EMPRESAS / GRUPOS EN LAS VENTAS TOTALES DEL SECTOR DE ENVASE Y EMBALAJE EN 2021 (M€) Ventas/Ingresos Empresas Extranjeras Empresas según Ranking
Participación < 50%
Participación ≥ 50%
Ventas/Ingresos Empresas Españolas
Ventas
Ventas
% Total
Ventas
% Total
Ventas
% Total
Las 50 primeras
1.177,13
5.860,85
28,53
4.499,68
21,90
11.537,66
56,16
% Total 5,73
Ventas/Ingresos Total Empresas
Las 100 primeras
1.177,13
5,73
6.907,16
33,62
6.077,87
29,58
14.162,16
68,93
Las 200 primeras
1.268,13
6,17
7.721,44
37,58
7.846,94
38,19
16.836,51
81,95
Las 300 primeras
1.268,13
6,17
8.050,41
39,19
8.990,43
43,76
18.308,97
89,12
Las 400 primeras
1.277,63
6,22
8.258,05
40,20
9.773,38
47,57
19.309,06
93,99
Las 500 primeras
1.285,13
6,26
8.339,34
40,59
10.351,02
50,38
19.975,49
97,23
Total (660)
1.289,13
6,27
8.373,00
40,76
10.882,43
52,97
20.544,56
100,00
Fuente: Alimarket Gran Consumo
ESTRUCTURA DE LAS PRINCIPALES EMPRESAS / GRUPOS DEL SECTOR DE ENVASE Y EMBALAJE EN 2021 (M€) Nº Empresas Empresas según Ranking
Ventas/Ingresos
Extranjeras < 50%
Nº de Empleados
Extranjeras
≥ 50% Españolas Total
< 50%
Extranjeras
≥ 50%
Españolas
Total
< 50%
≥ 50%
Españolas
Total 31.379
De 1 a 50
2
27
21
50
1.177,13
5.860,85
4.499,68 11.537,66
3.681
14.606
13.092
De 51 a 100
-
20
30
50
-
1.046,31
1.578,19
2.624,50
-
2.989
4.362
7.351
De 101 a 200
3
30
67
100
91,00
814,28
1.769,07
2.674,35
412
2.902
6.567
9.881
De 201 a 300
-
22
78
100
-
328,97
1.143,49
1.472,46
-
1.020
5.902
6.922
De 301 a 400
1
21
78
100
9,50
207,64
782,95
1.000,09
5
618
3.447
4.070 3.542
De 401 a 500
1
12
87
100
7,50
81,29
577,64
666,43
41
500
3.001
Resto
1
10
151
162
4,00
33,66
531,41
569,07
12
200
3.343
3.555
De 1 a 662
8
142
512
662
1.289,13
8.373,00 10.882,43 20.544,56
4.151
22.835
39.714
66.700
Fuente: Alimarket Gran Consumo
RATIOS DE LAS PRINCIPALES EMPRESAS / GRUPOS DEL SECTOR DE ENVASE Y EMBALAJE EN 2021 (M€) Ventas/Empresa Empresas según Ranking De 1 a 50
Extranjeras < 50% 588,57
217,07
De 51 a 100
Españolas
Media sectorial
< 50%
≥ 50%
214,27
230,75
0,32
0,40
0,34
0,37
Españolas
Media Sectorial
-
52,32
52,61
52,49
-
0,35
0,36
0,36
De 101 a 200
30,33
27,14
26,40
26,74
0,22
0,28
0,27
0,27
De 201 a 300
-
14,95
14,66
14,72
-
0,32
0,19
0,21
De 301 a 400
9,50
9,89
10,04
10,00
1,90
0,34
0,23
0,25
De 401 a 500
7,50
6,77
6,64
6,66
0,18
0,16
0,19
0,19
Resto De 1 a 662
4,00
3,37
3,52
3,51
0,33
0,17
0,16
0,16
161,14
58,96
21,25
31,03
0,31
0,37
0,27
0,31
Fuente: Alimarket Gran Consumo
6
≥ 50%
Ventas/Empleado Extranjeras
