9 minute read
PILLAR 1 STUDENT LEARNING AND PROGRESS


STUDENT LEARNING AND PROGRESS
Advertisement
Indicator 1 .1: Student Progress (COVID Impact)
Percentage of Meeting Instructional benchmark Standards
Three times a year, the reading and math progress and performance of all students is assessed using universal screeners. These screeners are given by classroom teachers. Universal screening allows schools to provide targeted focus to at-risk groups at a time that will create the greatest impact on improving future outcomes.
READING
2020 2019
Elementary RDG English 68.6 66 Elementary RDG Spanish 47 53
Junior School RDG 65 66
High School RDG 69 66
MATH
2020 2019l Elementary Math 83 80 Junior School Math 76 81 High School Math 89 86 Findings: Research data from NWEA predicted that school closures over the spring and summer would result in two to four months of learning loss for all students and a greater impact in K-2nd grade. Additionally, TEA released a study on the academic impact of the pandemic on Texas students using Interim Assessment results from 334 districts. The results of the study indicate students experienced 3.2 months of instructional loss from the closures, in addition to the typical 2.5 months of summer learning loss. In AHISD, students did not experience a widespread “COVID Slide“ and regression of skills over the spring and summer. Beginning of the year screener data is comparable to previous years. There is a decline in elementary Spanish literacy. This may be due to students not having the same opportunity to practice Spanish during the summer and first three weeks of remote learning during the 20-21 school year. The Junior School increased math intervention to meet student needs.

Signal: On track. Continue to monitor.
Community Feedback:
The speed at which the entire school year was reimagined was amazing . We are very fortunate to have such a responsive and caring district . - Junior School Parent
During Continuous Learning and school closure, my child was independent and happy . My child was still learning, still felt supported, loved, and cared for by his teachers . That is paramount . - Cambridge Parent
STUDENT LEARNING AND PROGRESS
Indicator 1 .2: Student Progress
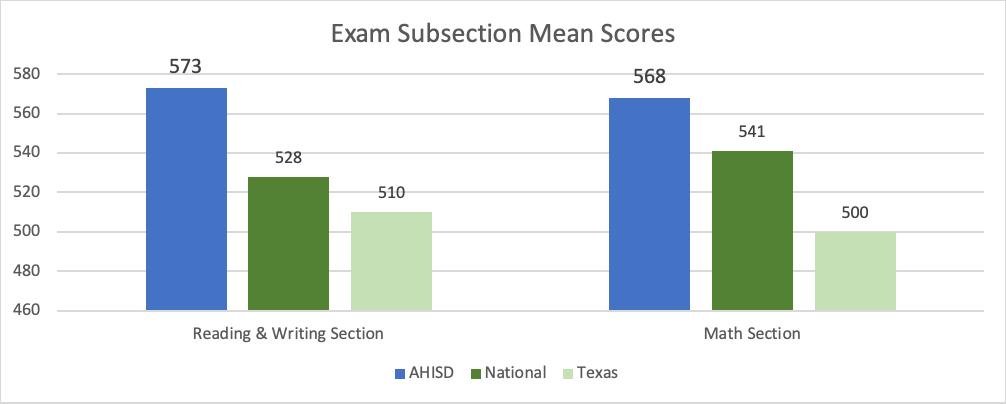
Comparison of AHISD students to Texas and National Comparison Groups on PSAT
The Scholastic Assessment Test (SAT) is an entrance exam used by most colleges and universities to make admissions decisions. The PSAT is a primer for the SAT. Taking the PSAT is optional as a freshman and sophomore and given to all junior students at AHHS. PSAT assessments can provide students benefits like over $350 million in scholarship opportunities and information about their potential to succeed in Advanced Placement.
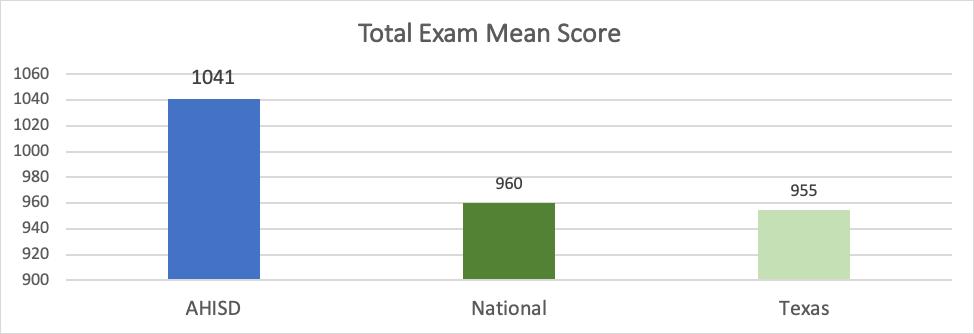

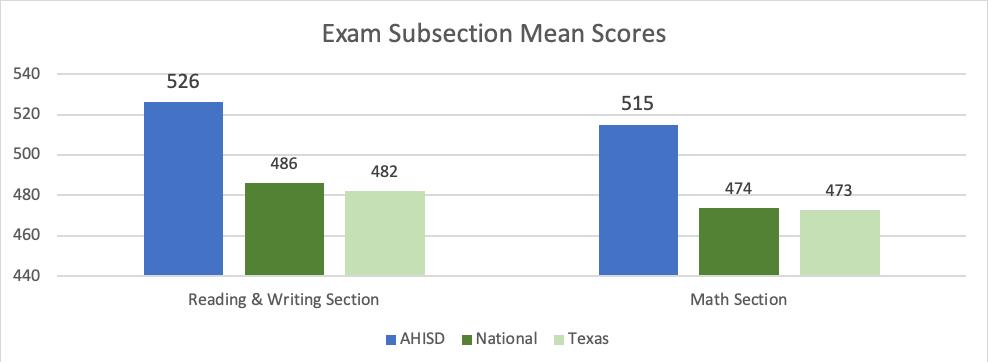
Findings: AHISD scores surpass both national and Texas comparison scores. Nineteen AHISD scholars in the 11th grade received National Merit Recognition for their exemplary performance on PSAT
Signal: On track. Continue to monitor.
Community Feedback:
I like how much the school emphasizes that teachers should teach beyond just the requirements given out by the state of Texas; they want students to really learn for the sake of learning, not merely to pass tests . We are pushed to become our best self . – High School Student
STUDENT LEARNING AND PROGRESS
Indicator 1 .3: Student Progress
Comparison of AHISD students to Texas and National Comparison Groups on SAT
The Scholastic Assessment Test (SAT) is an entrance exam used by most colleges and universities to make admissions decisions. While many students were unable to take the SAT due to the impact of COVID-19, the overwhelming majority of AHISD students in the class of 2020 who wanted to test were able to sit for an SAT administration before the COVIS19 caused global shutdowns.
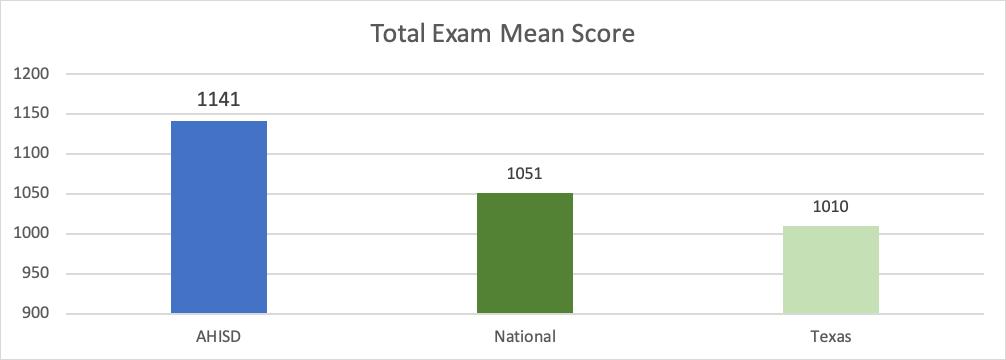
Findings: AHISD scores surpass both national and Texas comparison scores. 36% of AHISD students scored above a 1200 compared to 26% of national test takers and 18% of Texas test takers. Additionally, 25% of the class of 2020 aspired to a Bachelor’s Degree, 39% aspired to a Master’s Degree, 26% aspired to a Doctoral or Related Degree, and 9% were undecided.
Signal: On track. Continue to monitor.
STUDENT LEARNING AND PROGRESS
Indicator 1 .4: Student Progress
Comparison of Academic Performance of Student Groups on State Assessments
STAAR stands for State of Texas Assessments of Academic Readiness, which is the state’s student testing program. STAAR is based on state curriculum standards in core subjects including reading, writing, mathematics, science, and social studies. EOC is the End of Course exam students must pass before graduating high school. Due to the COVID-19 Pandemic, the STAAR and EOC exams were not administered in 2020. The most current data is from 2019.
2019 STAAR and EOC Exams Grades 3-12 Summary
All Students
Black/ African American Hispanic White American Indian Asian Pacific Islander Two or More Races Econ Dis English Learners Special Ed
All Subjects
Percent of Tests % at Approaches GL Standard or Above 85% 76% 77% 92% 100% 89% 100% 82% 68% 64% 47%
% at Meets GL Standard or Above 61% 49% 49% 71% 56% 71% 80% 51% 35% 34% 25%
% at Masters GL Standard 32% 26% 21% 40% 19% 46% 47% 24% 13% 12% 9%
Number of Tests # at Approaches GL Standard or Above 6,730 143 2,525 3,749 32 221 15 45 1,096 368 328
# at Meets GL Standard or Above 4,842 92 1,607 2,908 18 177 12 28 565 193 176 # at Masters GL Standard 2,508 49 703 1,617 6 113 7 13 211 69 60 Total Tests 7,898 187 3,288 4,073 32 248 15 55 1,621 571 699
ELA/Reading
Percent of Tests % at Approaches GL Standard or Above 85% 75% 77% 92% 100% 89% 100% 79% 66% 60% 44%
% at Meets GL Standard or Above 63% 46% 50% 74% 58% 69% 75% 63% 34% 30% 26%
% at Masters GL Standard 31% 28% 20% 39% 0% 43% 38% 29% 12% 12% 7%
Number of Tests # at Approaches GL Standard or Above 2,587 50 975 1,438 12 85 8 19 418 130 127
# at Meets GL Standard or Above 1,916 31 635 1,156 7 66 6 15 217 65 74 # at Masters GL Standard 932 19 257 605 0 41 3 7 78 25 19
Total Tests
Mathematics
3,033 67 1,265 1,561 12 96 8 24 630 215 286
Percent of Tests % at Approaches GL Standard or Above 87% 81% 79% 92% 100% 92% 100% 79% 73% 72% 48%
% at Meets GL Standard or Above 62% 50% 49% 72% 50% 79% 80% 37% 36% 45% 25%
% at Masters GL Standard 34% 22% 22% 43% 13% 51% 60% 21% 13% 16% 10%
Number of Tests # at Approaches GL Standard or Above 1,988 47 772 1,071 8 70 5 15 366 129 101
# at Meets GL Standard or Above 1,415 29 478 833 4 60 4 7 180 80 53 # at Masters GL Standard 776 13 215 501 1 39 3 4 67 29 22
Total Tests 2,298 58 974 1,158 8 76 5 19 503 179 210
Findings: Overall, AHISD students perform quite well on state standardized exams. There continues to be an achievement gap between racial groups. Economic status may be a mediating variable between race and achievement, meaning factors associated with poverty and economic status that may explain the relationship between race and achievement. Students served in Special Education and Bilingual programs continue to underperform on state assessments.
Signal: Support Required
STUDENT LEARNING AND PROGRESS
Indicator 1 .5: Student Progress
Comparison of Dropout and Graduation Rates
Texas Education Agency compiles a Graduation Profile of Annual Graduates. This annual report includes the count and percentage of students who graduate at some time during the school year. It includes summer graduates and is reported by districts in the fall of the following school year. It includes all students in grade 12 who graduated, as well as graduates from other grades. Students served by special education who graduate are included in the totals. Annual Dropout Rate: The percentage of students who drop out of school during a school year. Annual dropout rates are shown for the district and campuses that serve grades 7–8 and 9–12. According to research, graduating from high school will determine how well students live for the next 50 years of their lives. High school graduates earn $143 more per week than high school dropouts.
State Bexar County District Black/ African American Hispanic White American Indian Asian Two or More Races Special Ed Econ Dis English Learners
Annual Dropout Rate (Gr 7-8) 2017-18 0.40% 0.60% 0.10% 0.00% 0.00% 0.00% * 0.00% * 0.00% 0.00% 0.00%
2016-17 0.30% 0.40% 0.00% 0.00% 0.00% 0.00% * 0.00% * 0.00% 0.00% 0.00%
Annual Dropout Rate (Gr 9-12) 2017-18 1.90% 2.60% 0.40% 3.60% 0.70% 0.00% 0.00% 0.00% 0.00% 1.60% 1.40% 0.00%
2016-17 1.90% 2.70% 0.20% 0.00% 0.60% 0.00% 0.00% 0.00% 0.00% 0.90% 0.60% 0.00%
4-Year Graduation Rate (Gr 9-12) Class of 90.00% 87.10% 97.70% 90.00% 95.80% 99.50% * 100.00% * 90.50% 92.30% 100.00% 2018 Graduated
Class of 2017 Graduated 89.70% 85.90% 96.90% * 96.90% 97.40% * 86.70% * 83.30% 93.80% 100.00%
Findings: Our dropout rates continue to be lower than the county and state while our graduation rates continue to be higher than the county and state.
Signal: On track. Continue to monitor.
Community Feedback:
I appreciate the Alamo Heights School District’s effort to provide quality and beneficial education to its students . I feel that what I’ve learned has enabled me to lay a strong intellectual, educational, and secular foundation for my life . In other words, I feel like I’ve learned a lot and am pretty smart . – High School Student