
5 minute read
PILLAR 3 STUDENT WELLBEING AND SAFETY


STUDENT WELLBEING AND SAFETY
Advertisement
Indicator 3 .1: School Safety Survey
AHISD Score Compared to Previous Years and National Benchmarks
The School Safety Survey was given to all students in grades 3-12 in November 2019. The survey probes perceptions of physical and psychological safety while at school, including bullying, violence, and availability of support for students. It is important for students to have a safe learning environment to ensure they have the best possible opportunity to succeed academically. 3,032 students responded to the survey.
School Safety- Elementary Level AHISD Scores at 80th% of National Benchmarks

Findings: AHISD students feel physically and psychologically safe in our schools. There were noticeable differences between students who are classified as economically disadvantaged and students who are not classified as economically disadvantaged. There are no statistical differences between other student groups. Signal: On track. Continue to monitor.
Community Feedback:
It’s a very good and safe school and I appreciate that I’m able to feel like that going to school . - Junior School Student
STUDENT WELLBEING AND SAFETY
Indicator 3 .2: Belonging Survey
AHISD Score Compared to National Benchmarks
The Belonging Survey was given to all students in grades 6-12 in November 2020 and grades 3-5 in November 2019. The survey asks how much students feel that they are valued members of the school community. Research shows feeling like you belong at school is linked to higher levels of student emotional and physical wellbeing and better academic performance and achievement. It is positively associated with optimism, self-efficacy, self-esteem, self-concept and sociability. 1,900 students responded to the survey.
Belonging - Secondary Level AHISD Elementary Scores at 80th% of National Benchmarks AHISD Secondary Scores at 50th% of National Benchmarks
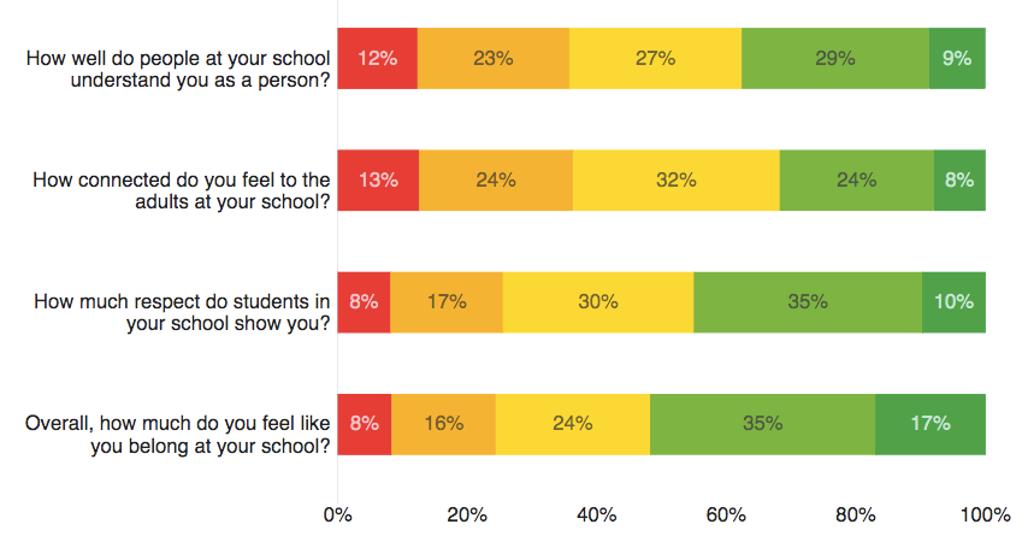

Findings: Most AHISD students feel a strong sense of belonging in our schools. Campuses all have specific Strategic Action goals around Belonging. There is a needed focus on improving connections with adults at the secondary level. There are no statistical differences between student groups.
Signal: Adjustments taking place.
Community Feedback:
I appreciate the efforts that the school has made to promote inclusivity . It helps boost the positivity and acceptance among students and teachers . I feel like I’m part of a bigger part of the community like I’m important . - High School Student
STUDENT WELLBEING AND SAFETY
Indicator 3 .3: Positive Relationships Survey
AHISD Score Compared to National Benchmarks
The Positive Relationships Survey was given to all students in grades 6-12 in November 2020 and grades 3-5 in November 2019. The survey asks how strong the connection is between teachers and students within and beyond the school. Improving students’ relationships with teachers has important, positive and long-lasting implications for both students’ academic and social development. Within a positive relationship, students are likely to trust the teacher more, show more engagement in learning, behave better in class, and achieve at higher levels academically. 1,900 students responded to the survey.
Positive Relationships AHISD Elementary Scores at 90th% of National Benchmarks AHISD Secondary Scores at 40th% of National Benchmarks
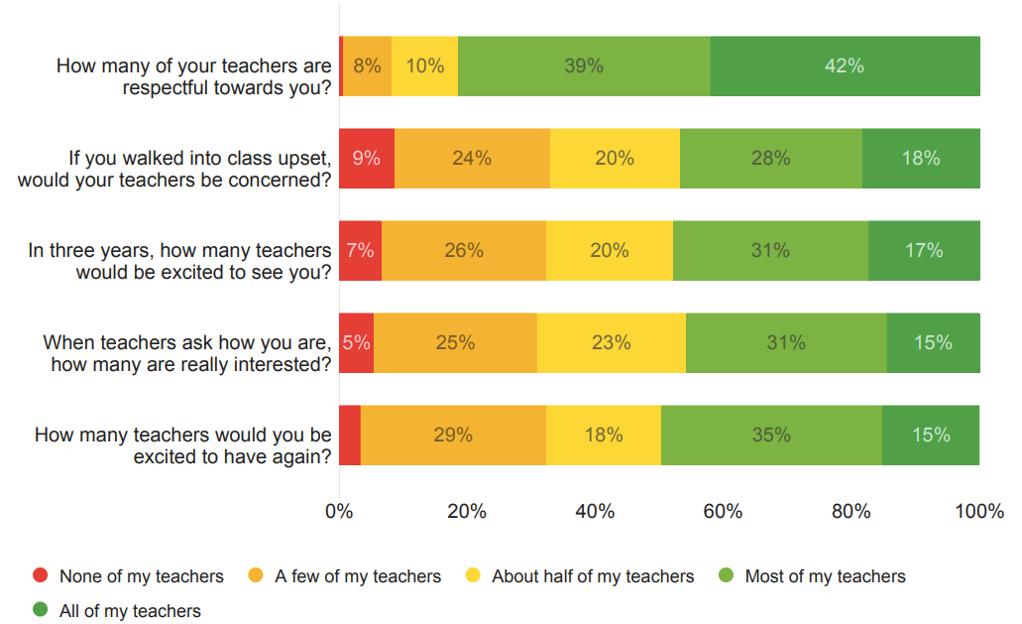
Findings: Positive relationships are a strength of AHISD elementary campuses. In secondary, although students feel like teachers are respectful towards them, fewer students feel like they have strong relationships with all teachers on campus. Campuses all have specific Strategic Action goals around Relationships and Belonging. There are no statistical differences between student groups. Signal: Adjustments taking place.
Community Feedback:
One thing I like about Alamo Heights is how nice people are to each other . I feel like we are much better at being kind to one another than most public schools out there . - Junior School Student
STUDENT WELLBEING AND SAFETY
Indicator 3 .4: Rigorous Expectations Survey
AHISD Score Compared to National Benchmarks
The Rigorous Expectations Survey was given to all students in grades 6-12 in November 2020 and grades 3-5 in November 2019. The survey asks how much students feel that their teachers hold them to high expectations around effort, understanding, persistence, and performance in class. Teachers’ beliefs about their students and what they can achieve have a substantial impact on students’ academic learning and progress. 1,900 students responded to the survey.
Rigorous Expectations AHISD Elementary Scores at 70th% of National Benchmarks AHISD Secondary Scores at 40th% of National Benchmarks
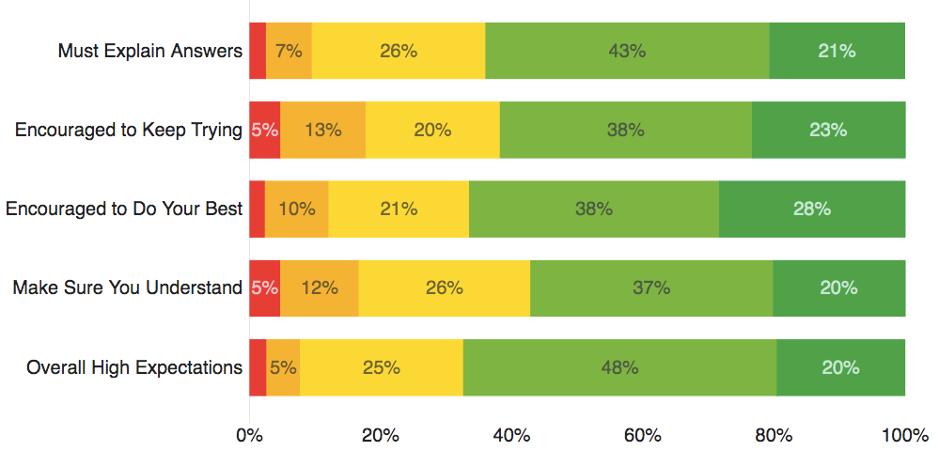
Findings: While most students do feel like they are held to high expectations, this is not a perception held by all students, especially in secondary. Students who participate in activities have a sense of higher expectations when compared with students who do not participate in activities. Ongoing professional development is planned on understanding curriculum standards and using formative data to set student goals. There are no statistical differences between student groups.
Signal: Adjustments taking place.
Community Feedback:
The thing I like the most about Alamo Heights is that the math department is really good in helping me understand the material . I’m a lot better at math than I used to think . – Junior School Student
I like that there are standards that are upheld, and they encourage kids to embodied . So the growth that is encouraged is emotional as well as academic . The expectations are set high which gives the platform to set high goals in life . – Cambridge Parent


