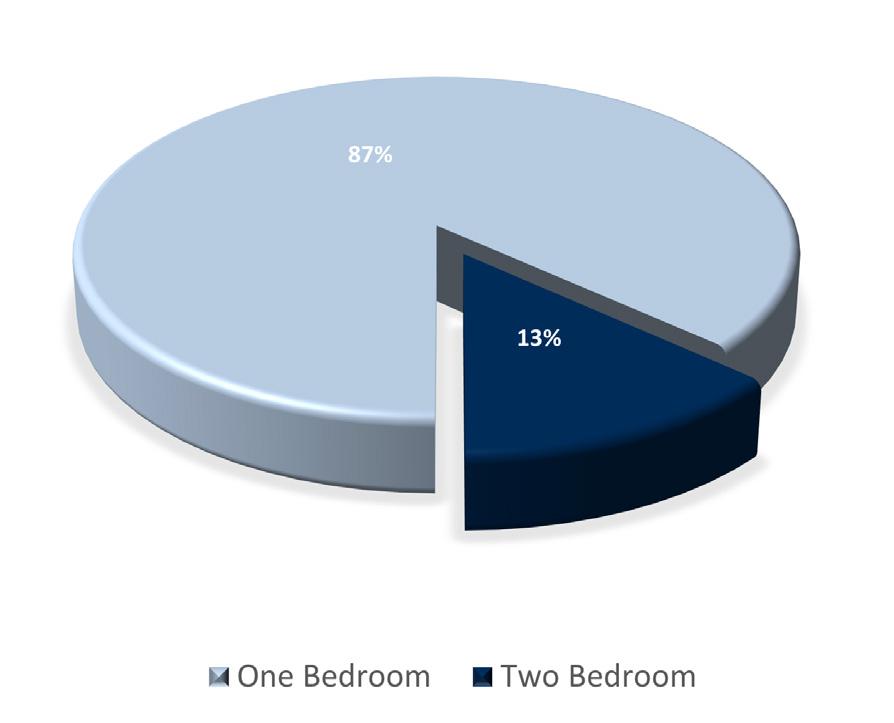
& EXPENSES

VERNON CTFINANCIALS T12 RENT ROLL: AS OF MAY 1, 2024 INCOME AND EXPENSES: MAY 2023 - APRIL 2024 T6 TRAILING 6 MONTH INCOME ASSUMED CONTROLLABLE EXPENSES GROSS POTENTIAL RENT % of GPR Per Unit % of GPR Per Unit All Units at Market Rent $474,120 RR 10,536 $474,120 RR 10,536 Gain (Loss) to Lease ($61,692) 13.01% (1,371) ($61,692) 13.01% (1,371) GROSS SCHEDULED RENT $412,428 RR 9,165 $412,428 RR 9,165 Other Income Late/NSF Fees $5,014 T12 1.22% 111 $5,014 T12 1.22% 111 Laundry Income $2,252 T12 0.55% 50 $2,252 T12 0.55% 50 Total Other Income $7,266 1.76% 161 $7,266 1.76% 161 GROSS POTENTIAL INCOME $419,694 9,327 $419,694 9,327 Physical Vacancy ($21,301) T12 Economic 5.16% (473) ($5,342) T6 Economic 1.30% (119) Bad Debt $0 0.00% 0 $0 0.00% 0 EFFECTIVE GROSS INCOME $398,393 81.82% 8,853 $414,352 85.69% 9,208 NON-CONTROLLABLE Real Estate Taxes % of EGI Per Unit % of EGI 2023 Taxes Paid $37,088 Auditor 9.44% 824 $37,088 Auditor 8.96% 824 Total Real Estate Taxes $37,088 9.44% 824 $37,088 8.96% 824 Insurance $14,654 T12 3.68% 326 $14,654 T12 3.54% 326 Utilities Gas & Electric $15,831 T12 3.97% 352 $15,831 T12 3.82% 352 Water & Sewage $24,272 T12 6.09% 539 $24,272 T12 5.86% 539 Trash Removal $3,206 T12 0.80% 71 $3,206 T12 0.77% 71 Total Utilities $43,309 10.87% 962 $43,309 10.45% 962 Total Non-Controllable $95,051 23.86% 2,112 $95,051 22.94% 2,112 CONTROLLABLE Contract Services Landscaping/Grounds/Snow $11,747 T12 2.95% 261 $11,250 2.72% 250 Pest Control $6,913 T12 1.74% 154 $3,375 0.81% 75 Total Contract Services $18,660 4.68% 415 $14,625 3.53% 325 Repairs & Maintenance $58,294 T12 14.63% 1,295 $27,000 6.52% 600 Marketing & Promotion $0 0.00% 0 $3,375 0.81% 75 On-Site Payroll $43,325 T12 10.88% 963 $40,500 9.77% 900 Payroll Taxes & Benefits $0 0.00% 0 $4,500 1.09% 100 General & Administrative $2,892 T12 0.73% 64 $3,375 0.81% 75 Management Fee $36,493 T12 9.16% 811 $20,718 5.00% 492 Replacement & Reserves $11,250 T12 2.82% 250 $13,500 3.26% 300 Total Controllable $170,914 42.90% 3,798 $127,593 30.79% 2,867 TOTAL EXPENSES $265,966 66.76% 5,910 $222,644 53.73% 4,948 NET OPERATING INCOME $132,427 33.24% 2,943 $191,708 46.27% 4,260 EXPENSE INCOME INCOME

UNDERWRITING NOTES # NOTE 1 Replacement &
based on market norm of $255 per unit per year T1 TRAILING 3 MONTH INCOME ASSUMED CONTROLLABLE EXPENSES YEAR 1 % of GPR Per Unit % of GPR Per Unit $474,120 RR 10,536 $482,580 10,724 ($61,692) 13.01% (1,371) ($19,303) 4.00% (429) $412,428 RR 9,165 $463,277 10,295 $5,014 T12 1.22% 111 $5,164 1.11% 115 $2,252 T12 0.55% 50 $2,319 0.50% 52 $7,266 1.76% 161 $7,484 1.62% 166 $419,694 9,327 $470,761 10,461 ($13,080) T1 Economic 3.17% (291) ($23,164) 5.00% (515) $0 0.00% 0 ($4,633) 1.00% (103) $406,614 83.82% 9,036 $442,964 90.00% 9,844 % of EGI Per Unit % of EGI Per Unit $37,088 Auditor 9.32% 824 $37,088 9.32% 824 $37,088 9.32% 824 $37,088 9.32% 824 $14,654 T12 3.60% 326 $18,000 4.43% 400 $15,831 T12 3.89% 352 $16,148 3.97% 359 $24,272 T12 5.97% 539 $24,758 6.09% 550 $3,206 T12 0.79% 71 $3,270 0.80% 73 $43,309 10.65% 962 $44,176 10.86% 982 $95,051 23.38% 2,112 $99,263 24.41% 2,206 $11,250 2.77% 250 $11,250 2.54% 250 $3,375 0.83% 75 $3,375 0.76% 75 $14,625 3.60% 325 $14,625 3.60% 325 $27,000 6.64% 600 $27,000 6.10% 600 $3,375 0.83% 75 $3,375 0.76% 75 $40,500 9.96% 900 $40,500 9.14% 900 $4,500 1.11% 100 $4,500 1.02% 100 $3,375 0.83% 75 $3,375 0.76% 75 $20,331 5.00% 492 $22,148 5.00% 492 $13,500 3.32% 300 $13,500 3.05% 300 $127,206 31.28% 2,867 $129,023 29.42% 2,867 $222,257 54.66% 4,939 $228,286 56.14% 5,073 $184,357 45.34% 4,097 $214,678 52.80% 4,771
Reserves: added

T12 T6 T1 YR 1 YR 2 YR 3 YR 4 YR 5 YE MAY-2025 YE MAY-2026 YE MAY-2027 YE APR-2028 YE APR-2029 GROSS POTENTIAL RENT All Units at Market Rent $474,120 $474,120 $474,120 $482,580 $497,057 $511,969 $527,328 $543,148 Gain (Loss) to Lease ($61,692) ($61,692) ($61,692) ($19,303) ($19,882) ($20,479) ($21,093) ($21,726) GROSS SCHEDULED RENT $412,428 $412,428 $412,428 $463,277 $477,175 $491,490 $506,235 $521,422 Total Other Income $7,266 $7,266 $7,266 $7,484 $7,634 $7,786 $7,942 $8,101 GROSS POTENTIAL INCOME $419,694 $419,694 $419,694 $470,761 $484,809 $499,277 $514,177 $529,523 Physical Vacancy ($21,301) ($5,342) ($13,080) ($23,164) ($23,859) ($24,575) ($25,312) ($26,071) Bad Debt $0 $0 $0 ($4,633) ($4,772) ($4,915) ($5,062) ($5,214) EFFECTIVE GROSS INCOME $398,393 $414,352 $406,614 $442,964 $456,178 $469,787 $483,803 $498,238 Real Estate Taxes $37,088 $37,088 $37,088 $37,088 $37,829 $38,586 $39,358 $40,145 Insurance $14,654 $14,654 $14,654 $18,000 $18,360 $18,727 $19,102 $19,484 Utilities $43,309 $43,309 $43,309 $44,176 $45,059 $45,960 $46,879 $47,817 Contract Services $18,660 $14,625 $14,625 $14,625 $14,918 $15,216 $15,520 $15,831 Repairs & Maintenance $58,294 $27,000 $27,000 $27,000 $27,540 $28,091 $28,653 $29,226 Marketing & Promotion $0 $3,375 $3,375 $3,375 $3,443 $3,511 $3,582 $3,653 On-Site Payroll $43,325 $40,500 $40,500 $40,500 $41,310 $42,136 $42,979 $43,839 Payroll Taxes & Benefits $0 $4,500 $4,500 $4,500 $4,590 $4,682 $4,775 $4,871 General & Administrative $2,892 $3,375 $3,375 $3,375 $3,443 $3,511 $3,582 $3,653 Management Fee $36,493 $20,718 $20,331 $22,148 $22,809 $23,489 $24,190 $24,912 Replacement & Reserves $11,250 $13,500 $13,500 $13,500 $13,770 $14,045 $14,326 $14,613 TOTAL EXPENSES $265,966 $222,644 $222,257 $228,286 $233,070 $237,956 $242,946 $248,043 NET OPERATING INCOME $132,427 $191,708 $184,357 $214,678 $223,108 $231,832 $240,857 $250,195 DEBT SERVICE - Proposed New Principal Payments $25,144 $25,144 $25,144 $25,144 $26,694 $28,341 $30,089 $31,945 Interest Payments $122,166 $122,166 $122,166 $122,166 $120,615 $118,969 $117,221 $115,365 TOTAL DS - Proposed New Loan $147,310 $147,310 $147,310 $147,310 $147,310 $147,310 $147,310 $147,310 CONSOLIDATED DEBT SERVICE $147,310 $147,310 $147,310 $147,310 $147,310 $147,310 $147,310 $147,310 NET CASH FLOW AFTER DEBT ($14,882) $44,398 $37,047 $67,368 $75,799 $84,522 $93,548 $102,885 DEBT SERVICE COVERAGE RATIO 0.90 1.30 1.25 1.46 1.51 1.57 1.64 1.70 RETURN ANALYSIS T12 T6 T1 Yr 1 Yr 2 Yr 3 Yr 4 Yr 5 CAP Rate (Purchase Price) 4.20% 6.09% 5.85% 6.82% 7.08% 7.36% 7.65% 7.94% 'All-In' CAP Rate (Total Cost) 4.20% 6.09% 5.85% 6.82% 7.08% 7.36% 7.65% 7.94% Cash-on-Cash Return -1.35% 4.03% 3.36% 6.11% 6.88% 7.67% 8.49% 9.33% IRR n/a n/a n/a 2.64% 5.62% 7.39% 8.54% 9.35% INCOME EXPENSE VERNON CTFINANCIALS
CASH FLOW


CASH FLOW PROJECTION GROWTH RATE ASSUMPTIONS YR 1 YR 2 YR 3 YR 4 YR 5 YR 6 YR 7 YR 8 YR 9 Income Gross Potential Rent 1.78% 3.00% 3.00% 3.00% 3.00% 3.00% 3.00% 3.00% 3.00% (Loss) / Gain to Lease* 13.01% 13.01% 4.00% 4.00% 4.00% 4.00% 4.00% 4.00% 4.00% Other Income 3.00% 3.00% 3.00% 3.00% 3.00% 3.00% 3.00% 3.00% 3.00% Expenses Expenses 2.00% 2.00% 2.00% 2.00% 2.00% 2.00% 2.00% 2.00% Management Fee** 5.00% 5.00% 5.00% 5.00% 5.00% 5.00% 5.00% 5.00% 5.00% CASH FLOW PROJECTION GROWTH RATE ASSUMPTIONS YR 1 YR 2 YR 3 YR 4 YR 5 YR 6 YR 7 YR 8 YR 9 Physical Vacancy 1.30% 3.17% 5.00% 5.00% 5.00% 5.00% 5.00% 5.00% 5.00% Non-Revenue Units 0.00% 0.00% 0.00% 0.00% 0.00% 0.00% 0.00% 0.00% 0.00% Bad Debt 0.00% 0.00% 1.00% 1.00% 1.00% 1.00% 1.00% 1.00% 1.00% Concessions Allowance 0.00% 0.00% 0.00% 0.00% 0.00% 0.00% 0.00% 0.00% 0.00% Total Economic Loss 1.30% 3.17% 6.00% 6.00% 6.00% 6.00% 6.00% 6.00% 6.00% Tax Breakdown Property Address Parcel ID Year Built Acres Market Value Assessed Value Tax Rate Taxes Payable Land Use Code 1506 North Bend Rd (Vernon) 247-0002-0014-00 1971 0.48 $686,010 $240,110 82.074213 $19,706.84 403 - Apartment, 40+ Units 1510 North Bend Rd 247-0002-0013-00 1971 0.40 $605,070 $211,770 82.074213 $17,380.86 403 - Apartment, 40+ Units Total 0.88 $1,291,080 $451,880 $37,087.70










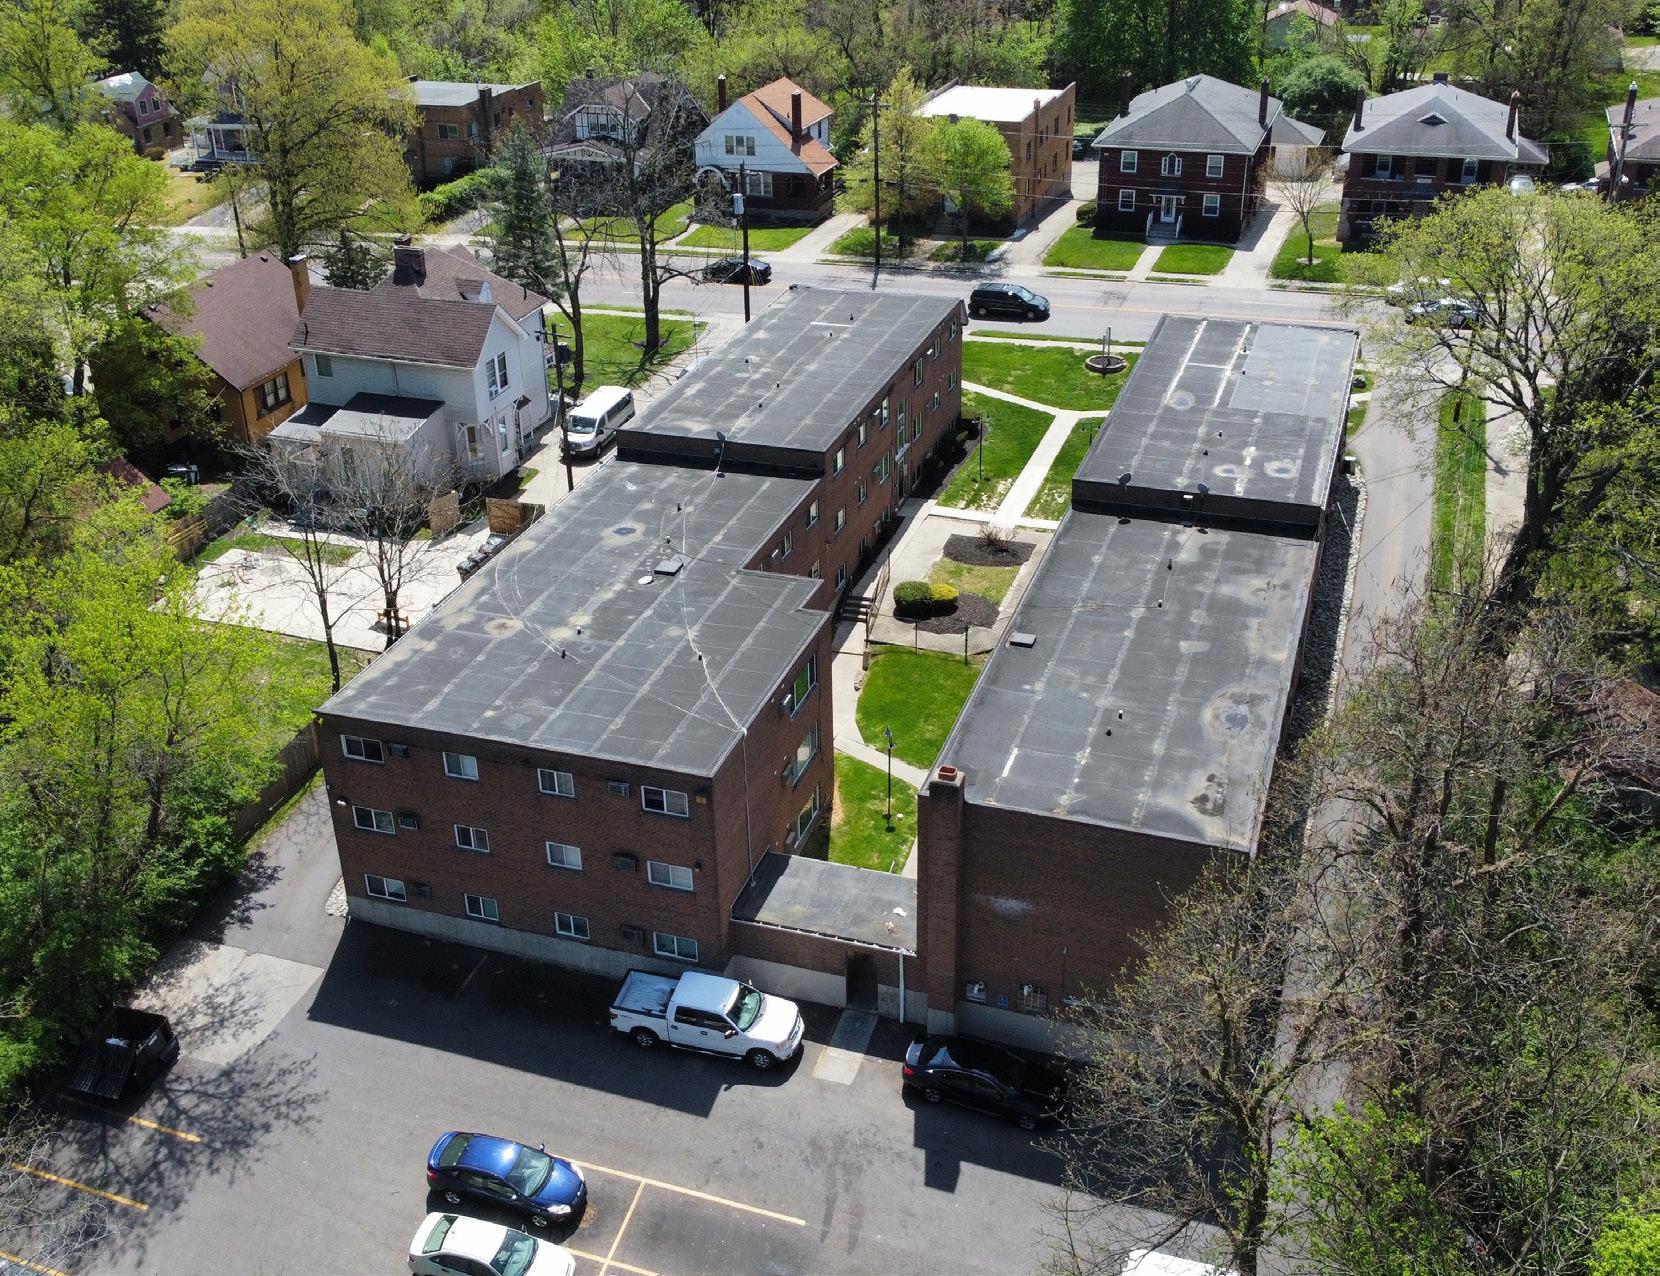
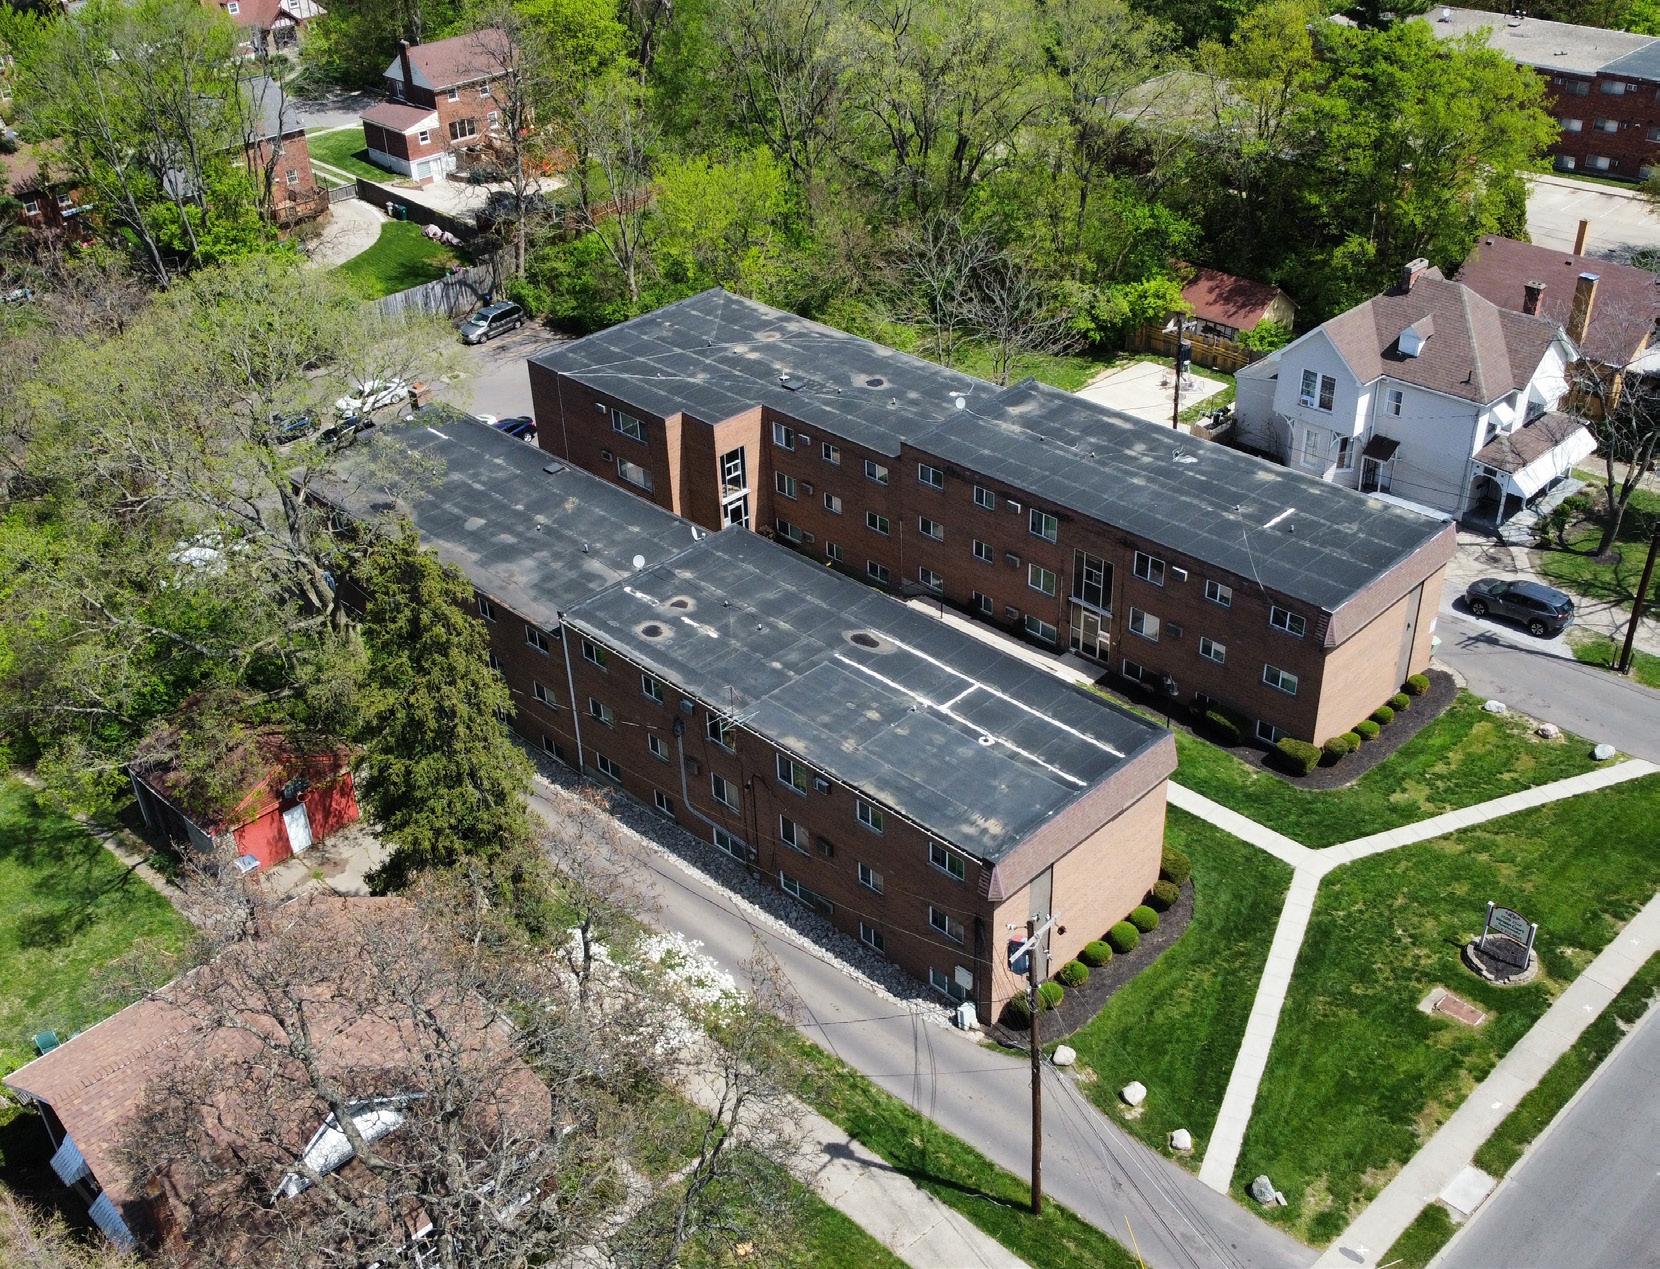
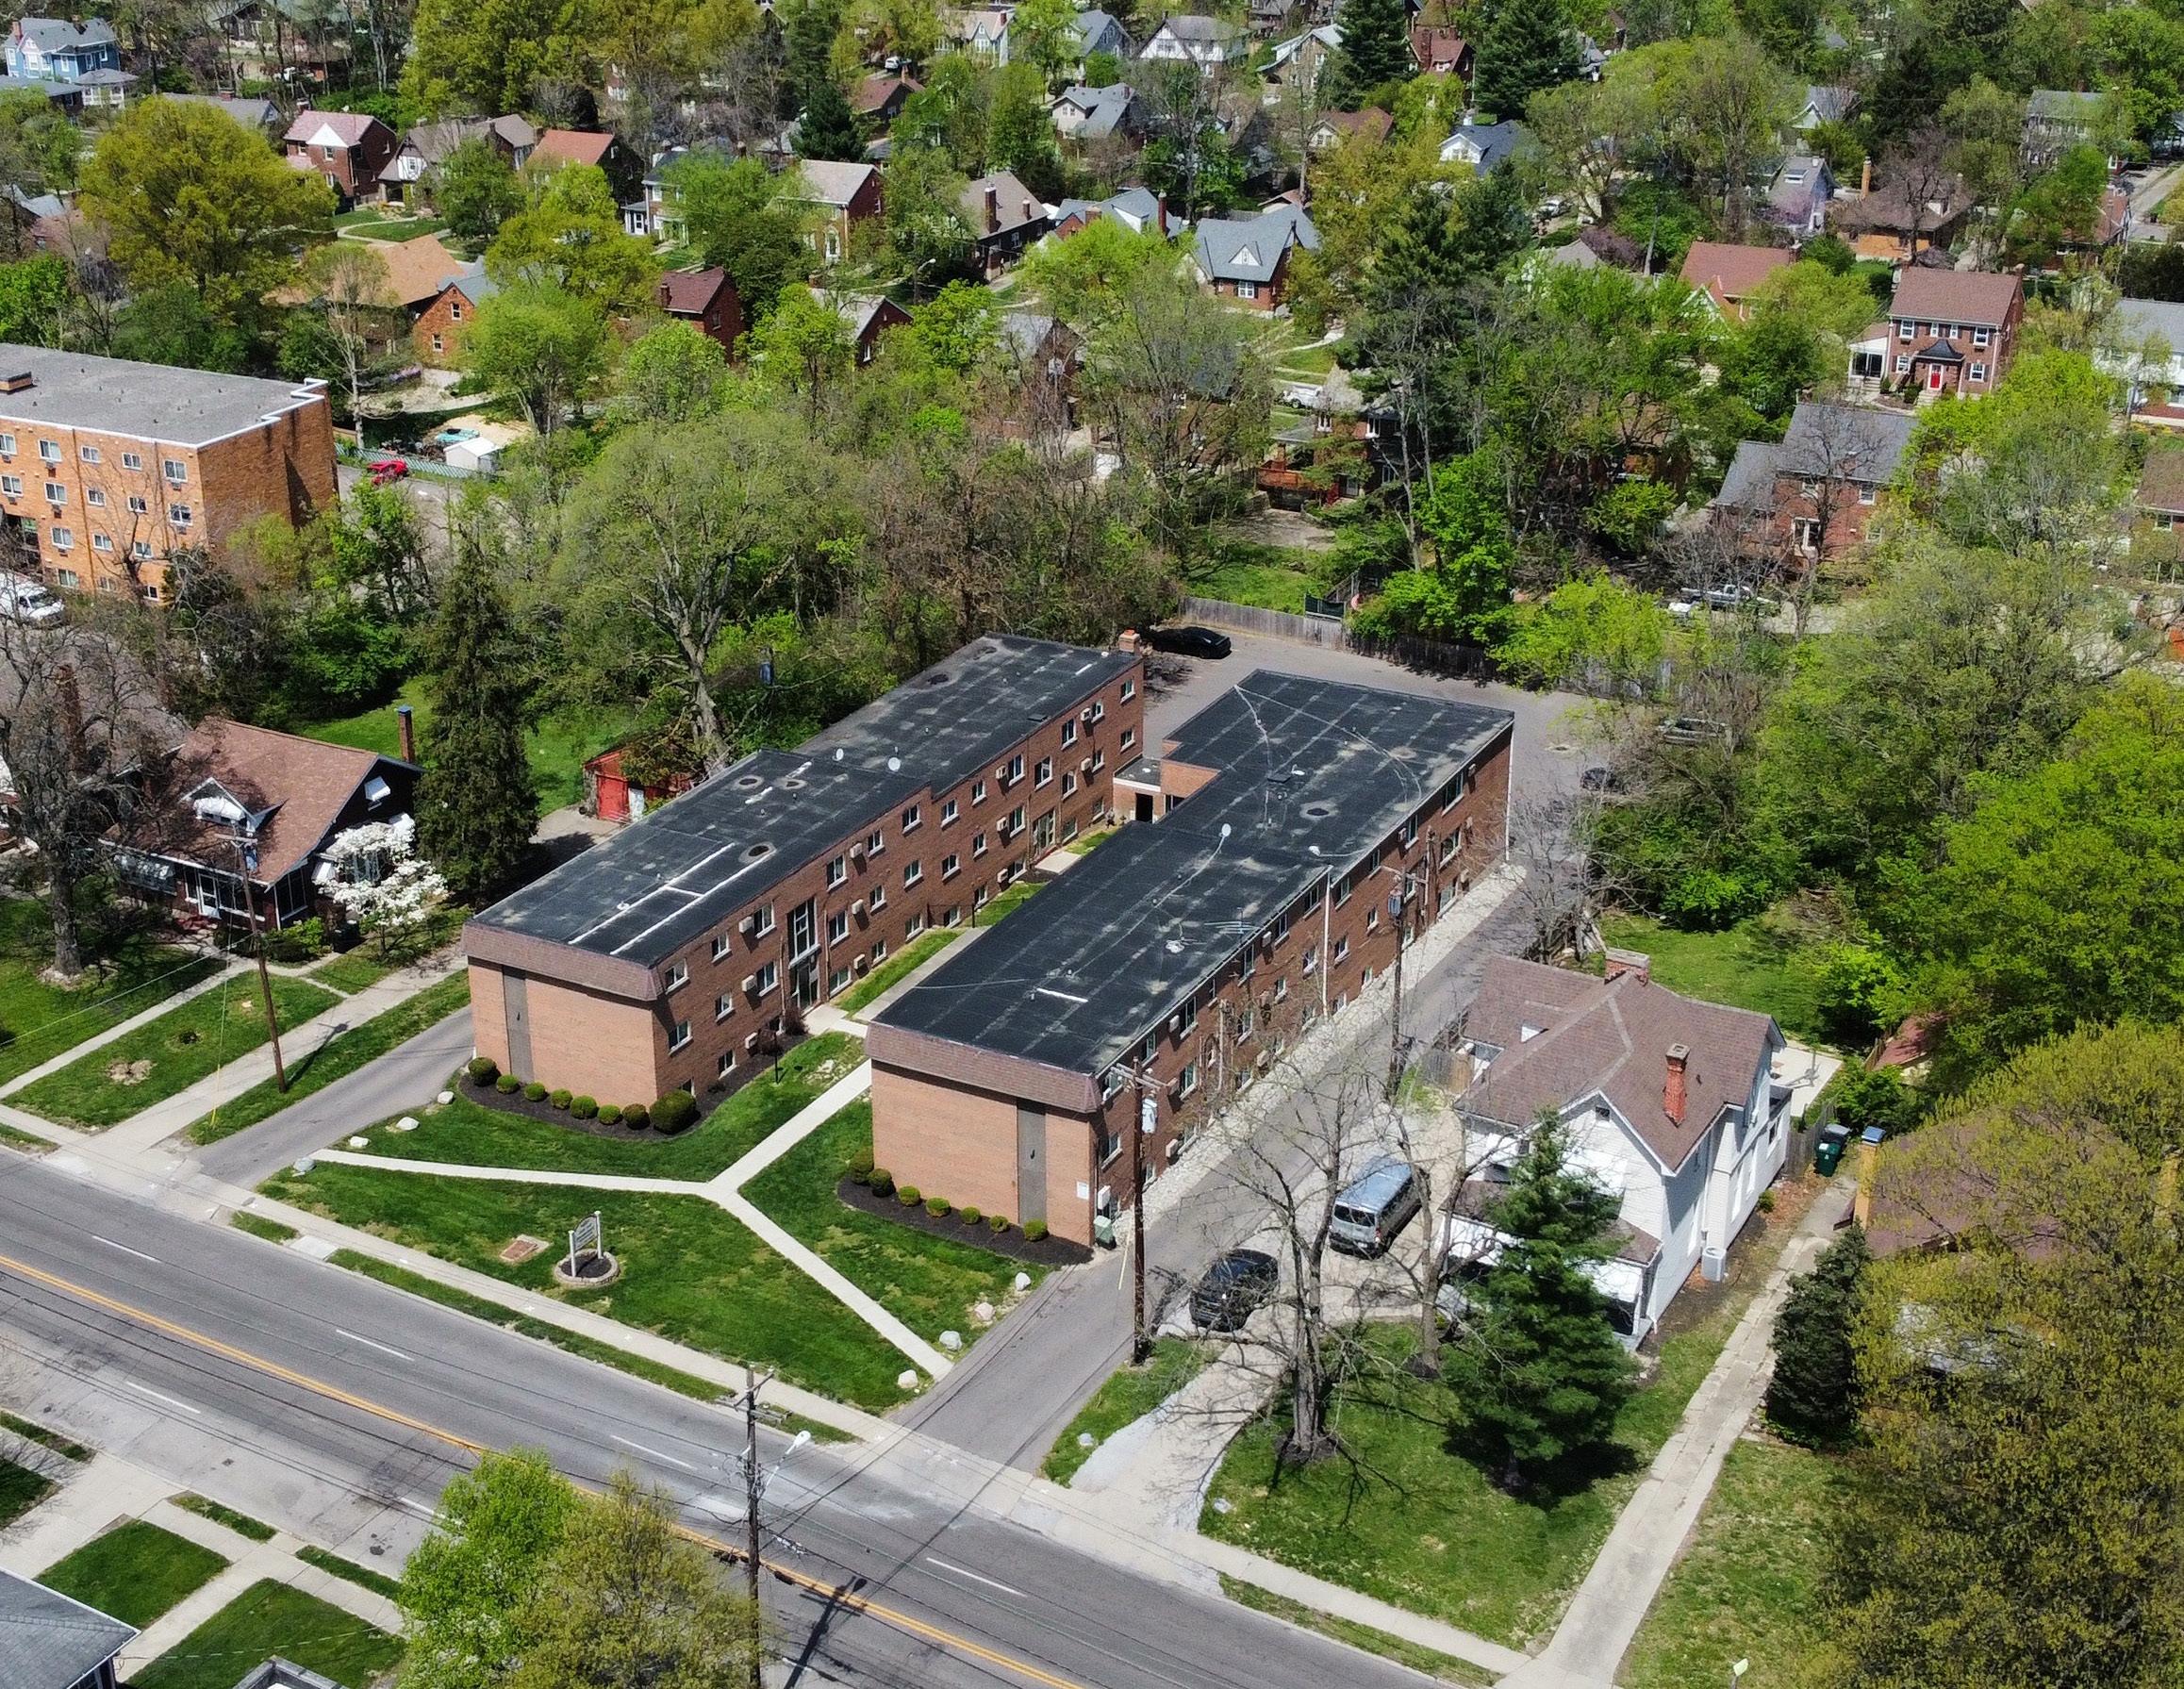
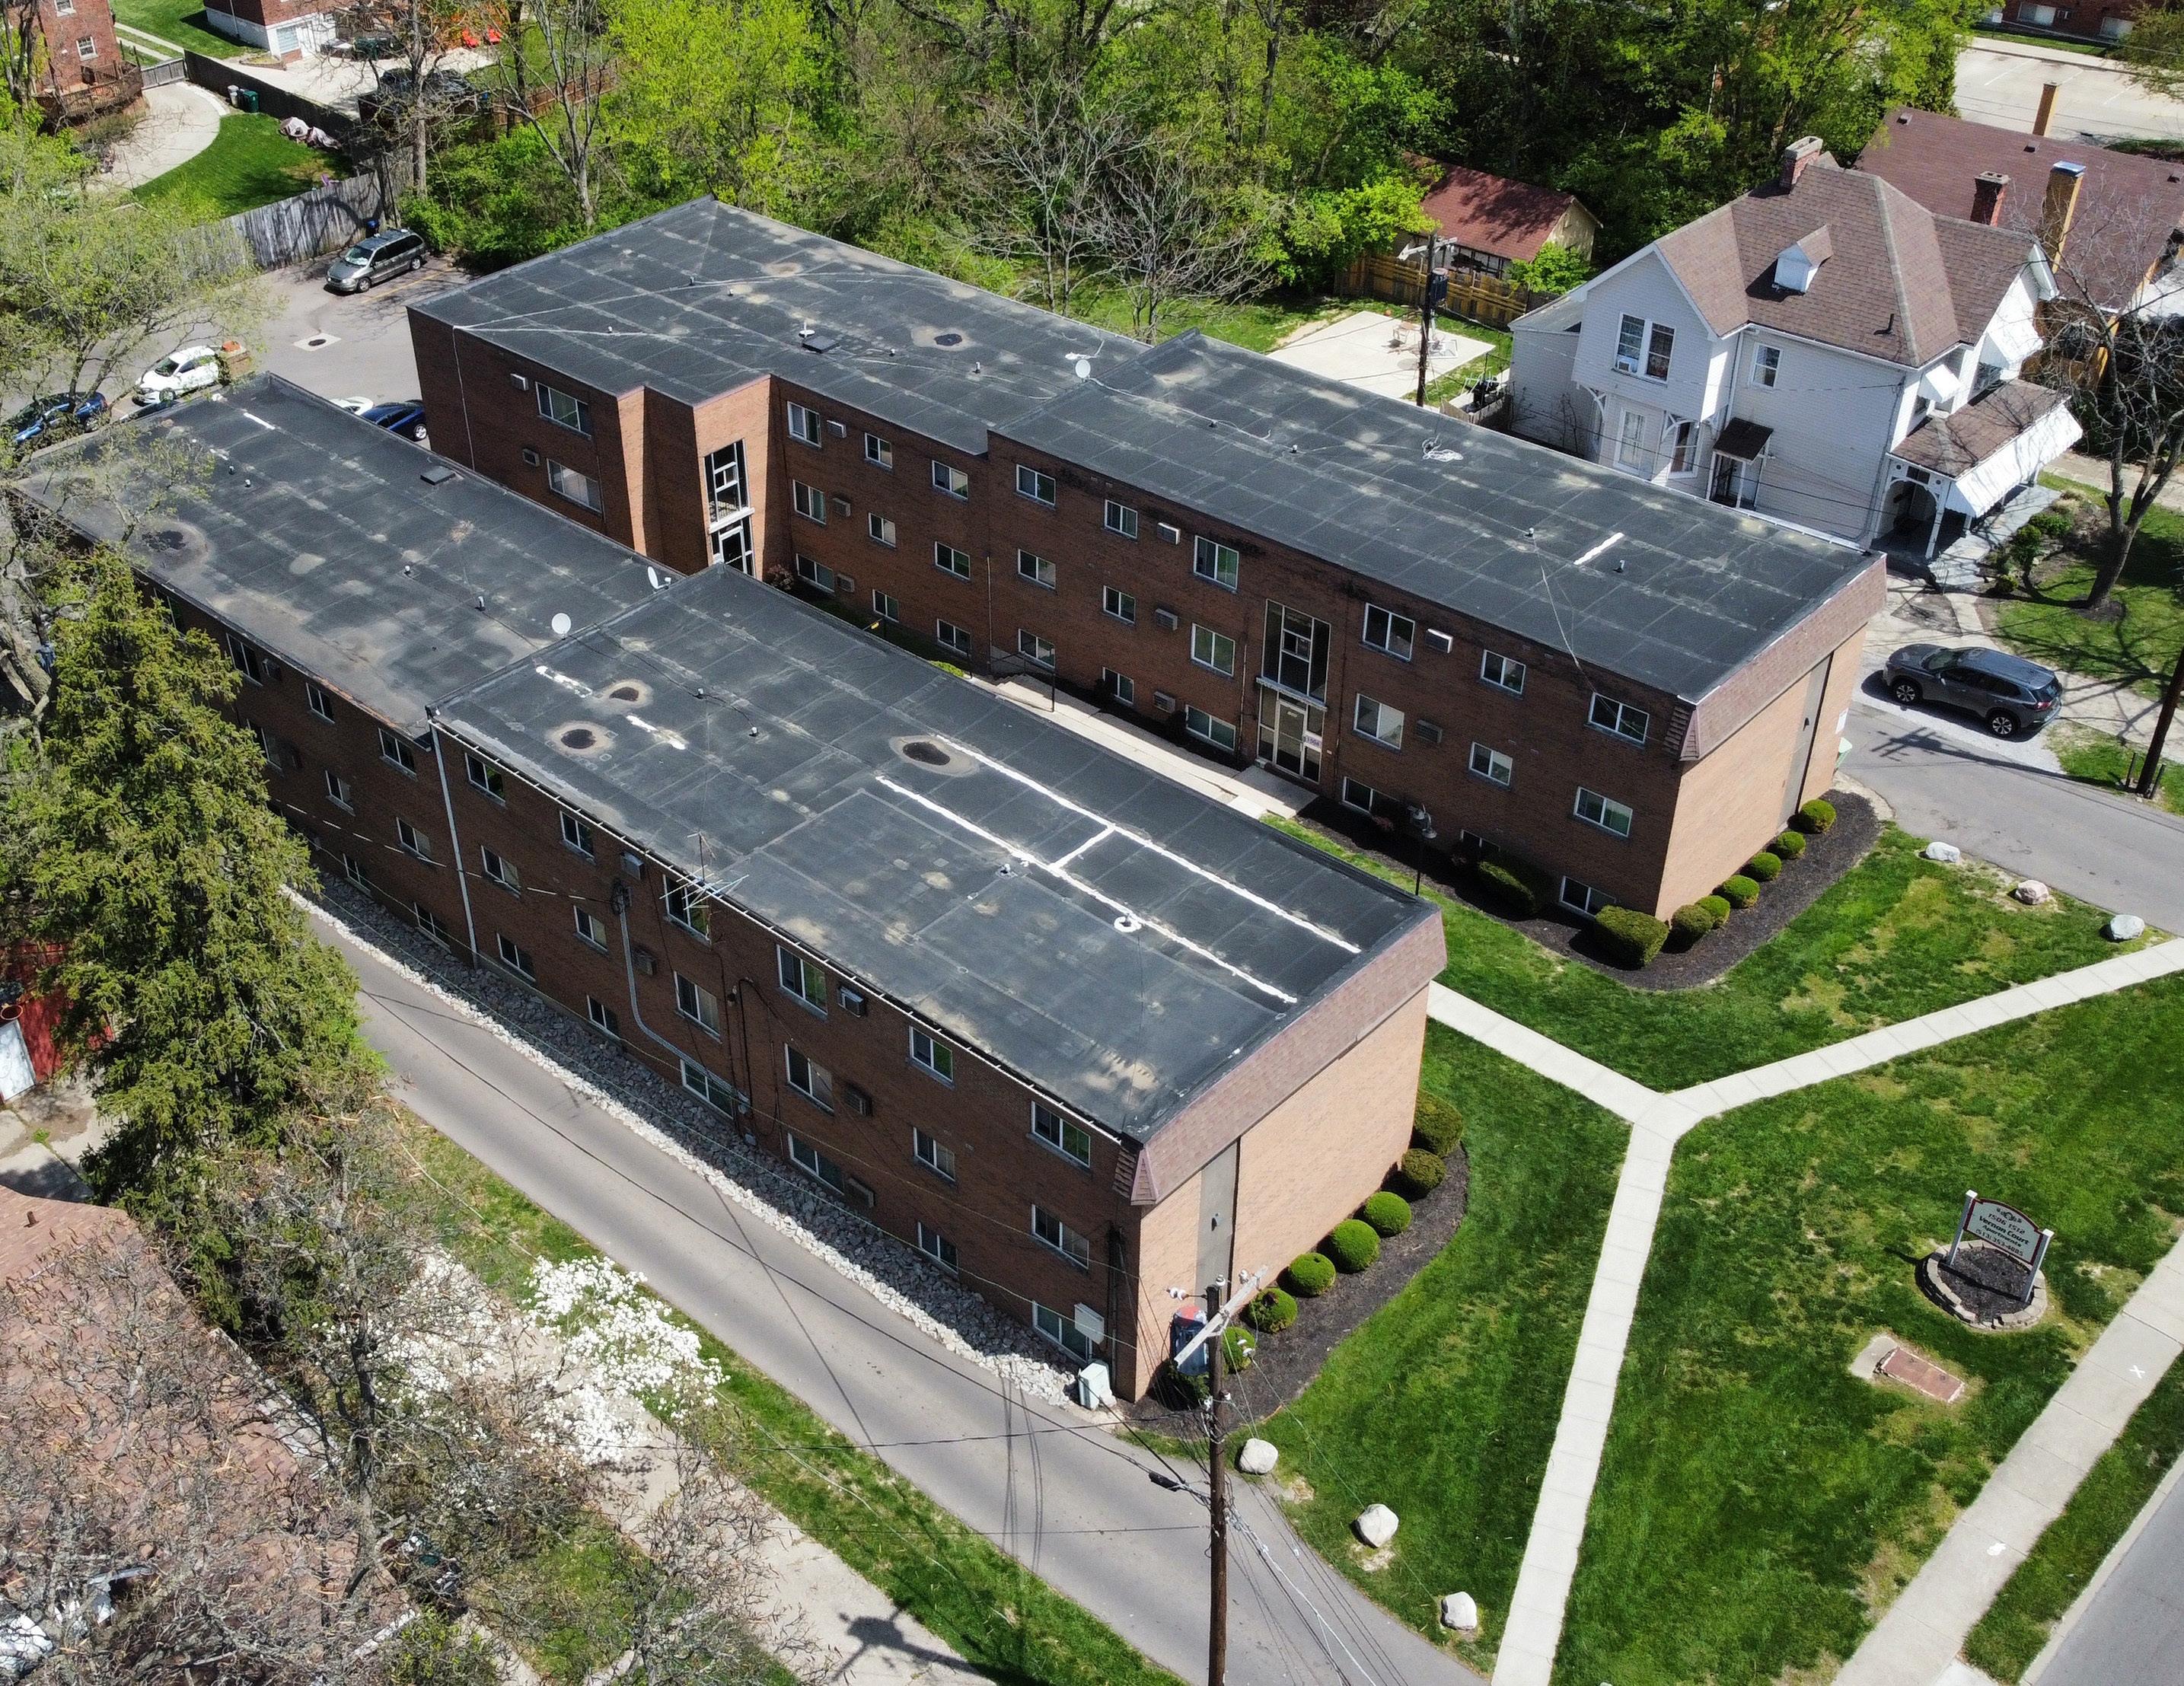
 VERNON COURT
