THE 222 OFFERING MEMORANDUM

CONTENTS
LEAD AGENTS
Austin Sum
Senior Associate

Cincinnati Office
D. 513.878.7747
austin.sum@marcusmillichap.com
Nick Andrews
First Vice President Investments
Cincinnati Office
D. 513.878.7741

nicholas.andrews@marcusmillichap.com
Jordan Dickman
First Vice President Investments
Cincinnati Office
D. 513.878.7735
jordan.dickman@marcusmillichap.com
“OUR COMMITMENT IS TO HELP OUR CLIENTS CREATE


AND PRESERVE WEALTH BY PROVIDING THEM WITH
THE BEST REAL ESTATE INVESTMENT SALES, FINANCING, RESEARCH AND ADVISORY SERVICES AVAILABLE.”
06 28 40 58


NON-ENDORSEMENT & DISCLAIMER NOTICE
CONFIDENTIALITY DISCLAIMER
THIS IS A BROKER PRICE OPINION OR COMPARATIVE MARKET ANALYSIS OF VALUE AND SHOULD NOT BE CONSIDERED AN APPRAISAL. This information has been secured from sources we believe to be reliable, but we make no representations or warranties, express or implied, as to the accuracy of the information. References to square footage or age are approximate. Buyer must verify the information and bears all risk for any inaccuracies.
NON-ENDORSEMENT NOTICE
Marcus & Millichap is not affiliated with, sponsored by, or endorsed by any commercial tenant or lessee identified in this marketing package. The presence of any corporation’s logo or name is not intended to indicate or imply affiliation with, or sponsorship or endorsement by, said corporation of Marcus & Millichap, its affiliates or subsidiaries, or any agent, product, service, or commercial listing of Marcus & Millichap, and is solely included for the purpose of providing tenant lessee information about this listing to prospective customers.
01 - THE INVESTMENT 02 - local competitors 03 - FINANCIALS 04 - LOCAL MARKET SECTIONS

CALABASAS, CALIFORNIA | HQ 2,500 | EMPLOYEES 80+ | OFFICES
UNRIVALED SUCCESS IN THE MIDWEST
YOUR TEAM
JORDAN DICKMAN
FIRST VICE PRESIDENTS DIRECTOR, NMHG
NICK ANDREWS
FIRST VICE PRESIDENTS DIRECTOR, NMHG
AUSTIN SUM
SENIOR INVESTMENT ASSOCIATE
BRIAN JOHNSTON
INVESTMENT ASSOCIATE
AUSTIN Hall
INVESTMENT ASSOCIATE
ALDEN SIMMs
INVESTMENT ASSOCIATE
BROKER SUPPORT
SAM PETROSNIO
VALUATION & RESEARCH
CORPORATE SUPPORT
LIZ POPP
MIDWEST OPERATIONS MANAGER
JOSH CARUANA
VICE PRESIDENT
REGIONAL MANAGER
INDIANAPOLIS | CINCINNATI | LOUISVILLE | ST LOUIS | KANSAS CITY
JOHN SEBREE
SENIOR VICE PRESIDENT
NATIONAL DIRECTOR
NATIONAL MULTI HOUSING GROUP
MICHAEL GLASS
SENIOR VICE PRESIDENT
MIDWEST DIVISION MANAGER
NATIONAL DIRECTOR, MANUFACTURED HOME COMMUNITIES GROUP
SKLYER WILSON
CLIENT RELATIONS MANAGER
BRITTANY CAMPBELL-KOCH
DIRECTOR OF OPERATIONS
ALEX PAPA
MARKETING COORDINATOR
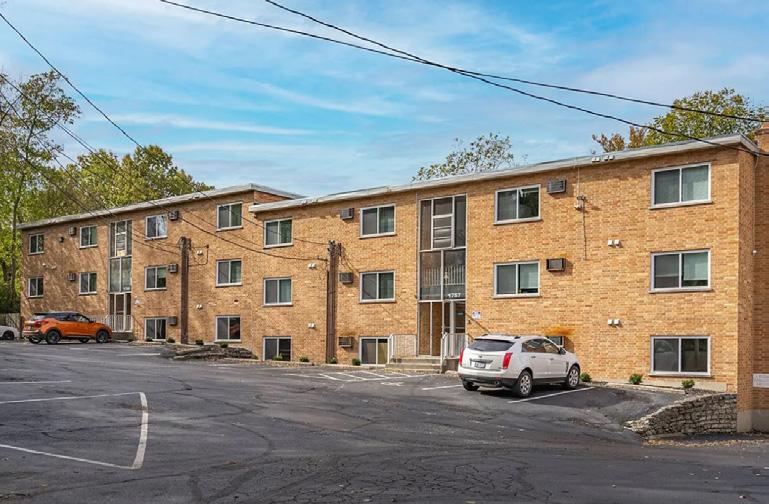
THE INVESTMENT
ADDRESS
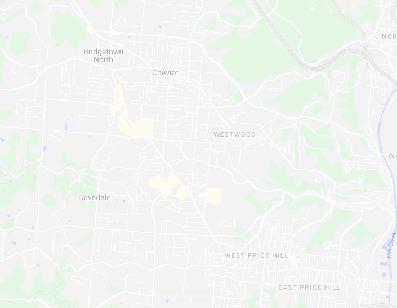
WESTSIDE
3050 MICKEY AVE
620 PEDRETTI & 4480 FOLEY ROAD
3113-3115 WERK ROAD
2821-2822 PRICE AVE
808 HARRIS AVE
5015 SIDNEY ROAD
3841 NOLAN AVE
3316 WERK ROAD
603-613 FOREST AVE
01
AVONDALE
ADDRESS

THE 222 INVESTMENT HIGHLIGHTS
LOSS TO LEASE RECAPTURE
With nearly 10% loss to lease on The 222’s March rent roll, there is roughly $160,000 to be recaptured annually in order to bring the loss to lease amount in line with market norms of 2%. This recapture alone adds over $2m to the value of the portfolio at a 6.5% cap rate.
CLOSE PROXIMITY ASSETS
Out of the nine total assets in the offering, eight are located on the westside of Cincinnati, with only seven miles separating the two assets that sit furthest apart from one another.. The outlier asset is located in Avondale less than eight miles away. The close proximity of the portfolio buildings helps to streamline day to day operations. In addition, there is a 1,500 sqft office space at the 3316 Werk Rd property creating a convenient location for a management office.
THE SUB-MARKETS
The majority of the offering is found in two submarkets, Price Hill/Delhi and Westwood, with a single asset in Avondale. All three submarkets have had large public and privately funded projects that have been delivered or broken ground in the last 18 months. To note a few:
• Price Hill and Delhi: Delhi Towne Square mixed-use development totaling $60 million
• Price Hill: Community ARCO totaling $15 million
• East Price Hill: Historical Building Revitalization project totaling $10 million

• Westwood: Lick Run Project totaling $193 million
• Avondale: Uptown Consortium’s Innovation Corridor totaling $2.5 billion
VALUE-ADD OPPORTUNITY
There are multiple apartment communities within 1-2 mile radius of the subject properties that have recently undergo large interior renovations resulting in the average one-bedroom rent and two-bedroom rent for the competitive set being $165 and $265 greater than the subject properties’ average effective rent.
PORTFOLIO SUMMARY ADDRESS YEAR BUILT UNIT COUNT AVG EFFECTIVE RENT 3050 Mickey Ave. 1963 47 $733 603-613 Forest Ave. 1929 35 $963 620 Pedretti & 4480 Foley 1964 48 $656 3113-3115 Werk Rd. 1966 22 $697 2821-2822 Price Ave 1980 24 $731 808 Harris Ave 1973 11 $710 5015 Sidney Rd. 1963 11 $628 3841 Nolan Ave. 1963 11 $711 3316 Werk Rd. 1985 12 & 1,500 SF Office $732
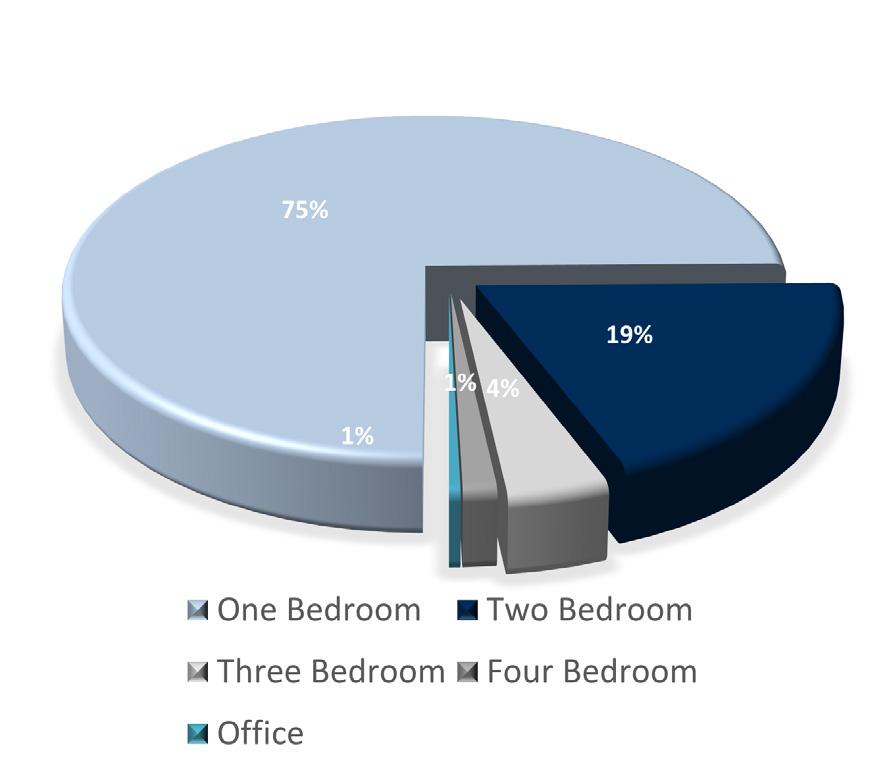
159,450 222 718 RENTABLE SQUARE FEET TOTAL UNITS AVG SF #1 Bedrooms 166 #2 Bedrooms 43 #3 Bedrooms 9 #4 Bedrooms 3 Office 1 PORTFOLIO SUMMARY THE 222

* * *
* * * * 2821 PRICE AVE 3050 MICKEY AVE
5015 SIDNEY ROAD
4480 FOLEY ROAD
808 HARRIS AVE
3113 WERK ROAD
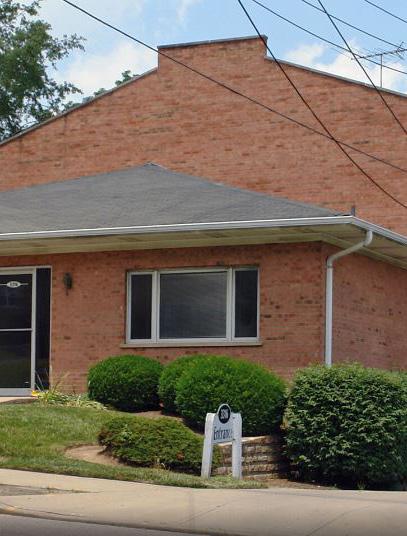
3316 WERK ROAD
* LOCATION THE 222
3841 NOLAN ROAD


603 FOREST AVE * AVE AVE
PROPERTY DETAILS
UNITS 47
SUBMARKET EAST PRICE HILL
AVERAGE EFFECTIVE RENT $733
OCCUPANCY 81%
HVAC BOILER BASED HEAT THROUGH WALL A/C
UTILITY RESPONSIBILITY:
RESIDENT PAYS: ELECTRIC
OWNER PAYS: WATER, SEWER, TRASH, GAS
CAPEX SINCE 2016:
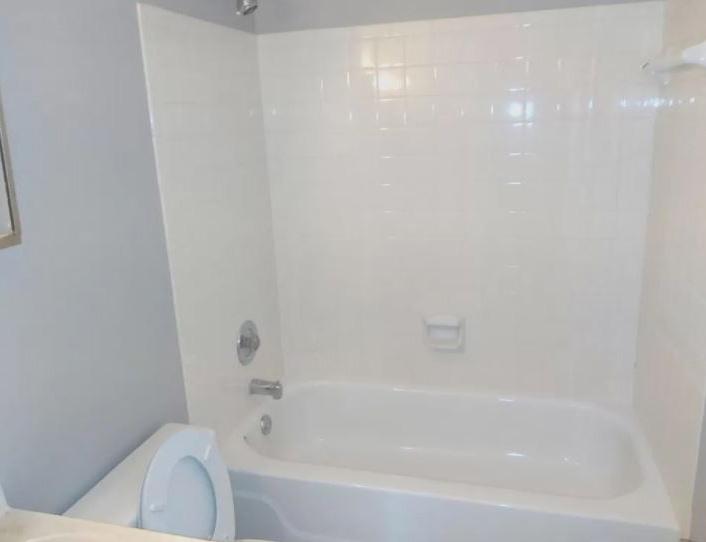
Painted Exterior Brick, New Vinyl Frame Windows, LVP Floor
Throughout all Units, All New Black or SS front Appliances, All New Kitchen Cabinets, All New Faux Granite Countertops, All New Bathroom Tub Surrounds, All New Toilets , All New Through Wall A/Cs, All New Lighting Fixtures
UNITS 35
SUBMARKET AVONDALE
AVERAGE EFFECTIVE RENT $963
OCCUPANCY 89%
HVAC BOILER BASED HEAT THROUGH WALL A/C
UTILITY RESPONSIBILITY:
RESIDENT PAYS: NONE
OWNER PAYS: WATER, SEWER, TRASH, GAS
CAPEX SINCE 2017:
New High Efficiency Boiler, All New LVP Throughout all Units
- 80% of Units Have New Kitchen Cabinets
- 80% of Units Have New Faux-Granite Countertops
- 80% of Units Have New SS Appliances
- 80% of Units Have New Lighting Fixtures
- All New Exterior Doors
UNITS 48
SUBMARKET DELHI
AVERAGE EFFECTIVE RENT $656
OCCUPANCY 90%
HVAC BOILER BASED HEAT THROUGH WALL A/C
UTILITY RESPONSIBILITY:
RESIDENT PAYS: ELECTRIC
OWNER PAYS: WATER, SEWER, TRASH, GAS
CAPEX SINCE 2020:
- 20% of Units Have LVP Flooring Throughout
3050 MICKEY AVE YB: 1963
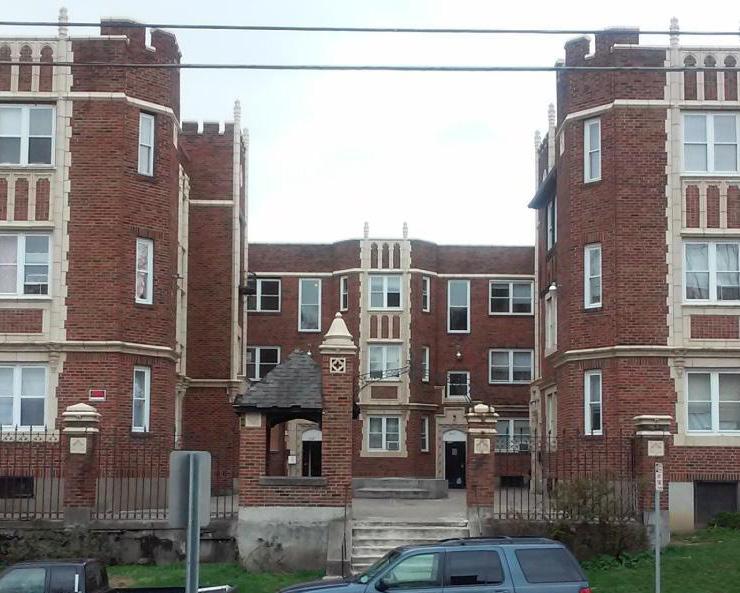
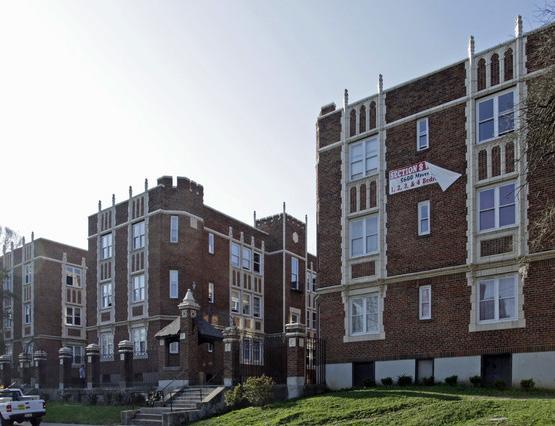
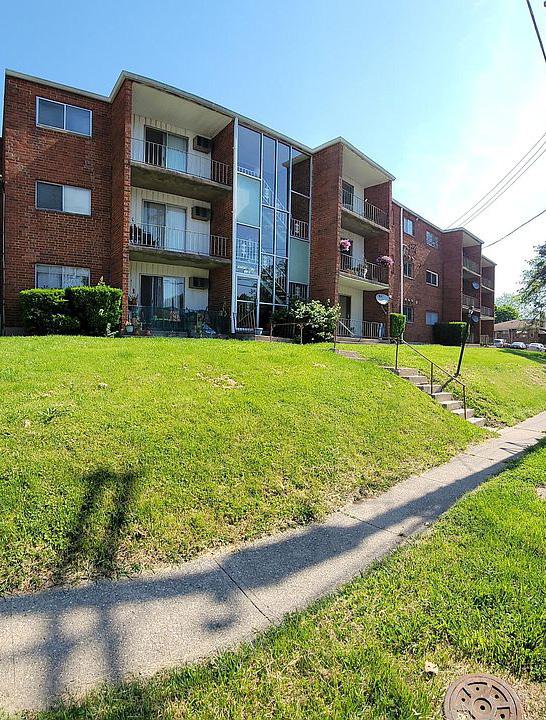
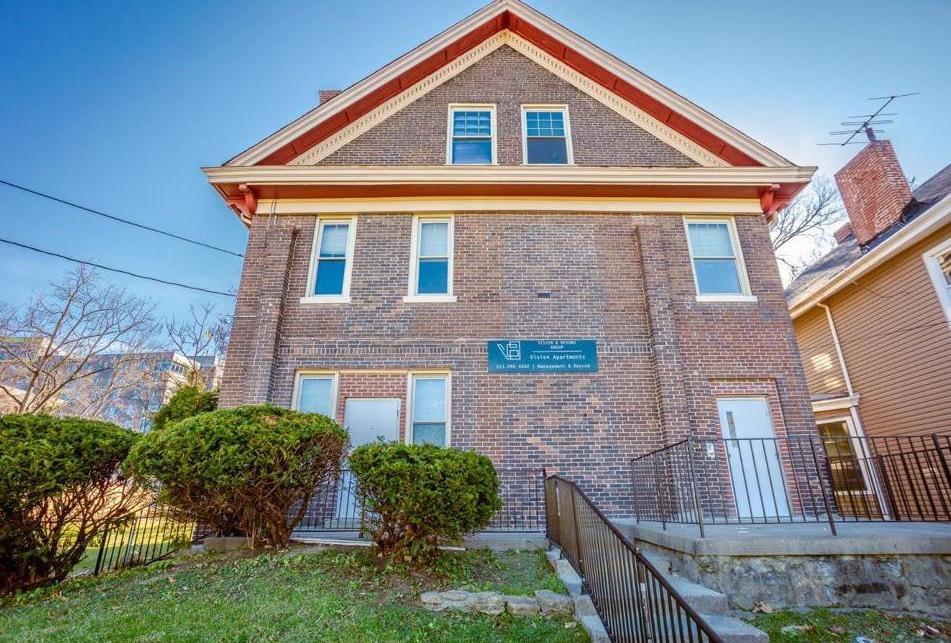
603-613 FOREST AVE YB: 1929
620 PEDRETTI & 4480 FOLEY YB: 1964
THE 222
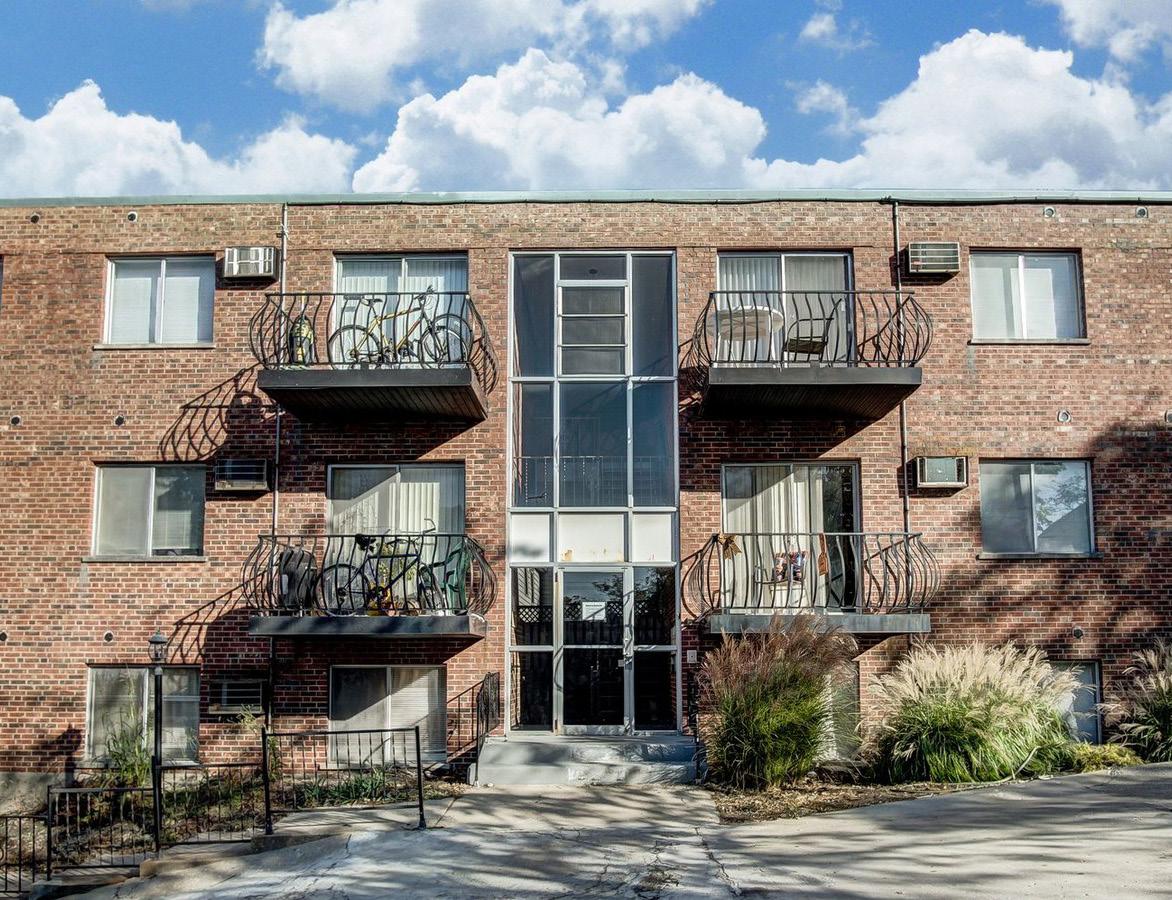
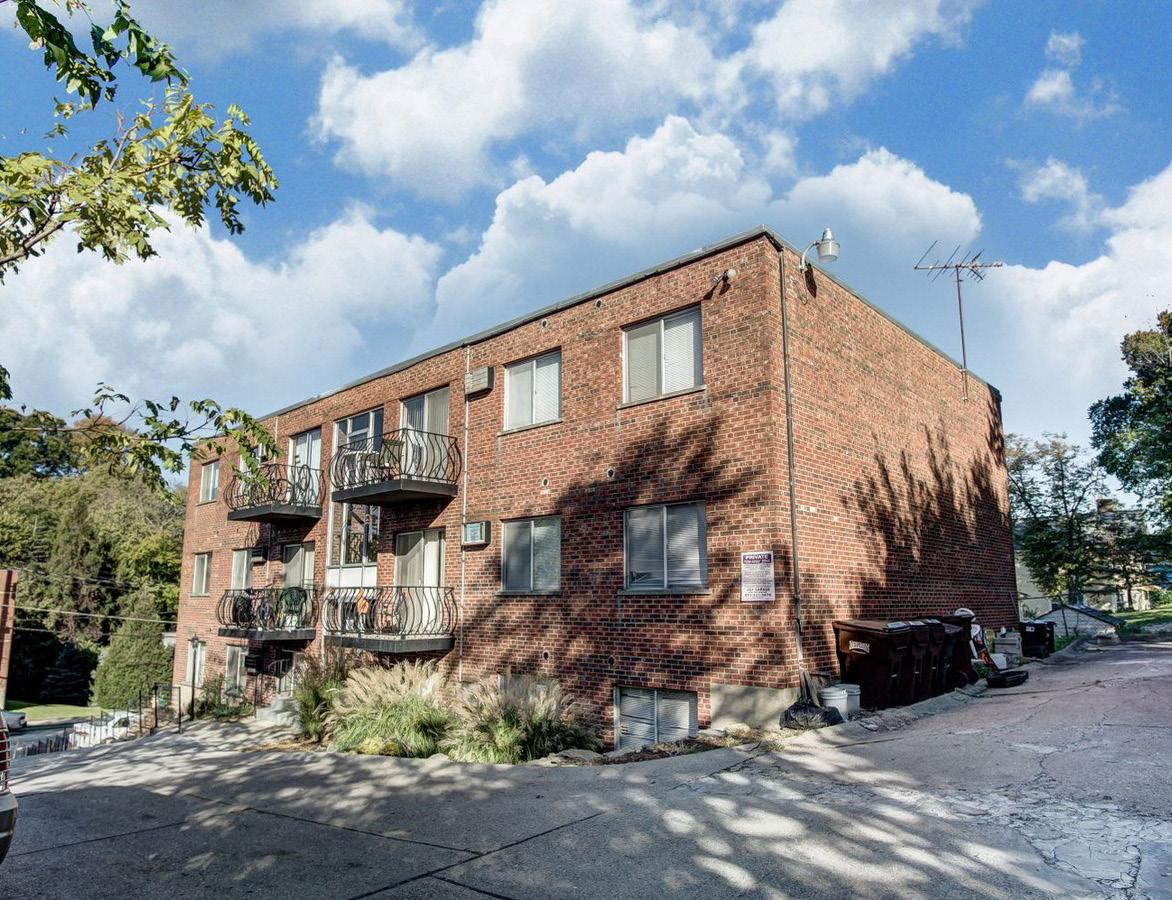
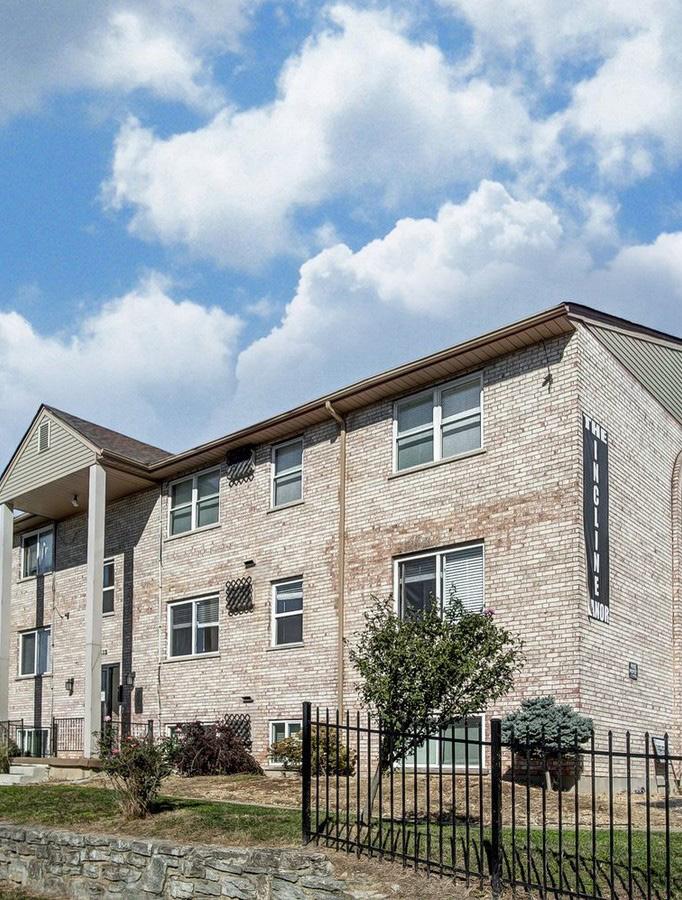
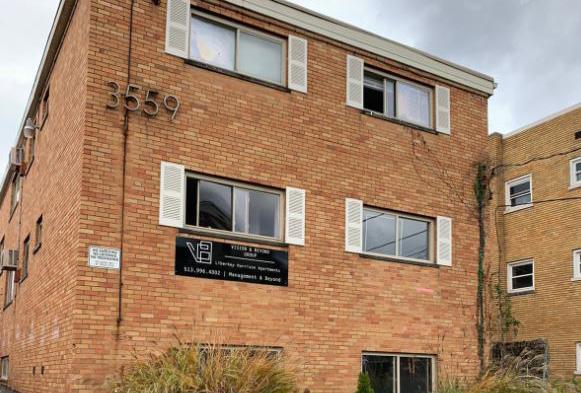
3113-3115 WERK ROAD YB: 1966
UNITS 22
SUBMARKET WESTWOOD
AVERAGE EFFECTIVE RENT $697
OCCUPANCY 88%
HVAC BOILER BASED HEAT THROUGH WALL A/C
UTILITY RESPONSIBILITY:
RESIDENT PAYS: ELECTRIC
OWNER PAYS: WATER, SEWER, TRASH, GAS
CAPEX SINCE 2020:
-30% of Unit Have LVP Flooring Throughout
2821-2822 PRICE AVE YB: 1980
UNITS 24
SUBMARKET EAST PRICE HILL
AVERAGE EFFECTIVE RENT $731
OCCUPANCY 92%
HVAC BOILER BASED HEAT THROUGH WALL A/C (2017)
UTILITY RESPONSIBILITY:
RESIDENT PAYS: ELECTRIC
OWNER PAYS: WATER, SEWER, TRASH, GAS
UNITS 11
SUBMARKET EAST PRICE HILL
AVERAGE EFFECTIVE RENT $710
OCCUPANCY 82%
HVAC BOILER BASED HEAT THROUGH WALL A/C
UTILITY RESPONSIBILITY:
RESIDENT PAYS: ELECTRIC
OWNER PAYS: WATER, SEWER, TRASH, GAS
CAPEX SINCE 2019:
- New Flat Rubber Membrane Roof (complete tear-off)
- Three Units with LVP Flooring Throughout
808 HARRIS AVE YB: 1973
PROPERTY DETAILS
UNITS 11
SUBMARKET WESTWOOD
AVERAGE EFFECTIVE RENT $628
OCCUPANCY 73%
HVAC BOILER BASED HEAT THROUGH WALL A/C
UTILITY RESPONSIBILITY:
RESIDENT PAYS: ELECTRIC
OWNER PAYS: WATER, SEWER, TRASH, GAS
CAPEX SINCE 2020:
-20% of Units Have LVP Flooring Throughout
UNITS 11
SUBMARKET CHEVIOT
AVERAGE EFFECTIVE RENT $711
OCCUPANCY 64%
HVAC BOILER BASED HEAT THROUGH WALL A/C (2017)
UTILITY RESPONSIBILITY:
RESIDENT PAYS: ELECTRIC
OWNER PAYS: WATER, SEWER, TRASH, GAS
CAPEX SINCE 2020:
-30% of Unit Have LVP Flooring Throughout
UNITS 12 & OFFICE
SUBMARKET WESTWOOD
AVERAGE EFFECTIVE RENT $732
OCCUPANCY 85%
HVAC BOILER BASED HEAT THROUGH WALL A/C
UTILITY RESPONSIBILITY:
RESIDENT PAYS: ELECTRIC
OWNER PAYS: WATER, SEWER, TRASH, GAS
5015 SIDNEY ROAD YB: 1963
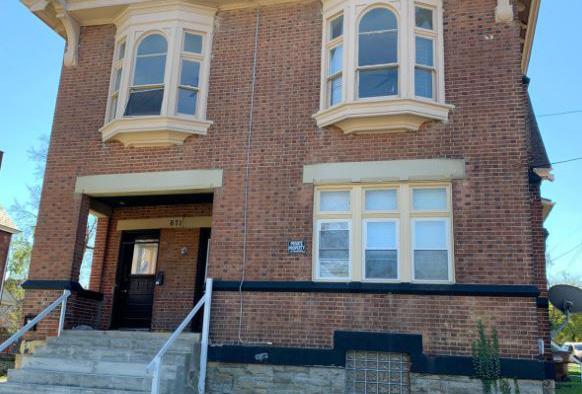
3841 NOLAN AVE YB: 1963
3316 WERK ROAD YB: 1985
THE 222
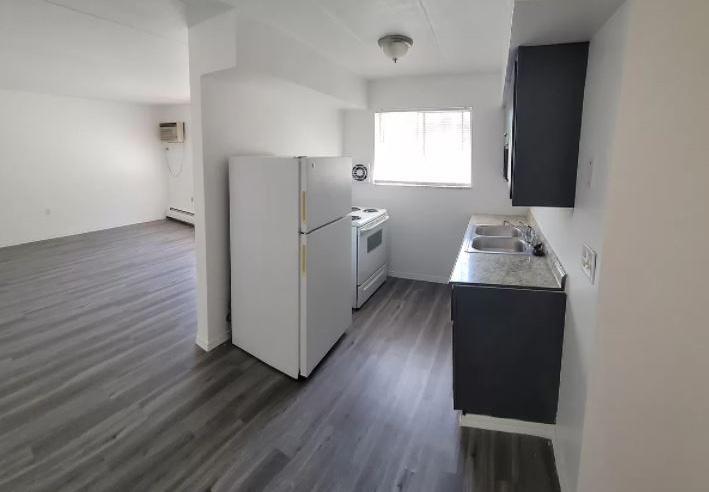
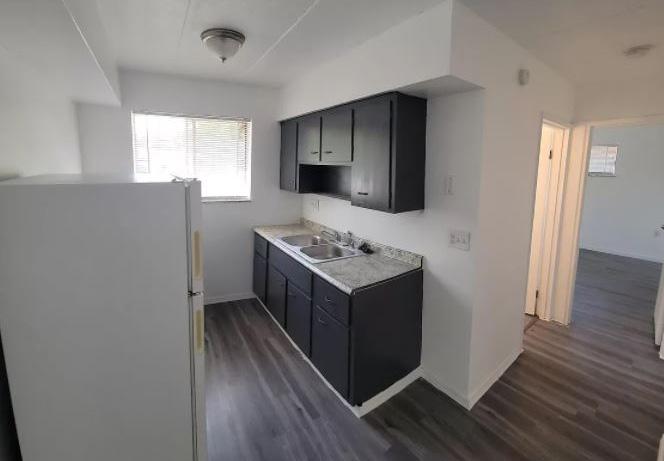
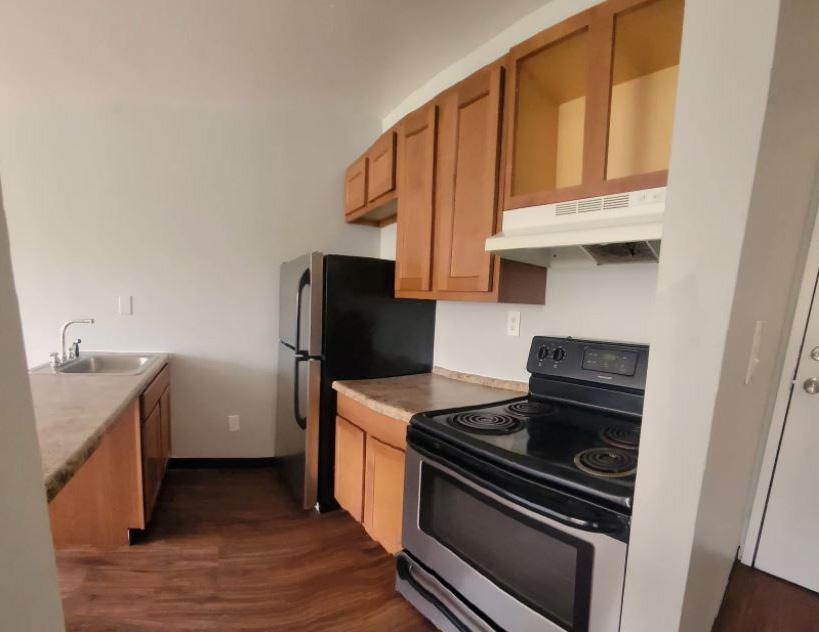
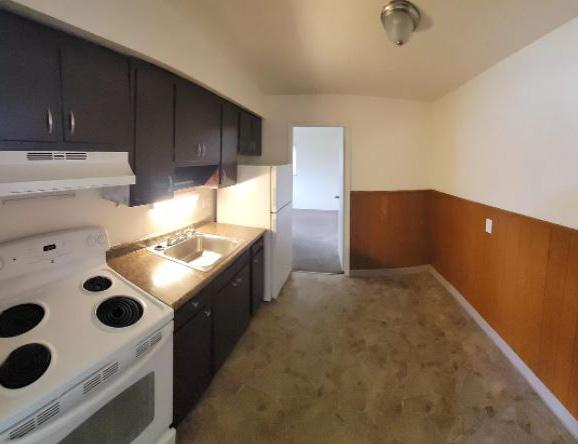
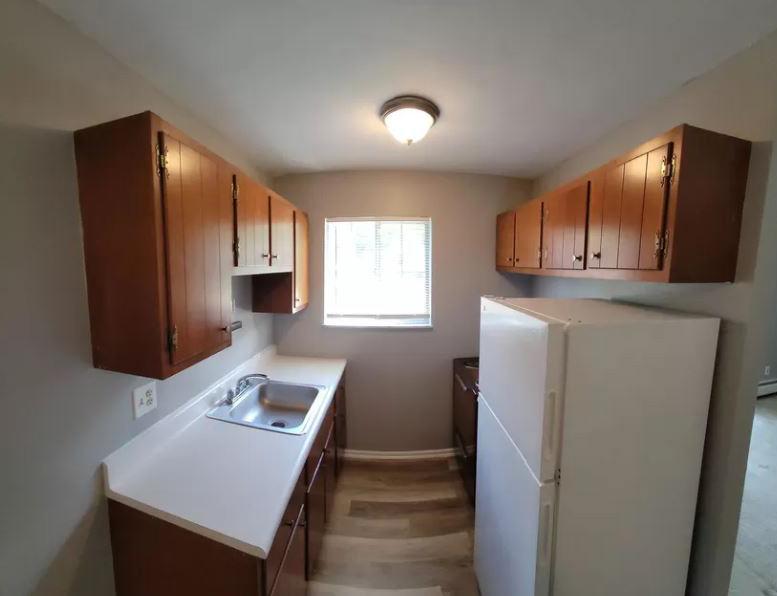
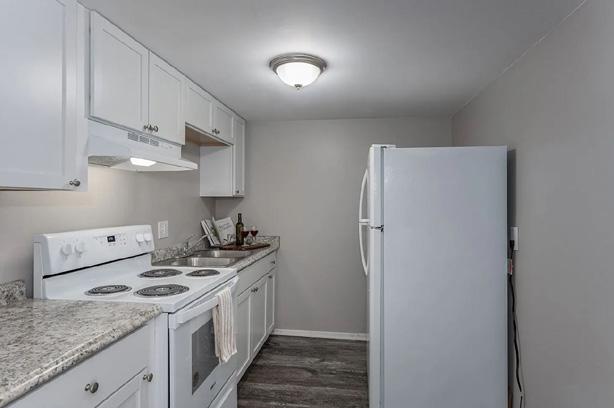
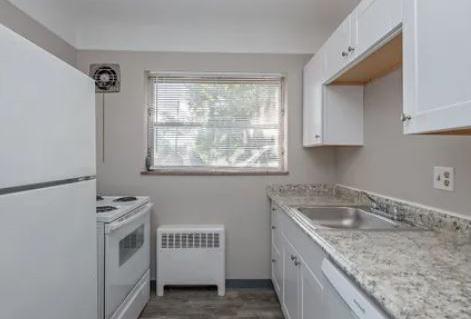
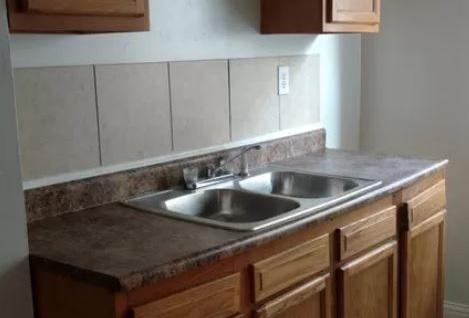
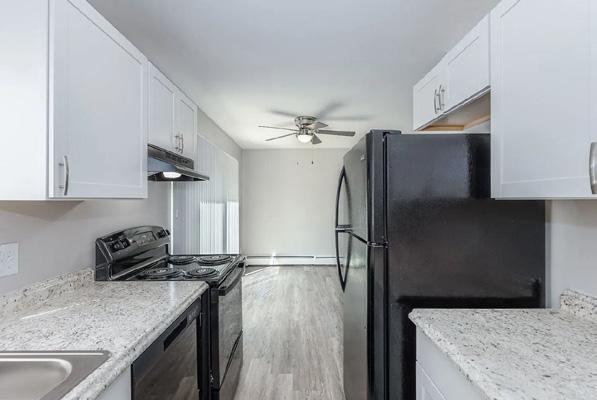
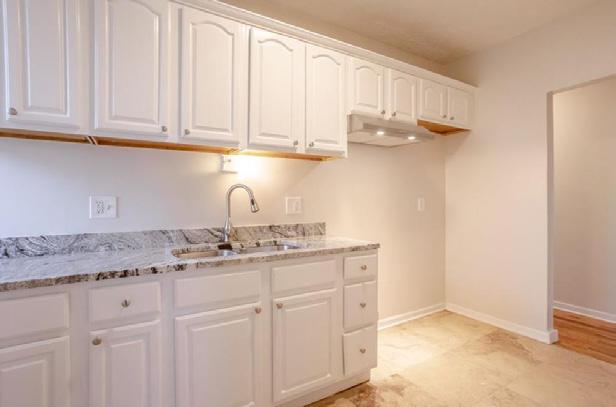
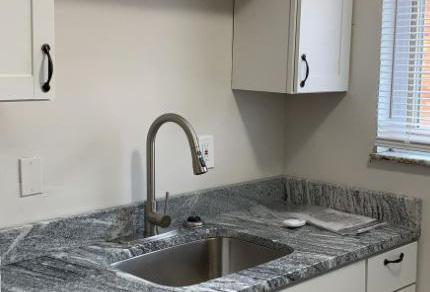
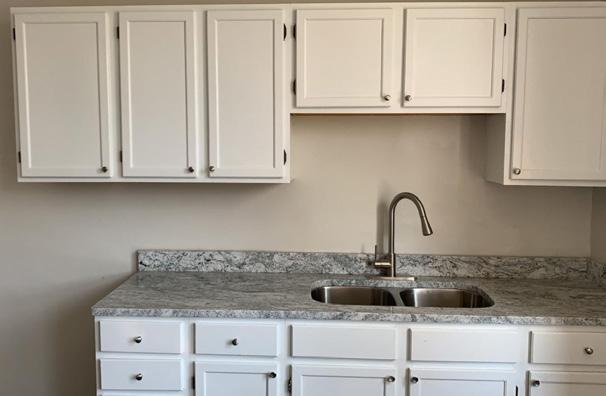
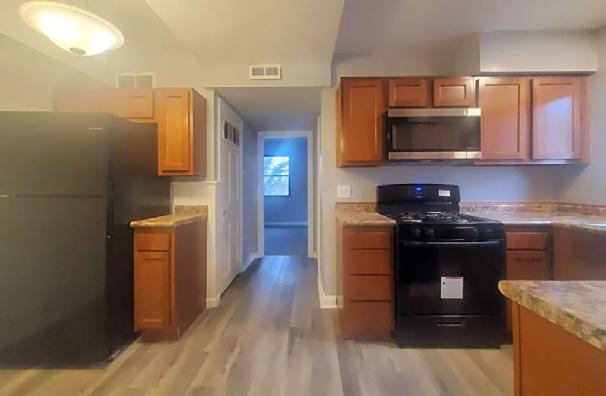
 5015 Sidney kitchen
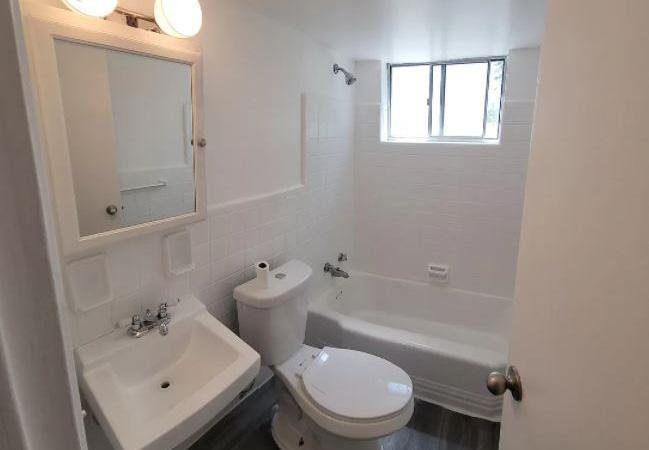
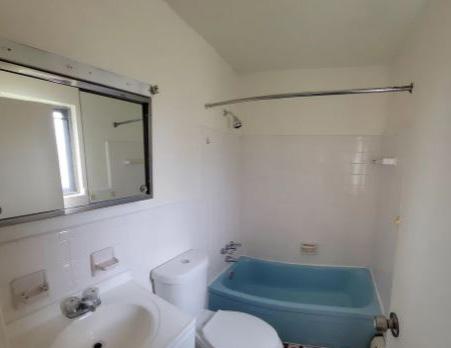
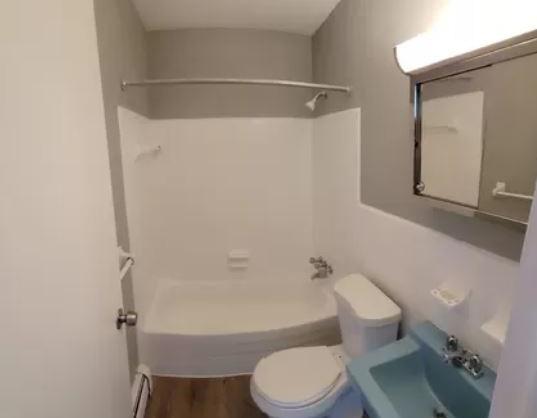
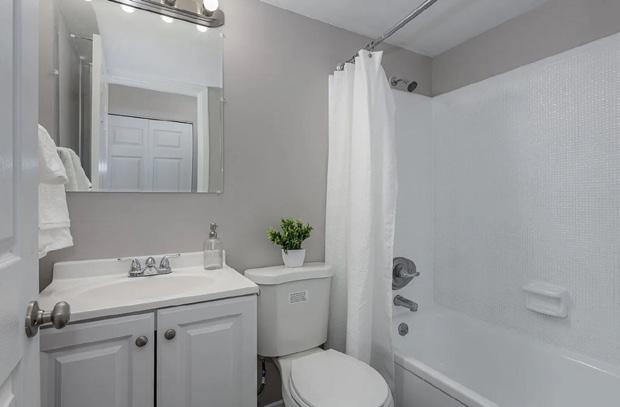
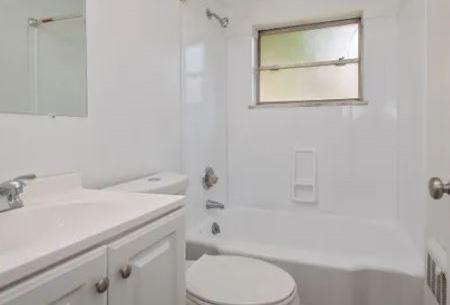
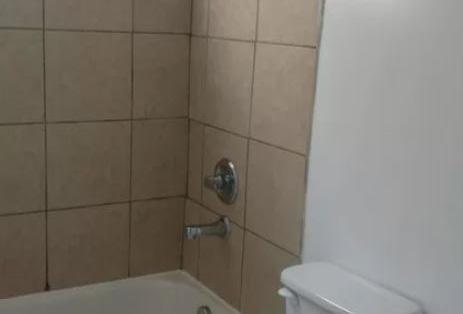
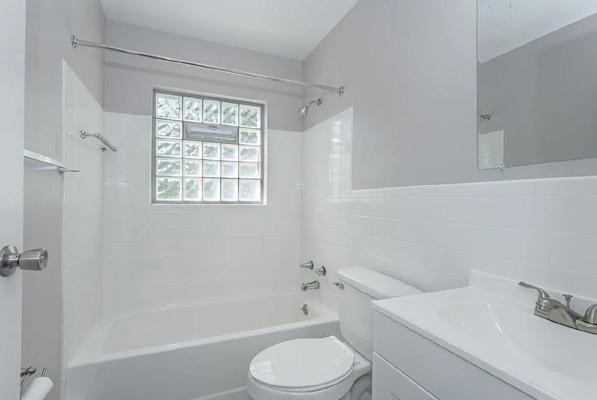
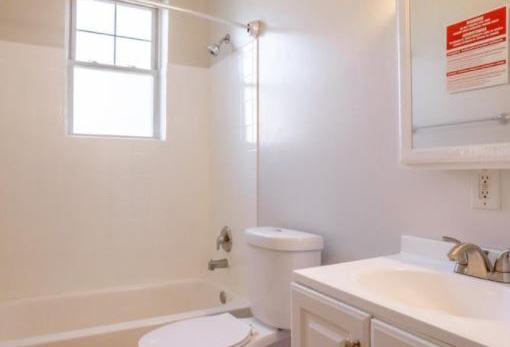
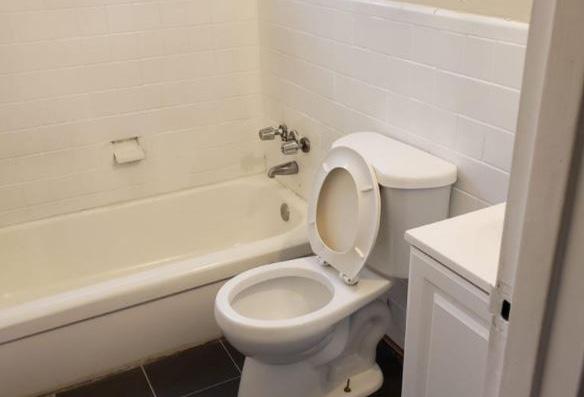
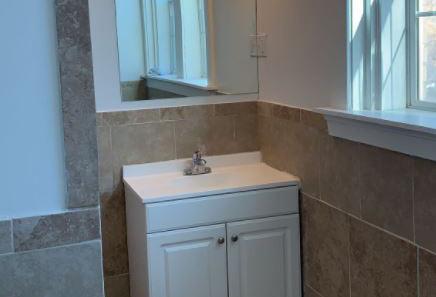
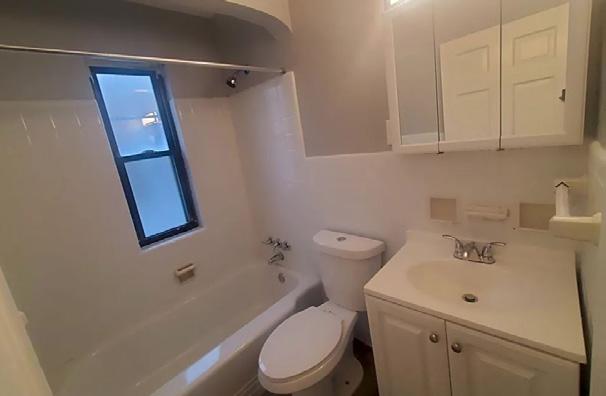
5015 Sidney Bathroom
5015 Sidney kitchen
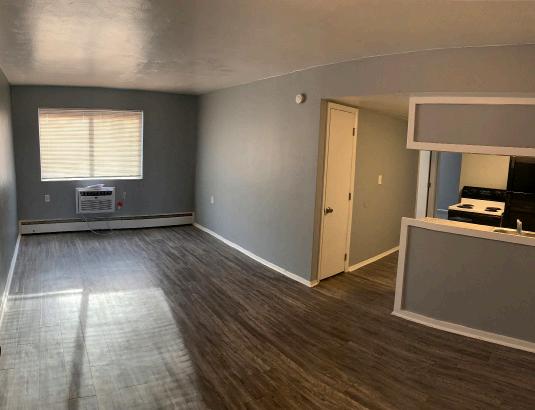
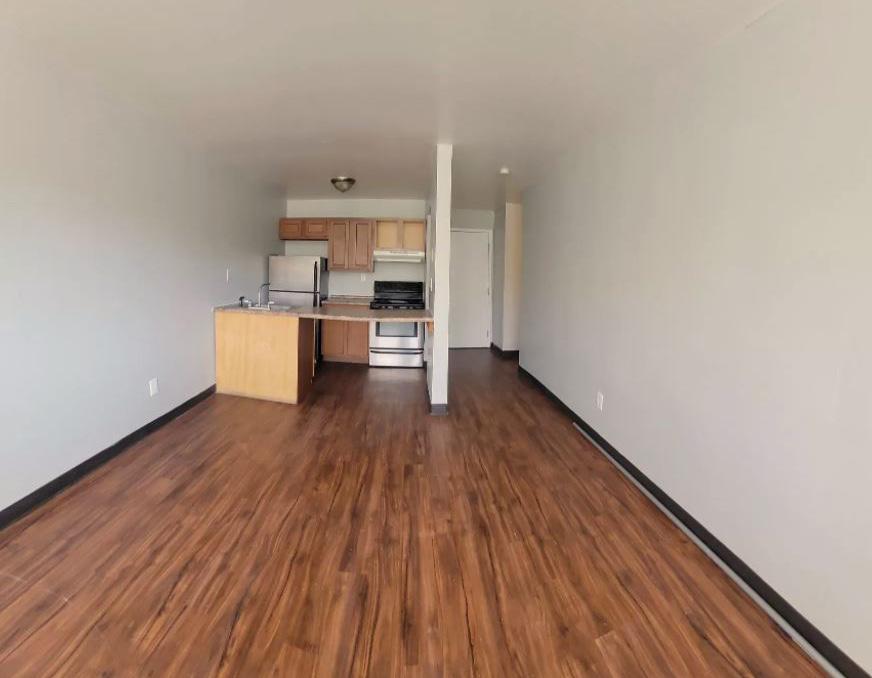
3113 Werk Living
5015 Sidney kitchen
5015 Sidney Bathroom
5015 Sidney kitchen
3113 Werk Living
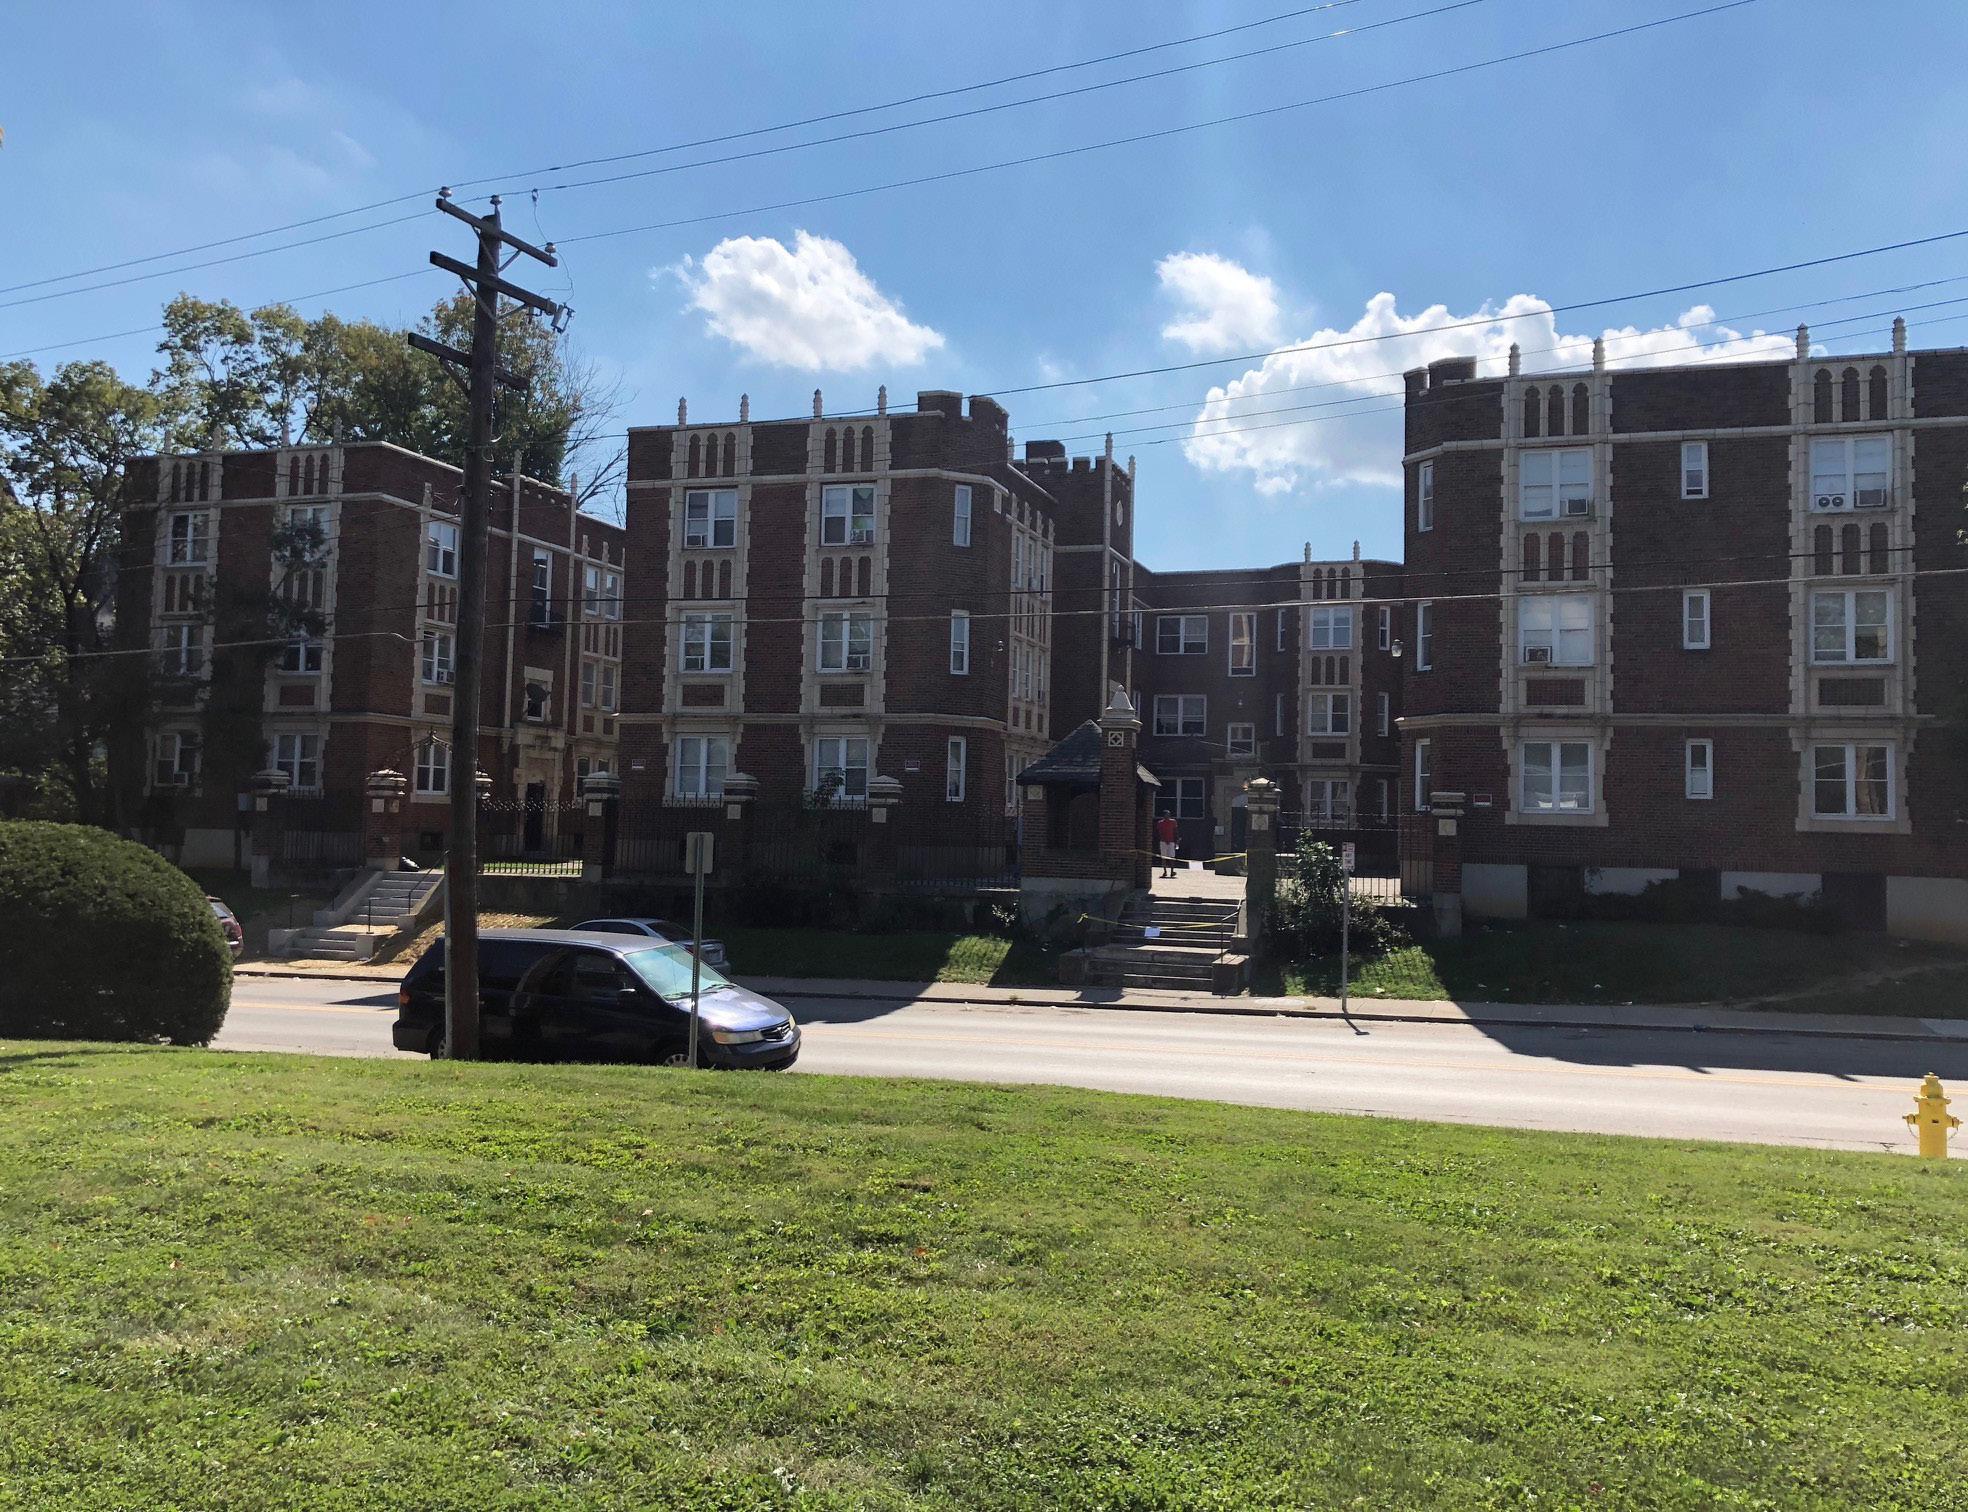
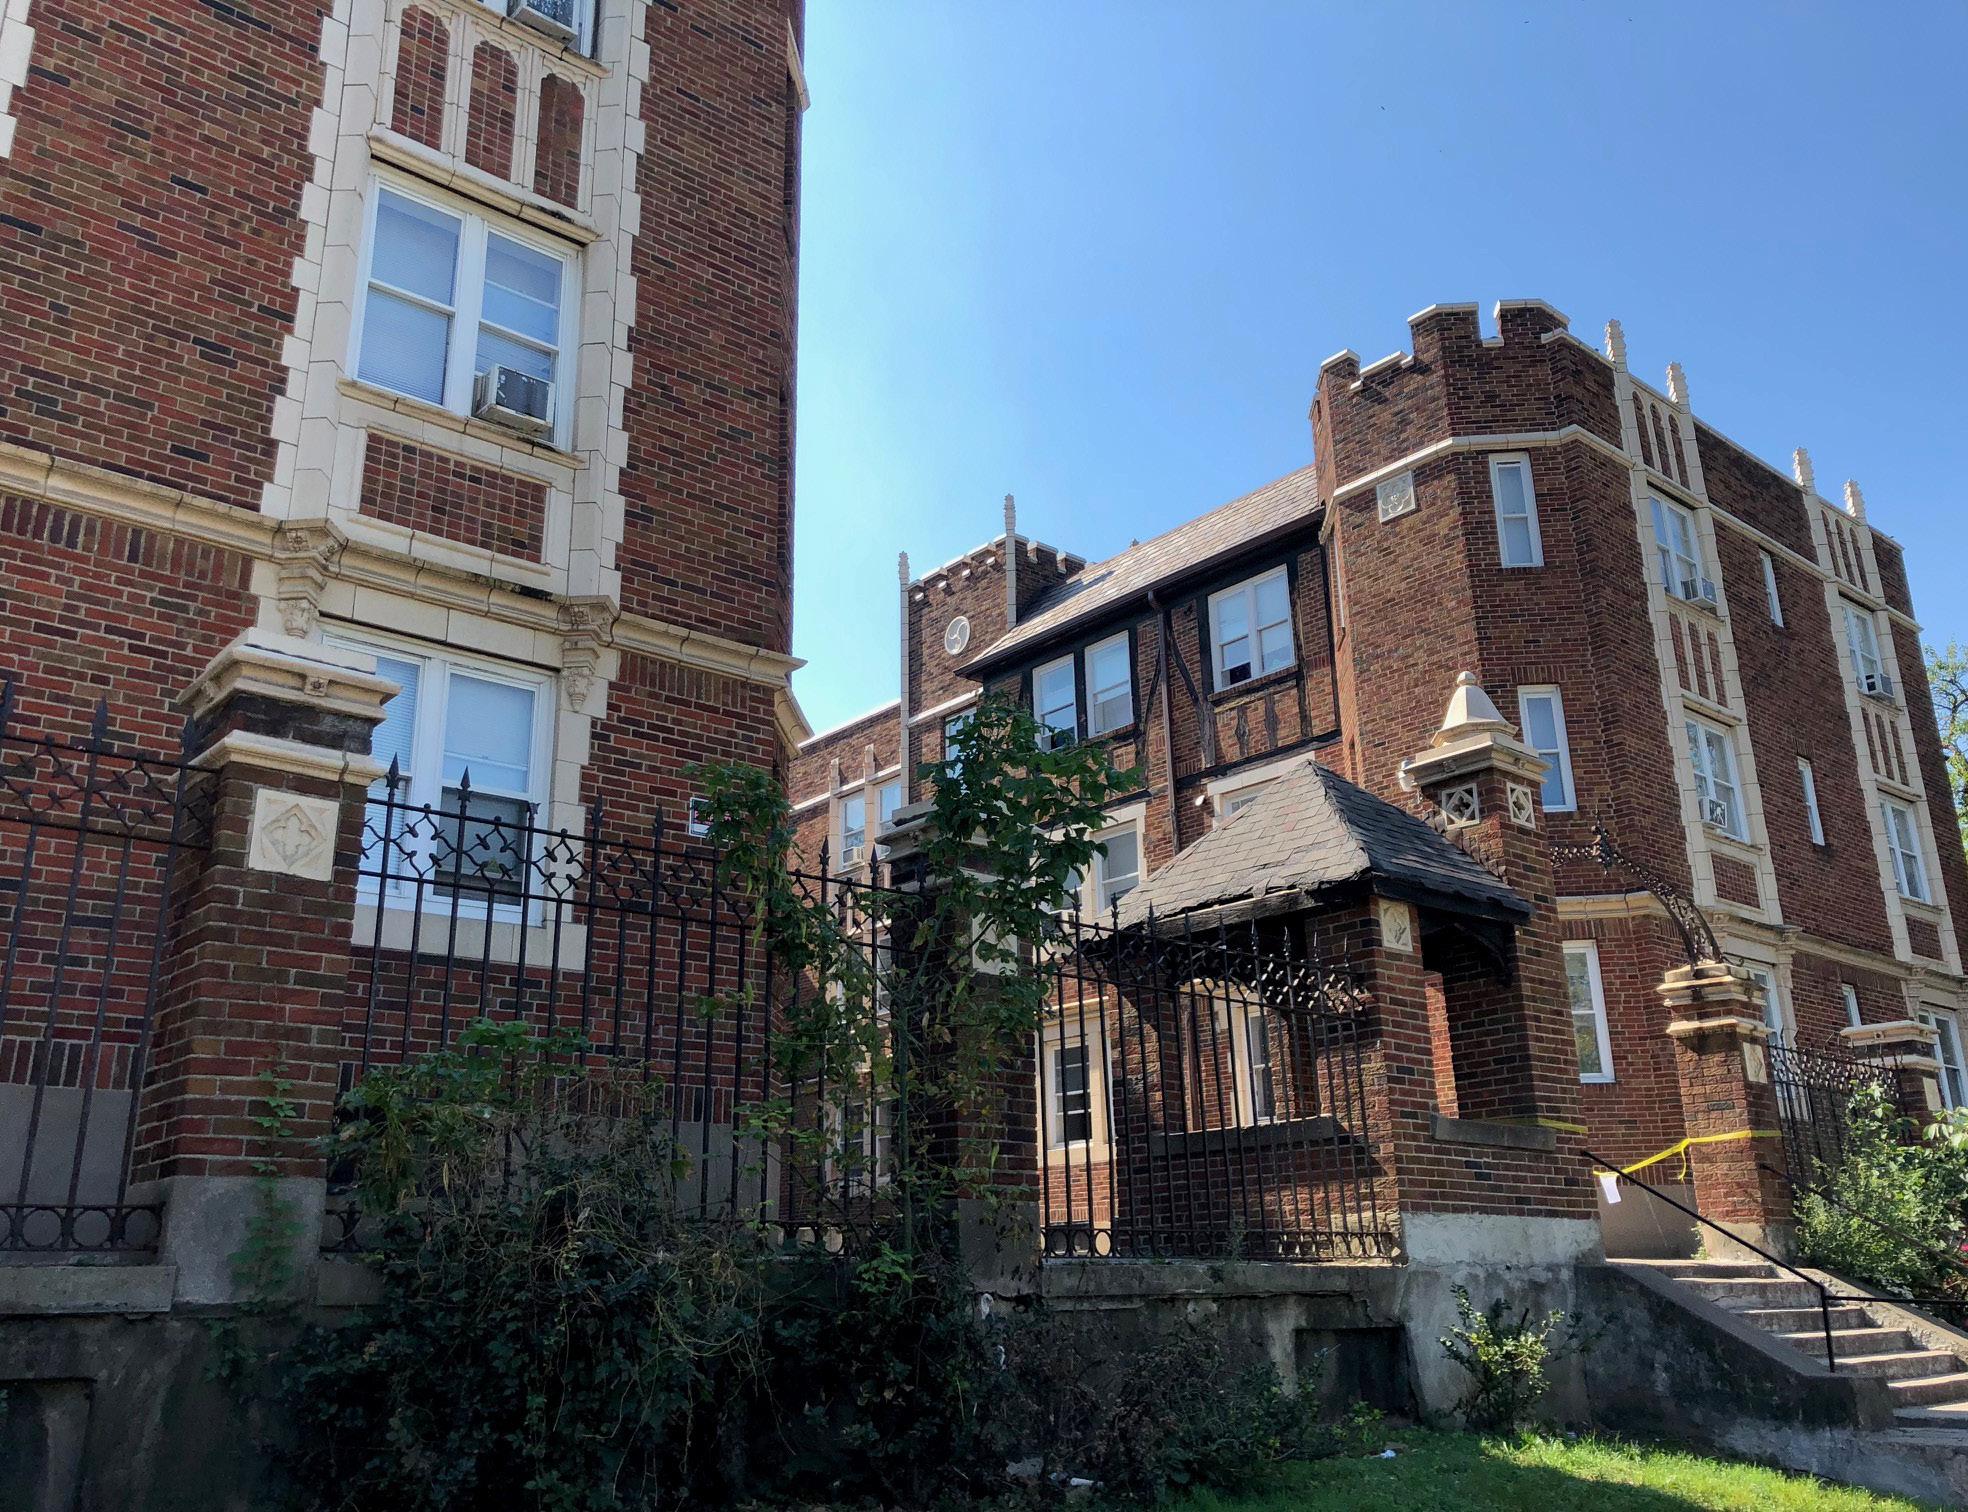
603-609 Forest Ave Ext 603-609 Forest Ave Ext 3050 Mickey Ave 603-609 Forest Ave Ext photos
603-609 Forest Ave Ext 603-609 Forest Ave Ext Crystal Apts 603-609 Forest Living
photos
 808 Harris Ext
Crystal Apts
808 Harris Ext
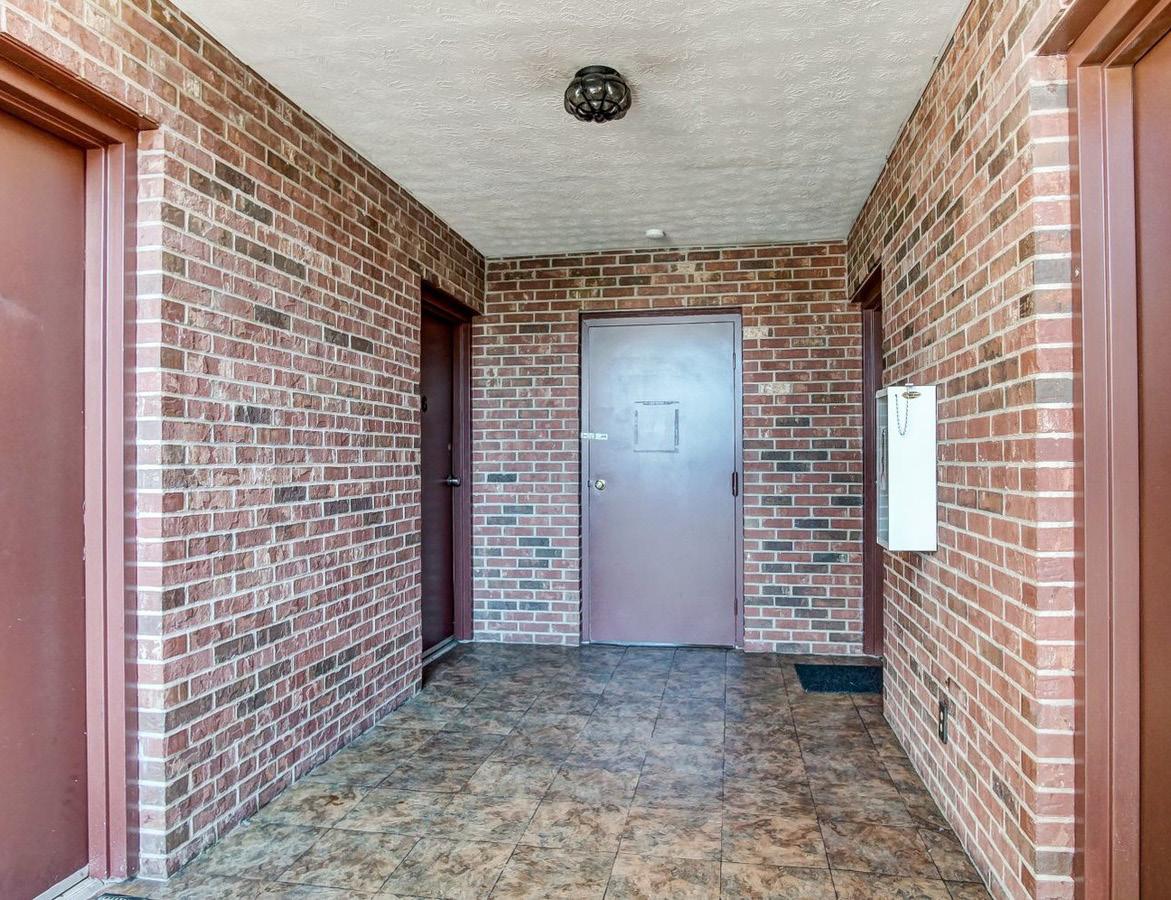
808 Harris Hallway
808 Harris Ext
Crystal Apts
808 Harris Ext
808 Harris Hallway
 808 Harris
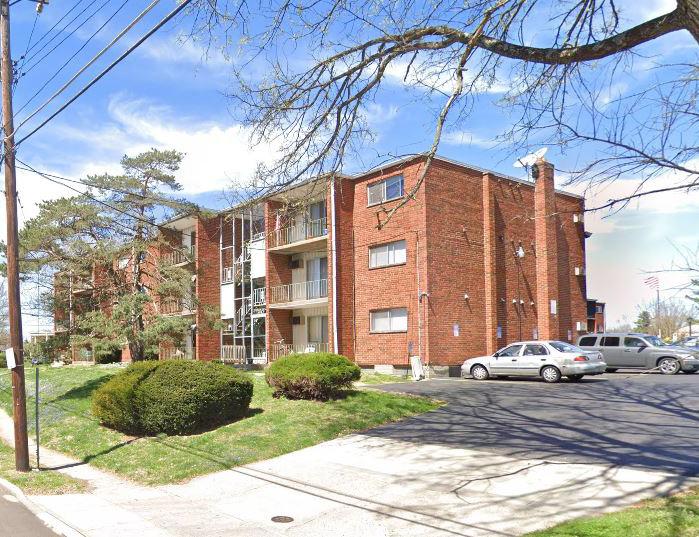
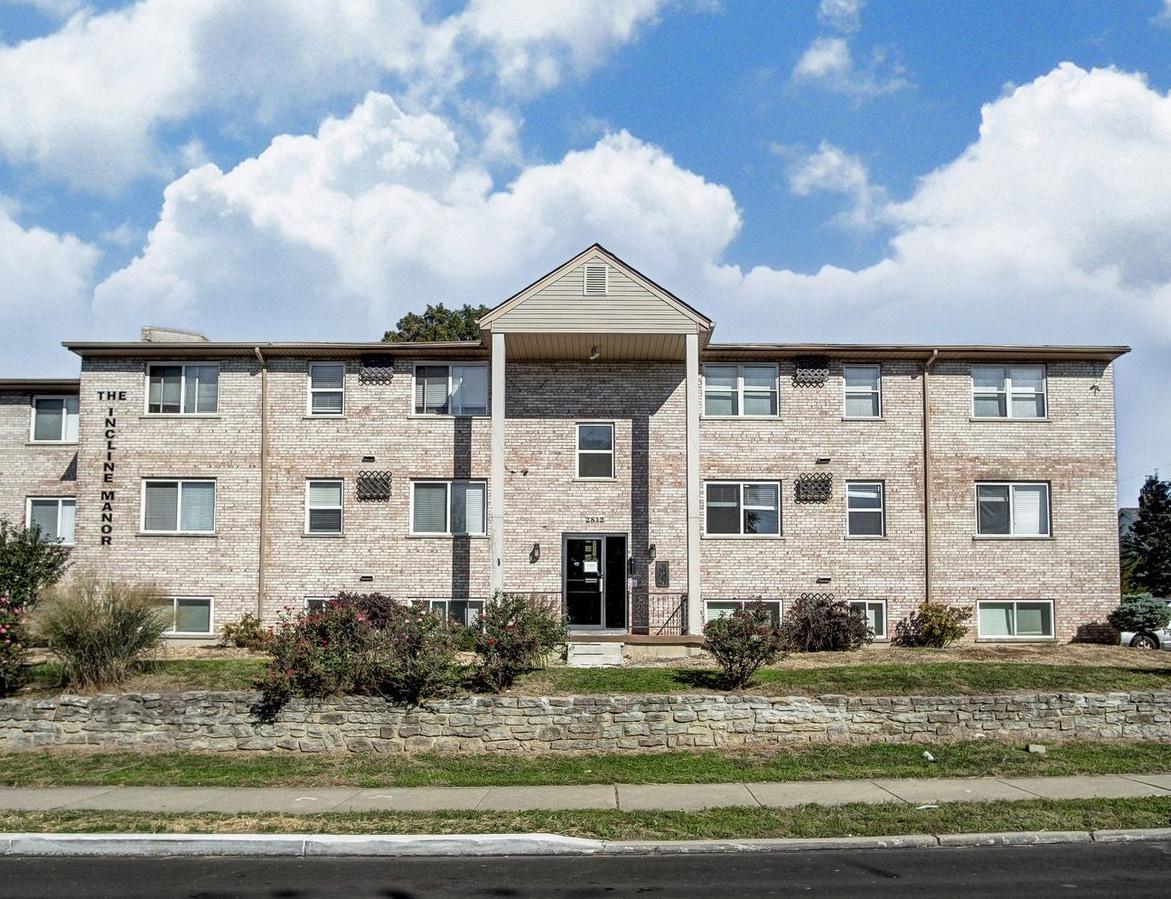
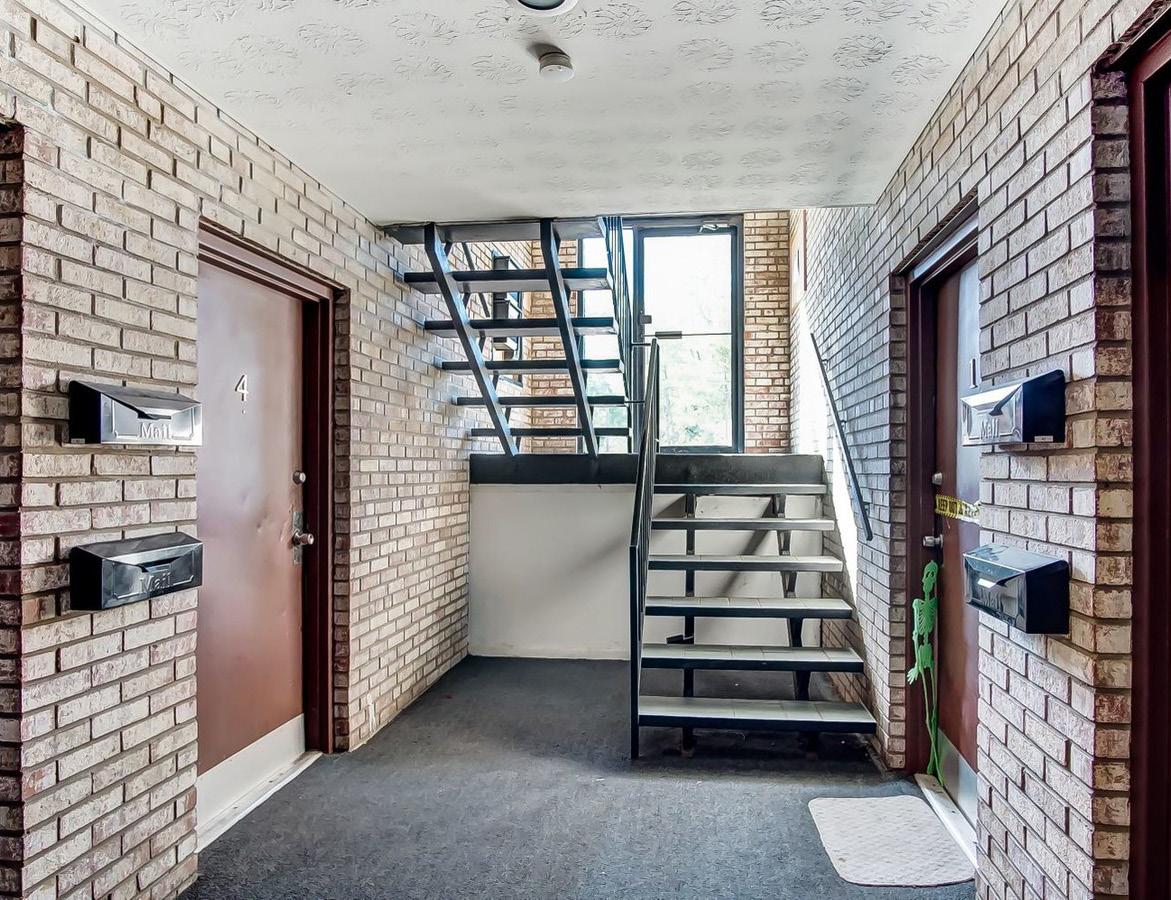
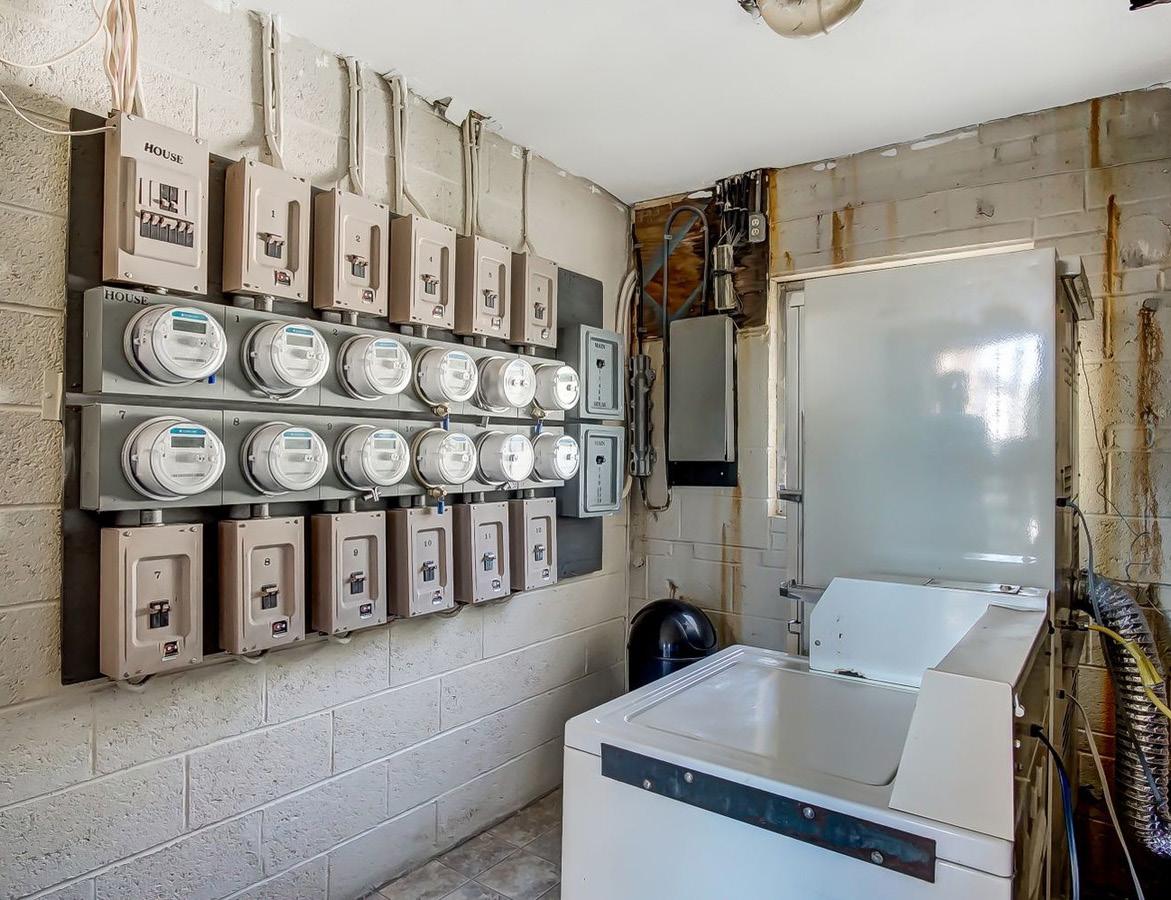
2812 Price Street
2812 Price Street
2812 Price Street
808 Harris
2812 Price Street
2812 Price Street
2812 Price Street
photos
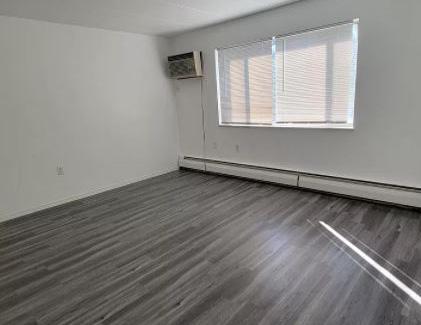
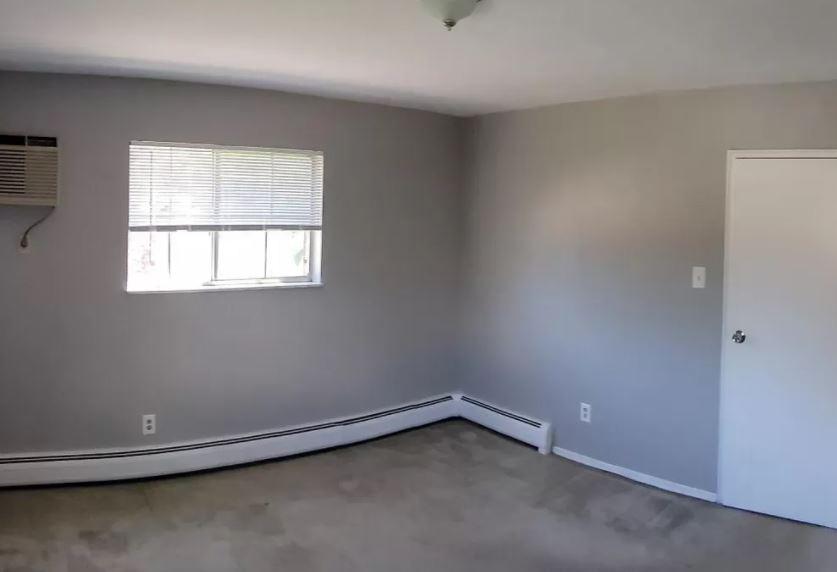
 5015 Sidney Livingroom
3841 Nolan Kitchen
3050 Mickey Kitchen
3841 Nolan Bath
5015 Sidney Livingroom
3841 Nolan Kitchen
3050 Mickey Kitchen
3841 Nolan Bath
Werk Bathroom
Werk
3113
3116
Bathroom 3113 Werk Kichen
3050 Mickey Kitchen
THE 222 FINANCIALS
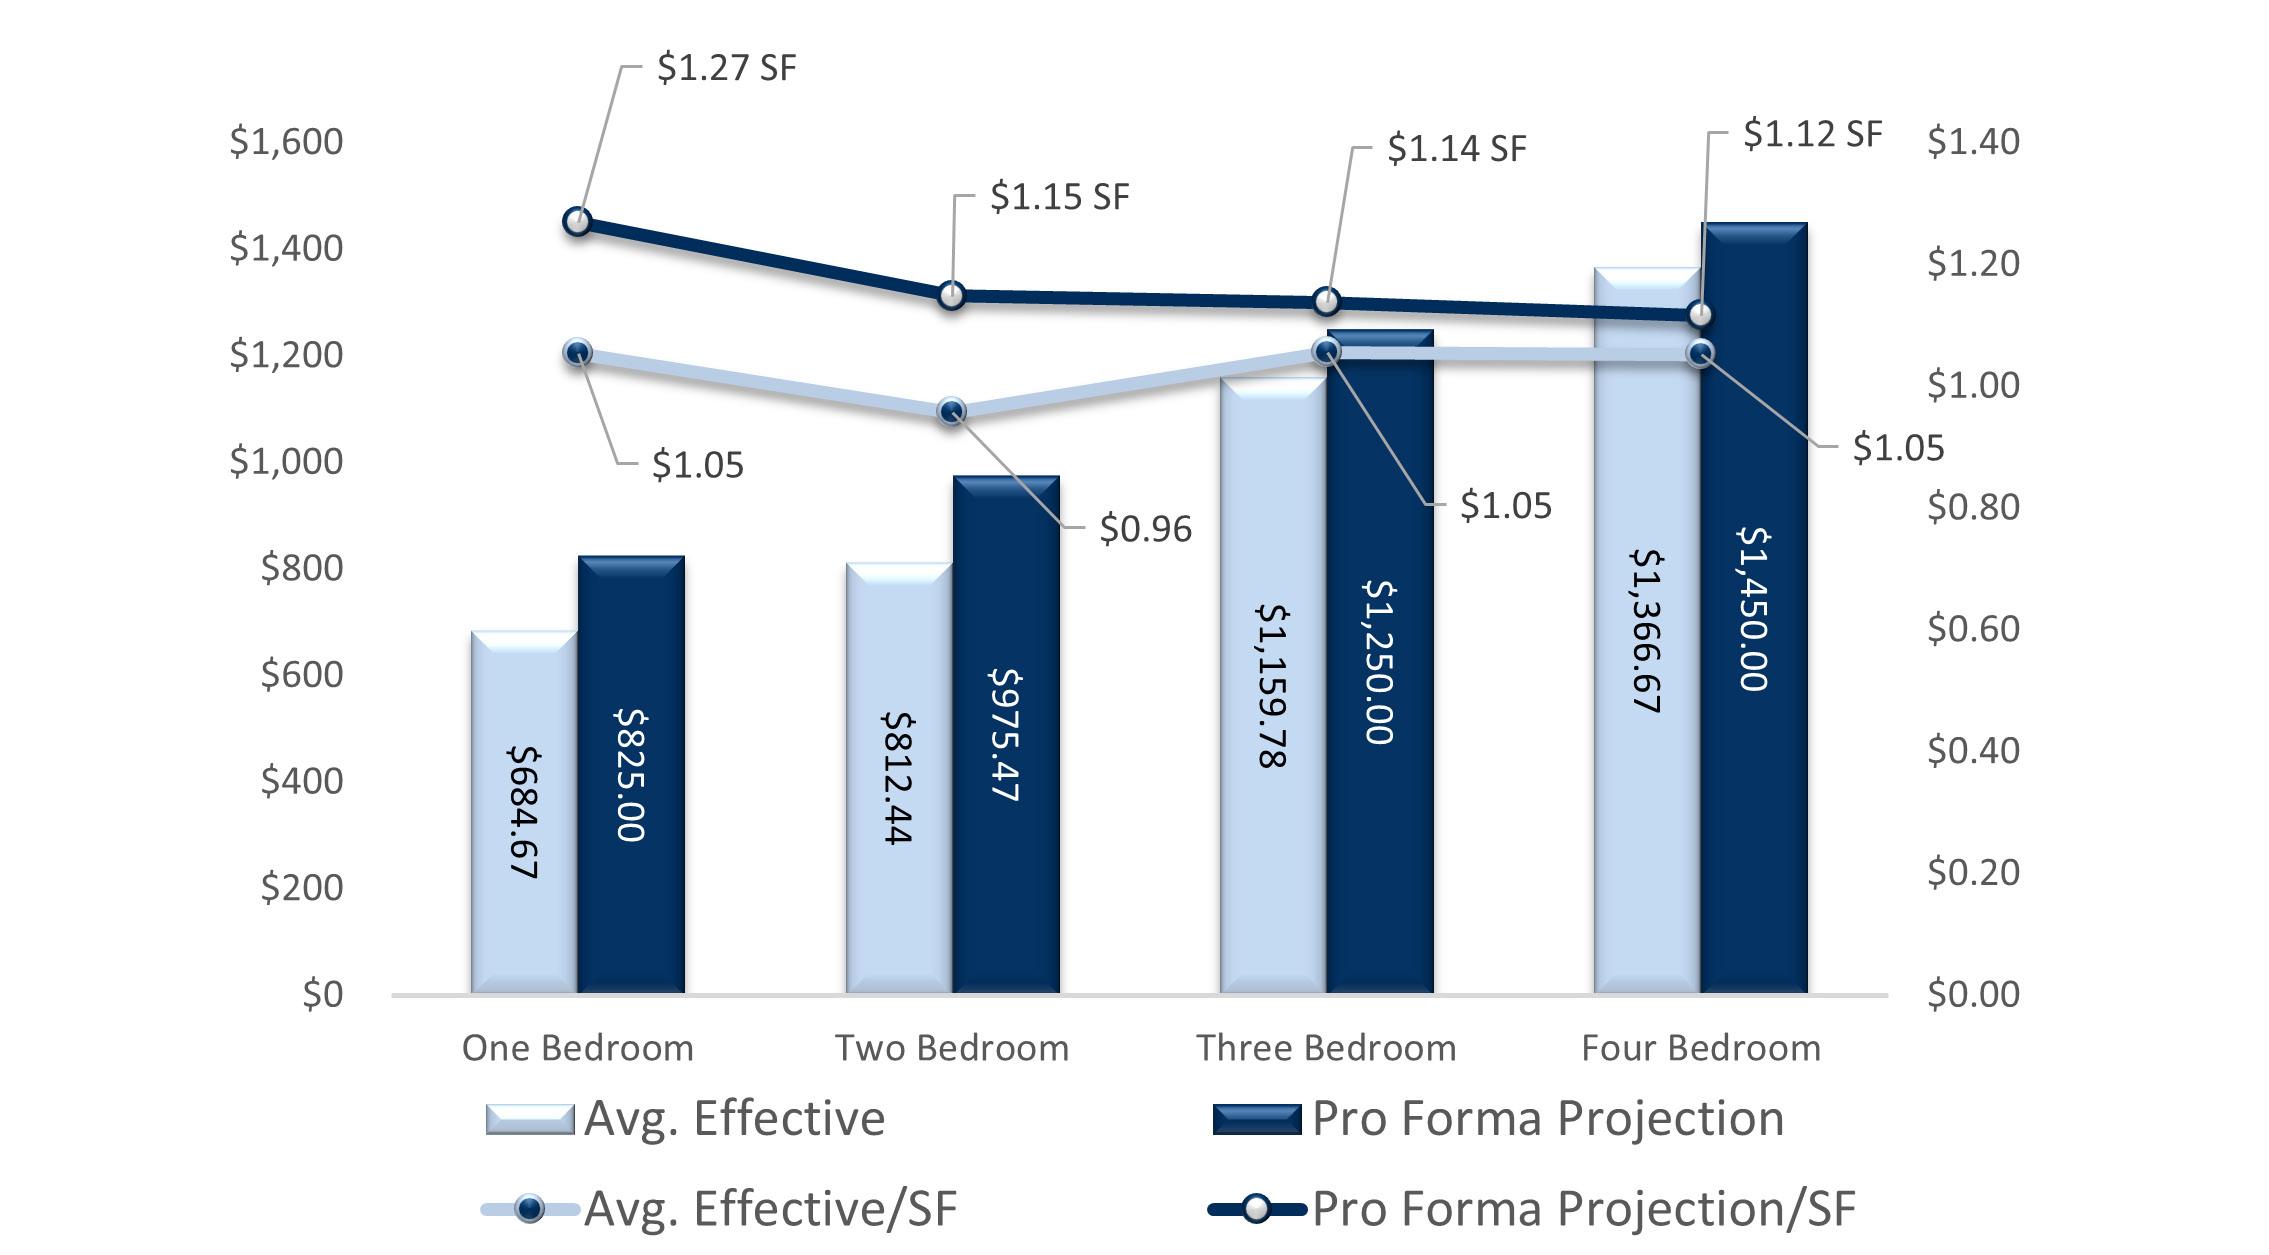

UNIT MIX SUMMARY
UNIT DISTRIBUTION UNIT RENTS
AVERAGE EFFECTIVE MARKET PROJECTED UNIT TYPE NO. OF UNITS RENTABLE SF TOTAL SF RENT/UNIT RENT/SF TOTAL RENT POTENTIAL RENT/UNIT RENT/SF TOTAL RENT POTENTIAL RENT/UNIT RENT/SF TOTAL RENT POTENTIAL SUMMARY One Bedroom 166 Units 650 SF 107,900 SF $684.67 $1.05 $113,656 $756.30 $1.16 SF $125,545 $825.00 $1.27 SF $136,950 Two Bedroom 43 Units 850 SF 36,550 SF $812.44 $0.96 $34,935 $854.07 $1.00 SF $36,725 $975.47 $1.15 SF $41,945 Three Bedroom 9 Units 1,100 SF 9,900 SF $1,159.78 $1.05 $10,438 $1,248.00 $1.13 SF $11,232 $1,250.00 $1.14 SF $11,250 Four Bedroom 3 Units 1,300 SF 3,900 SF $1,366.67 $1.05 $4,100 $1,450.00 $1.12 SF $4,350 $1,450.00 $1.12 SF $4,350 Office 1 Units 1,200 SF 1,200 SF $1,500.00 $1.25 $1,500 $1,500.00 $1.25 SF $1,500 $1,550.00 $1.29 SF $1,550 Totals / Wtd. Averages 222 Units 718 SF 159,450 SF $741.57 $1.03 SF $164,629 $807.89 $1.12 SF $179,352 $883.09 $1.23 SF $196,045
UNIT MIX BREAKDOWN THE 222 FINANCIALS

AVERAGE EFFECTIVE MARKET PROJECTED UNIT TYPE NO. OF UNITS RENTABLE SF TOTAL SF RENT/UNIT RENT/SF TOTAL RENT POTENTIAL RENT/UNIT RENT/SF TOTAL RENT POTENTIAL RENT/UNIT RENT/SF TOTAL RENT POTENTIAL One Bedroom 1BR/1BA - 2812-2822 Price Ave 22 Units 650 SF 14,300 SF $730.25 $1.12 SF $16,066 $750.00 $1.15 SF $16,500 $825.00 $1.27 SF $18,150 1BR/1BA - 3050 Mickey Ave 35 Units 650 SF 22,750 SF $705.39 $1.09 SF $24,689 $750.00 $1.15 SF $26,250 $825.00 $1.27 SF $28,875 1BR/1BA - 3113-3115 Werk 22 Units 650 SF 14,300 SF $697.62 $1.07 SF $15,348 $750.00 $1.15 SF $16,500 $825.00 $1.27 SF $18,150 1BR/1BA - 3316 Werk 9 Units 650 SF 5,850 SF $646.88 $1.00 SF $5,822 $750.00 $1.15 SF $6,750 $825.00 $1.27 SF $7,425 1BR/1BA - 3841 Nolan 5 Units 650 SF 3,250 SF $637.50 $0.98 SF $3,188 $650.00 $1.00 SF $3,250 $825.00 $1.27 SF $4,125 1BR/1BA - 4480 Foley 18 Units 650 SF 11,700 SF $634.76 $0.98 SF $11,426 $765.00 $1.18 SF $13,770 $825.00 $1.27 SF $14,850 1BR/1BA - 5015 Sidney 11 Units 650 SF 7,150 SF $628.13 $0.97 SF $6,909 $750.00 $1.15 SF $8,250 $825.00 $1.27 SF $9,075 1BR/1BA - 603-613 Forest Ave 14 Units 650 SF 9,100 SF $753.55 $1.16 SF $10,550 $875.00 $1.35 SF $12,250 $825.00 $1.27 SF $11,550 1BR/1BA - 620 Pedretti 19 Units 650 SF 12,350 SF $623.61 $0.96 SF $11,849 $725.00 $1.12 SF $13,775 $825.00 $1.27 SF $15,675 1BR/1BA - 808 Harris Ave 11 Units 650 SF 7,150 SF $710.11 $1.09 SF $7,811 $750.00 $1.15 SF $8,250 $825.00 $1.27 SF $9,075 Totals / Wtd. Averages 166 Units 650 SF 107,900 SF $684.67 $1.05 SF $113,656 $756.30 $1.16 SF $125,545 $825.00 $1.27 SF $136,950 Two Bedroom 2BR/1BA - 2812 - 2822 Price Ave 2 Units 850 SF 1,700 SF $750.00 $0.88 SF $1,500 $750.00 $0.88 SF $1,500 $975.00 $1.15 SF $1,950 2BR/1BA - 3050 Mickey Ave 11 Units 850 SF 9,350 SF $823.73 $0.97 SF $9,061 $850.00 $1.00 SF $9,350 $975.00 $1.15 SF $10,725 2BR/1BA - 3316 Werk 3 Units 850 SF 2,550 SF $733.33 $0.86 SF $2,200 $825.00 $0.97 SF $2,475 $975.00 $1.15 SF $2,925 2BR/1BA - 3841 Nolan 6 Units 850 SF 5,100 SF $772.50 $0.91 SF $4,635 $850.00 $1.00 SF $5,100 $975.00 $1.15 SF $5,850 2BR/1BA - 4480 Foley 6 Units 850 SF 5,100 SF $785.00 $0.92 SF $4,710 $850.00 $1.00 SF $5,100 $975.00 $1.15 SF $5,850 2BR/1BA - 603-613 Forest Ave 9 Units 850 SF 7,650 SF $958.75 $1.13 SF $8,629 $1,000.00 $1.18 SF $9,000 $975.00 $1.15 SF $8,775 2BR/1BA - 620 Pedretti 5 Units 850 SF 4,250 SF $700.00 $0.82 SF $3,500 $700.00 $0.82 SF $3,500 $975.00 $1.15 SF $4,875 2BR/2BA - 3050 Mickey Ave 1 Units 850 SF 850 SF $700.00 $0.82 SF $700 $700.00 $0.82 SF $700 $995.00 $1.17 SF $995 Totals / Wtd. Averages 43 Units 850 SF 36,550 SF $812.44 $0.96 SF $34,935 $854.07 $1.00 SF $36,725 $975.47 $1.15 SF $41,945 Three Bedroom 3BR/1BA - 603-613 Forest Ave 9 Units 1,100 SF 9,900 SF $1,159.78 $1.05 SF $10,438 $1,248.00 $1.13 SF $11,232 $1,250.00 $1.14 SF $11,250 Totals / Wtd. Averages 9 Units 1,100 SF 9,900 SF $1,159.78 $1.05 SF $10,438 $1,248.00 $1.13 SF $11,232 $1,250.00 $1.14 SF $11,250 Four Bedroom 4BR/1BA - 603-613 Forest Ave 3 Units 1,300 SF 3,900 SF $1,366.67 $1.05 SF $4,100 $1,450.00 $1.12 SF $4,350 $1,450.00 $1.12 SF $4,350 Totals / Wtd. Averages 3 Units 1,300 SF 3,900 SF $1,366.67 $1.05 SF $4,100 $1,450.00 $1.12 SF $4,350 $1,450.00 $1.12 SF $4,350 Office Office - 3316 Werk 1 Units 1,200 SF 1,200 SF $1,500.00 $1.25 SF $1,500 $1,500.00 $1.25 SF $1,500 $1,550.00 $1.29 SF $1,550 Totals / Wtd. Averages 1 Units 1,200 SF 1,200 SF $1,500.00 $1.25 SF $1,500 $1,500.00 $1.25 SF $1,500 $1,550.00 $1.29 SF $1,550
-
REHAB YEAR 1 GROSS POTENTIAL RENT % of GPR Per Unit % of GPR Per Unit All Units at Market Rent $2,160,024 RR 9,730 $2,352,540 10,597 Gain (Loss) to Lease ($152,052) 7.04% (685) ($47,051) 2.00% (212) GROSS SCHEDULED RENT $2,007,972 RR 9,045 $2,305,489 10,385 Other Income Laundry Fee $17,961 T12 0.89% 81 $18,499 0.80% 83 Security Deposit Forfeit $8,407 T12 0.42% 38 $8,659 0.38% 39 Maintenance Income $946 T12 0.05% 4 $974 0.04% 4 Prepayment Forfeit $724 T12 0.04% 3 $746 0.03% 3 Pet Fee $400 T12 0.02% 2 $412 0.02% 2 Total Other Income $28,438 1.42% 128 $29,291 1.27% 132 GROSS POTENTIAL INCOME $2,036,410 9,173 $2,334,780 10,517 Physical Vacancy ($156,642) T12 Economic 7.80% (706) ($115,274) 5.00% (519) Bad Debt $0 0.00% 0 ($23,055) 1.00% (104) EFFECTIVE GROSS INCOME $1,879,768 85.16% 8,467 $2,196,451 92.00% 9,894 NON-CONTROLLABLE Real Estate Taxes % of EGI Per Unit % of EGI 2021 Taxes Paid $117,729 Auditor 6.26% 530 $117,729 5.36% 530 Total Real Estate Taxes $117,729 6.26% 530 $117,729 5.36% 530 Insurance $47,469 T12 2.53% 214 $66,600 3.03% 300 Utilities Gas & Electric $113,334 T12 6.03% 511 $115,601 5.26% 521 Gas & Electric Vacant $2,553 T12 0.14% 12 $2,604 0.12% 12 Water & Sewage $173,370 T12 9.22% 781 $176,837 8.05% 797 Trash Removal $41,757 T12 2.22% 188 $42,592 1.94% 192 Total Utilities $331,014 17.61% 1,491 $337,634 15.37% 1,521 Total Non-Controllable $496,212 26.40% 2,235 $521,963 23.76% 2,351 CONTROLLABLE Contract Services Snow Removal $10,009 T12 0.53% 45 $7,770 0.35% 35 Landscaping/Grounds $17,984 T12 0.96% 81 $16,650 0.76% 75 Pest Control $20,944 T12 1.11% 94 $7,770 0.35% 35 Total Contract Services $48,937 2.60% 220 $32,190 1.47% 145 Repairs & Maintenance $261,018 T12 13.89% 1,176 $133,200 6.06% 600 Marketing & Promotion $9,151 T12 0.49% 41 $11,100 0.51% 50 Payroll $5,749 T12 0.31% 26 $199,800 9.10% 900 Payroll Taxes & Benefits $0 0.00% 0 $22,200 1.01% 100 General & Administrative $11,454 T12 0.61% 52 $22,200 1.01% 100 Management Fee $132,832 T12 7.07% 598 $109,823 5.00% 495 Replacement & Reserves $56,610 Note 4 3.01% 255 $57,742 2.63% 260 Total Controllable $525,751 27.97% 2,368 $588,255 26.78% 2,650 TOTAL EXPENSES $1,021,963 54.37% 4,603 $1,110,218 50.55% 5,001 NET OPERATING INCOME $857,805 45.63% 3,864 $1,086,233 49.45% 4,893 EXPENSE INCOME INCOME &
THE 222
FINANCIALS
EXPENSES
UNDERWRITING NOTES
# NOTE
1 Rent Roll Date: April 2023
2 T12 Date Range: February 2022 – January 2023
3 Taxes: information from Hamilton County Auditor
4 Replacement & Reserves: added based on market norm of $255 per unit per year
5 Gross Potential Rent: assumes a normal growth of 3% starting in year 2
6 Loss to Lease: assumes a normal growth of 2% starting in year 2
7 Physical Vacancy: set at 5% which is the norm for this market
8 Bad Debt: set at 2% which is the norm for this property type and market
9 Werk Rd had no insurance in T12
YEAR 2 YEAR 3 % of GPR Per Unit % of GPR Per Unit $2,423,116 10,915 $2,495,810 11,242 ($48,462) 2.00% (218) ($49,916) 2.00% (225) $2,374,654 10,697 $2,445,893 11,018 $19,054 0.80% 86 $19,626 0.80% 88 $8,919 0.38% 40 $9,186 0.38% 41 $1,004 0.04% 5 $1,034 0.04% 5 $768 0.03% 3 $792 0.03% 4 $424 0.02% 2 $437 0.02% 2 $30,170 1.27% 136 $31,075 1.27% 140 $2,404,823 10,833 $2,476,968 11,158 ($118,733) 5.00% (535) ($122,295) 5.00% (551) ($23,747) 1.00% (107) ($24,459) 1.00% (110) $2,262,344 92.00% 10,191 $2,330,214 92.00% 10,496 % of EGI Per Unit % of EGI Per Unit $117,729 5.20% 530 $117,729 5.20% 530 $117,729 5.20% 530 $117,729 5.20% 530 $67,932 3.00% 306 $69,291 3.06% 312 $117,913 5.21% 531 $120,271 5.32% 542 $2,656 0.12% 12 $2,709 0.12% 12 $180,374 7.97% 812 $183,982 8.13% 829 $43,444 1.92% 196 $44,313 1.96% 200 $344,387 15.22% 1,551 $351,275 15.53% 1,582 $530,048 23.43% 2,388 $538,294 23.79% 2,425 $7,925 0.35% 36 $8,084 0.36% 36 $16,983 0.75% 77 $17,323 0.77% 78 $7,925 0.35% 36 $8,084 0.36% 36 $32,834 1.45% 148 $33,490 1.48% 151 $135,864 6.01% 612 $138,581 6.13% 624 $11,322 0.50% 51 $11,548 0.51% 52 $203,796 9.01% 918 $207,872 9.19% 936 $22,644 1.00% 102 $23,097 1.02% 104 $22,644 1.00% 102 $23,097 1.02% 104 $113,117 5.00% 510 $116,511 5.00% 510 $58,897 2.60% 265 $60,075 2.66% 271 $601,118 26.57% 2,708 $614,272 27.00% 2,752 $1,131,166 50.00% 5,095 $1,152,566 50.95% 5,192 $1,131,178 50.00% 5,095 $1,177,649 52.05% 5,305
CURRENT YR 1 YR 2 YR 3 YR 4 YR 5 YR 6 YR 7 YR 8 YR 9 YR 10 YE JAN-2024 YE DEC-2024 YE DEC-2025 YE DEC-2026 YE DEC-2027 YE DEC-2028 YE DEC-2029 YE DEC-2030 YE DEC-2031 YE DEC-2032 GROSS POTENTIAL RENT All Units at Market Rent $2,160,024 $2,352,540 $2,423,116 $2,495,810 $2,570,684 $2,647,804 $2,727,239 $2,809,056 $2,893,327 $2,980,127 $3,069,531 Gain (Loss) to Lease ($152,052) ($47,051) ($48,462) ($49,916) ($51,414) ($52,956) ($54,545) ($56,181) ($57,867) ($59,603) ($61,391) GROSS SCHEDULED RENT $2,007,972 $2,305,489 $2,374,654 $2,445,893 $2,519,270 $2,594,848 $2,672,694 $2,752,875 $2,835,461 $2,920,525 $3,008,140 Total Other Income $28,438 $29,291 $30,170 $31,075 $31,696 $32,330 $32,977 $33,636 $34,309 $34,995 $35,695 GROSS POTENTIAL INCOME $2,036,410 $2,334,780 $2,404,823 $2,476,968 $2,550,966 $2,627,178 $2,705,670 $2,786,511 $2,869,770 $2,955,520 $3,043,835 Physical Vacancy ($156,642) ($115,274) ($118,733) ($122,295) ($125,964) ($129,742) ($133,635) ($137,644) ($141,773) ($146,026) ($150,407) Bad Debt $0 ($23,055) ($23,747) ($24,459) ($25,193) ($25,948) ($26,727) ($27,529) ($28,355) ($29,205) ($30,081) EFFECTIVE GROSS INCOME $1,879,768 $2,196,451 $2,262,344 $2,330,214 $2,399,810 $2,471,488 $2,545,309 $2,621,338 $2,699,642 $2,780,288 $2,863,347 Real Estate Taxes $117,729 $117,729 $117,729 $117,729 $120,083 $122,485 $124,935 $127,433 $129,982 $132,582 $135,233 Insurance $47,469 $66,600 $67,932 $69,291 $70,676 $72,090 $73,532 $75,002 $76,502 $78,033 $79,593 Utilities $331,014 $337,634 $344,387 $351,275 $358,300 $365,466 $372,776 $380,231 $387,836 $395,592 $403,504 Contract Services $48,937 $32,190 $32,834 $33,490 $34,160 $34,843 $35,540 $36,251 $36,976 $37,716 $38,470 Repairs & Maintenance $261,018 $133,200 $135,864 $138,581 $141,353 $144,180 $147,064 $150,005 $153,005 $156,065 $159,186 Marketing & Promotion $9,151 $11,100 $11,322 $11,548 $11,779 $12,015 $12,255 $12,500 $12,750 $13,005 $13,266 Payroll $5,749 $199,800 $203,796 $207,872 $212,029 $216,270 $220,595 $225,007 $229,507 $234,098 $238,779 Payroll Taxes & Benefits $0 $22,200 $22,644 $23,097 $23,559 $24,030 $24,511 $25,001 $25,501 $26,011 $26,531 General & Administrative $11,454 $22,200 $22,644 $23,097 $23,559 $24,030 $24,511 $25,001 $25,501 $26,011 $26,531 Management Fee $132,832 $109,823 $113,117 $116,511 $119,991 $123,574 $127,265 $131,067 $134,982 $139,014 $143,167 Replacement & Reserves $56,610 $57,742 $58,897 $60,075 $61,276 $62,502 $63,752 $65,027 $66,328 $67,654 $69,007 TOTAL EXPENSES $1,021,963 $1,110,218 $1,131,166 $1,152,566 $1,176,767 $1,201,486 $1,226,735 $1,252,526 $1,278,871 $1,305,781 $1,333,269 NET OPERATING INCOME $857,805 $1,086,233 $1,131,178 $1,177,649 $1,223,044 $1,270,001 $1,318,574 $1,368,812 $1,420,772 $1,474,508 $1,530,078 INCOME EXPENSE
Tax Breakdown Property Address Parcel ID Year Built Acres Market Value Assessed Value Tax Rate Taxes Payable Land Use Code 3050 Mickey Ave 204-0020-0008-00 1963 10.54 $439,900 $153,970 90.565061 $13,960.30 403 - Apartment, 40+ Units 603-613 Forest Ave 107-0009-0001-00 1929 0.41 $271,270 $94,940 90.565061 $8,684.71 402 - Apartment, 20-39 Units 613 Forest Ave 107-0009-0002-00 1929 0.18 $241,030 $84,360 90.565061 $7,657.94 401 - Apartment, 4-19 Units Foley Rd 180-0A81-0227-00 0.14 $20,140 $7,050 90.565061 $653.60 400 - Commercial Vacant Land 4480 Foley Rd 180-0A81-0228-00 0.14 $20,140 $7,050 90.565061 $653.82 400 - Commercial Vacant Land 4480 Foley Rd 180-0A81-0229-00 1964 0.82 $364,400 $127,540 90.565061 $11,720.53 403 - Apartment, 40+ Units 620 Pedretti Ave 180-0A81-0147-00 1964 0.91 $437,020 $152,950 90.565061 $13,977.27 403 - Apartment, 40+ Units 636 Pedretti Ave 180-0A81-0216-00 0.06 $1,930 $680 90.565061 $61.58 400 - Commercial Vacant Land 3113 Werk Rd 208-0060-0427-00 1966 0.56 $445,400 $155,890 90.565061 $14,220.56 402 - Apartment, 20-39 Units 901 Summit Ave 175-0016-0013-00 1980 0.67 $407,380 $142,580 90.565061 $13,067.63 402 - Apartment, 20-39 Units 3316 Werk Rd 212-0062-0016-00 1985 0.44 $387,430 $135,600 90.565061 $12,304.87 499 - Other Comm Structure 5015 Sidney Rd 183-0002-0028-00 1963 0.33 $215,080 $75,280 90.565061 $6,849.52 401 - Apartment, 4-19 Units 808 Harris Ave 179-0076-0041-00 1973 0.30 $150,960 $52,840 90.565061 $4,812.39 402 - Apartment, 20-39 Units 3841 Nolan Ave 551-0001-0257-00 1963 0.31 $267,010 $93,460 95.094051 $9,104.10 401 - Apartment, 4-19 Units Total 0.40 $301,780 $105,620 $9,836.81
THE 222FINANCIALS CASH FLOW
*Calculated as a percentage of Gross Potential Rent | **Calculated as a percentage of Effective Gross Income

CASH FLOW PROJECTION GROWTH RATE ASSUMPTIONS YR 1 YR 2 YR 3 YR 4 YR 5 YR 6 YR 7 YR 8 YR 9 Income Gross Potential Rent 8.91% 3.00% 3.00% 3.00% 3.00% 3.00% 3.00% 3.00% 3.00% (Loss) / Gain to Lease* 2.00% 2.00% 2.00% 2.00% 2.00% 2.00% 2.00% 2.00% 2.00% Other Income 3.00% 3.00% 3.00% 3.00% 3.00% 3.00% 3.00% 3.00% 3.00% Expenses Expenses 2.00% 2.00% 2.00% 2.00% 2.00% 2.00% 2.00% 2.00% Management Fee** 5.00% 5.00% 5.00% 5.00% 5.00% 5.00% 5.00% 5.00% 5.00% CASH FLOW PROJECTION GROWTH RATE ASSUMPTIONS YR 1 YR 2 YR 3 YR 4 YR 5 YR 6 YR 7 YR 8 YR 9 Physical Vacancy 5.00% 5.00% 5.00% 5.00% 5.00% 5.00% 5.00% 5.00% 5.00% Non-Revenue Units 0.00% 0.00% 0.00% 0.00% 0.00% 0.00% 0.00% 0.00% 0.00% Bad Debt 1.00% 1.00% 1.00% 1.00% 1.00% 1.00% 1.00% 1.00% 1.00% Concessions Allowance 0.00% 0.00% 0.00% 0.00% 0.00% 0.00% 0.00% 0.00% 0.00% Total Economic Loss 6.00% 6.00% 6.00% 6.00% 6.00% 6.00% 6.00% 6.00% 6.00%
THE WEST SIDE
WESTSIDE ADDRESS
3050 MICKEY AVE
620 PEDRETTI & 4480 FOLEY ROAD
3113-3115 WERK ROAD
2821-2822 PRICE AVE
808 HARRIS AVE
5015 SIDNEY ROAD
3841 NOLAN AVE
3316 WERK ROAD
02
WEST SIDE
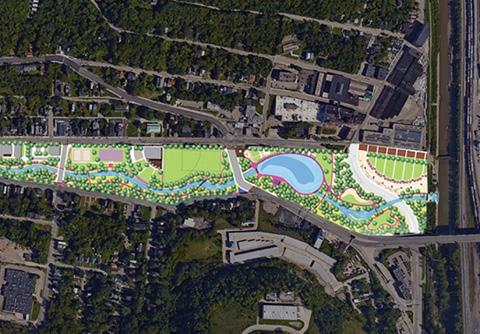
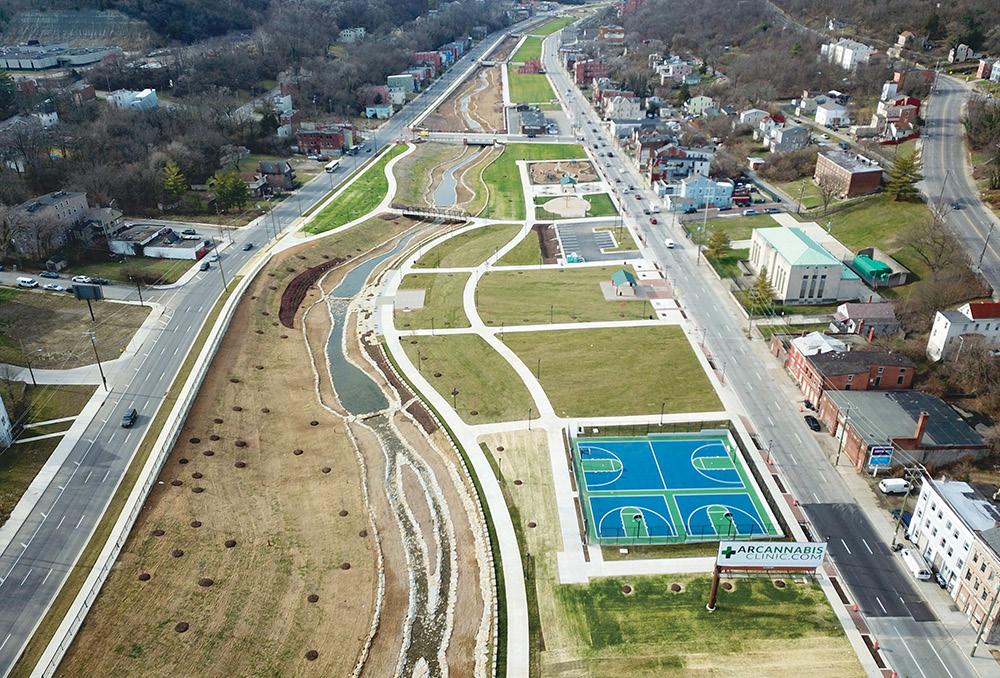
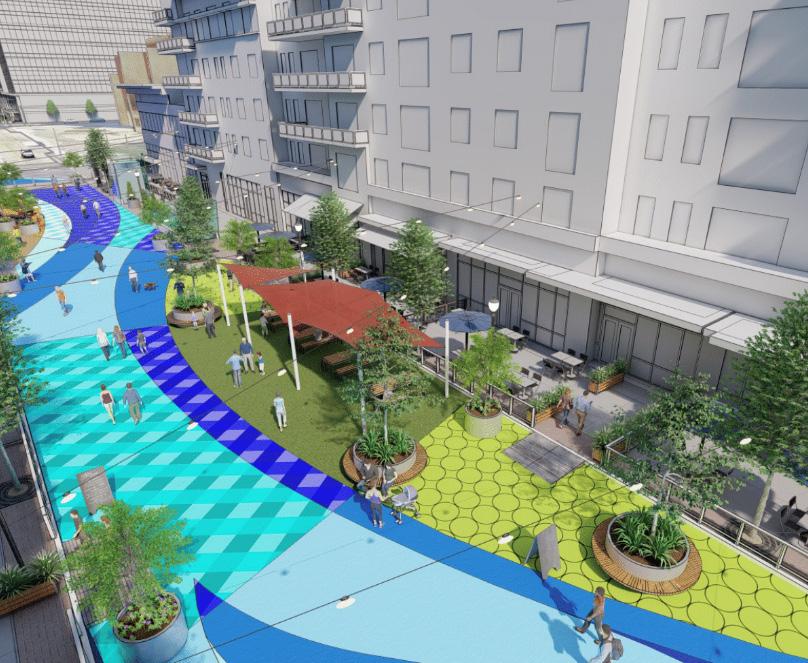
LICK RUN PROJECT
The Lick Run Water Way is a $110 million project spanning nearly 2 miles between Queen City Ave and Westwood Ave. The project will more efficiently manage storm water runoff and provides the community with recreational parks and green space. The project not only better addresses stormwater run off, but also beautifies the nearly 2 mile strip lined with retail and residential properties attracting more visitors to the area. The development is the single largest public investment into north Fairmont, and has smaller like kind projects in Price Hill and Westwood. All of the projects were put in place to better manage stormwater runoff and replace dated systems with astatically pleasing and efficient solutions.
DEVELOPMENTS
DELHI MIXED USE PROJECT
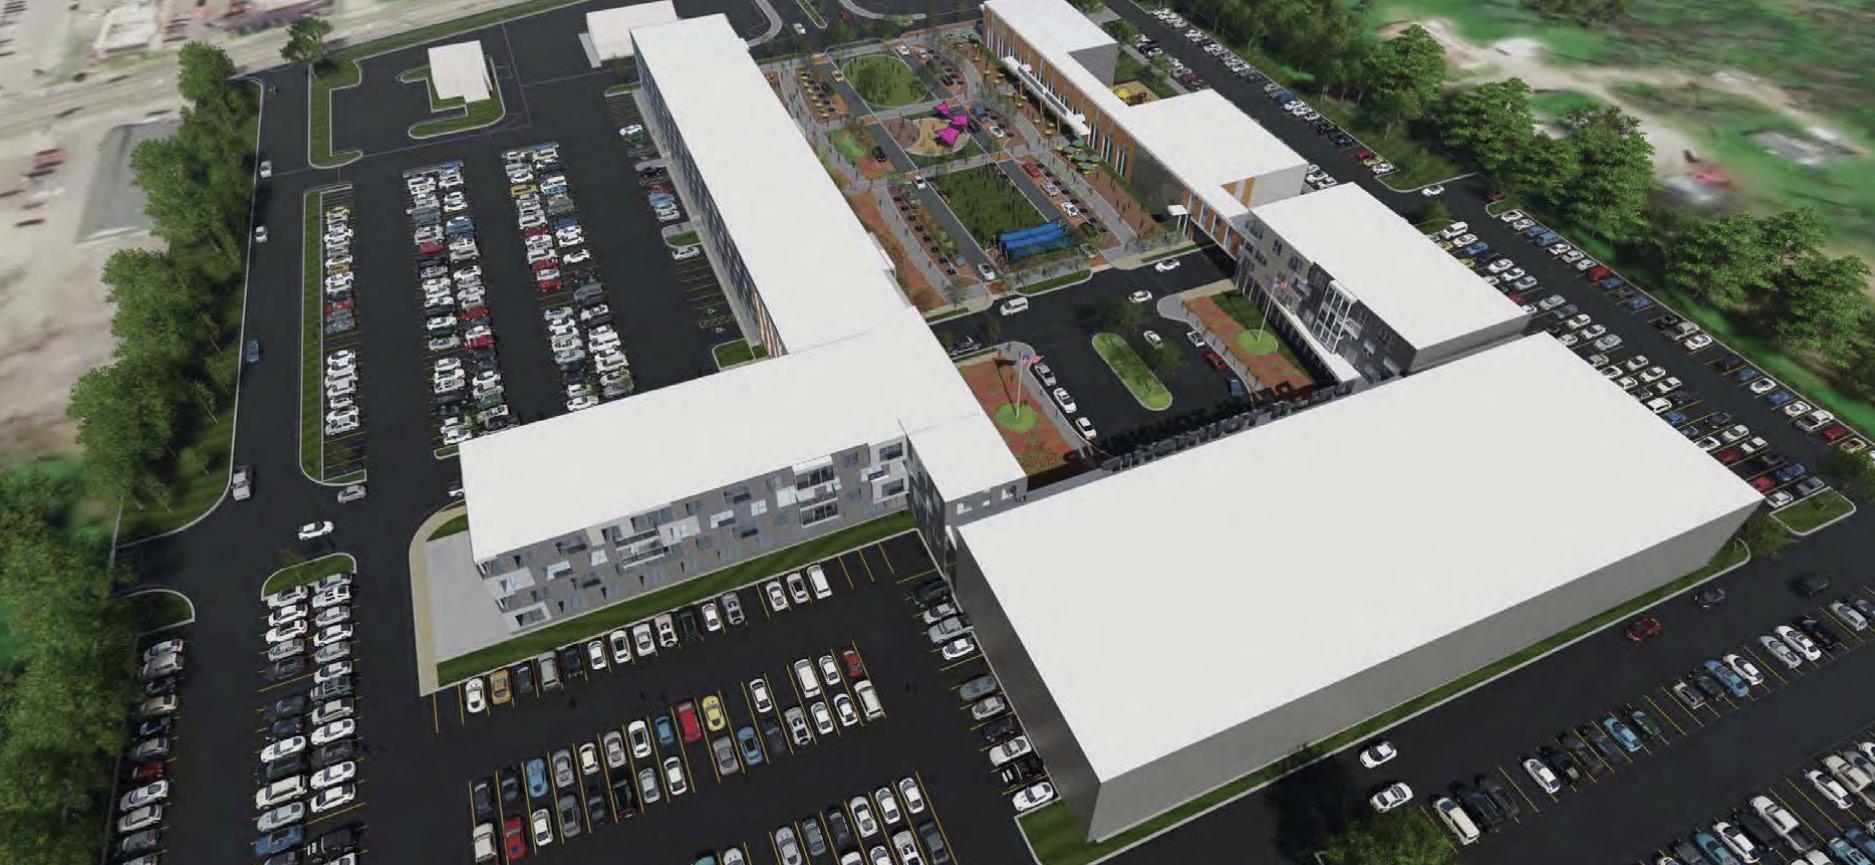
The 14 acre site commonly called the Remke site located on Delhi Pike was purchased by the Delhi Township in 2019 and has been identified as the location for the new Delhi Mixed Use Project. The multi phase development will revitalize the Delhi Pike Commercial Corridor creating a more walkable and economically diverse hub for the community. Some of the notable project aspects are a community center, co-op business spaces, market rate and affordable rental units, as well as ground floor retail with green space and safer traffic flow. The final bids and details from developers are being reviewed through the summer with the goal to have a finalized plan by the fall of 2021.
WEST SIDE
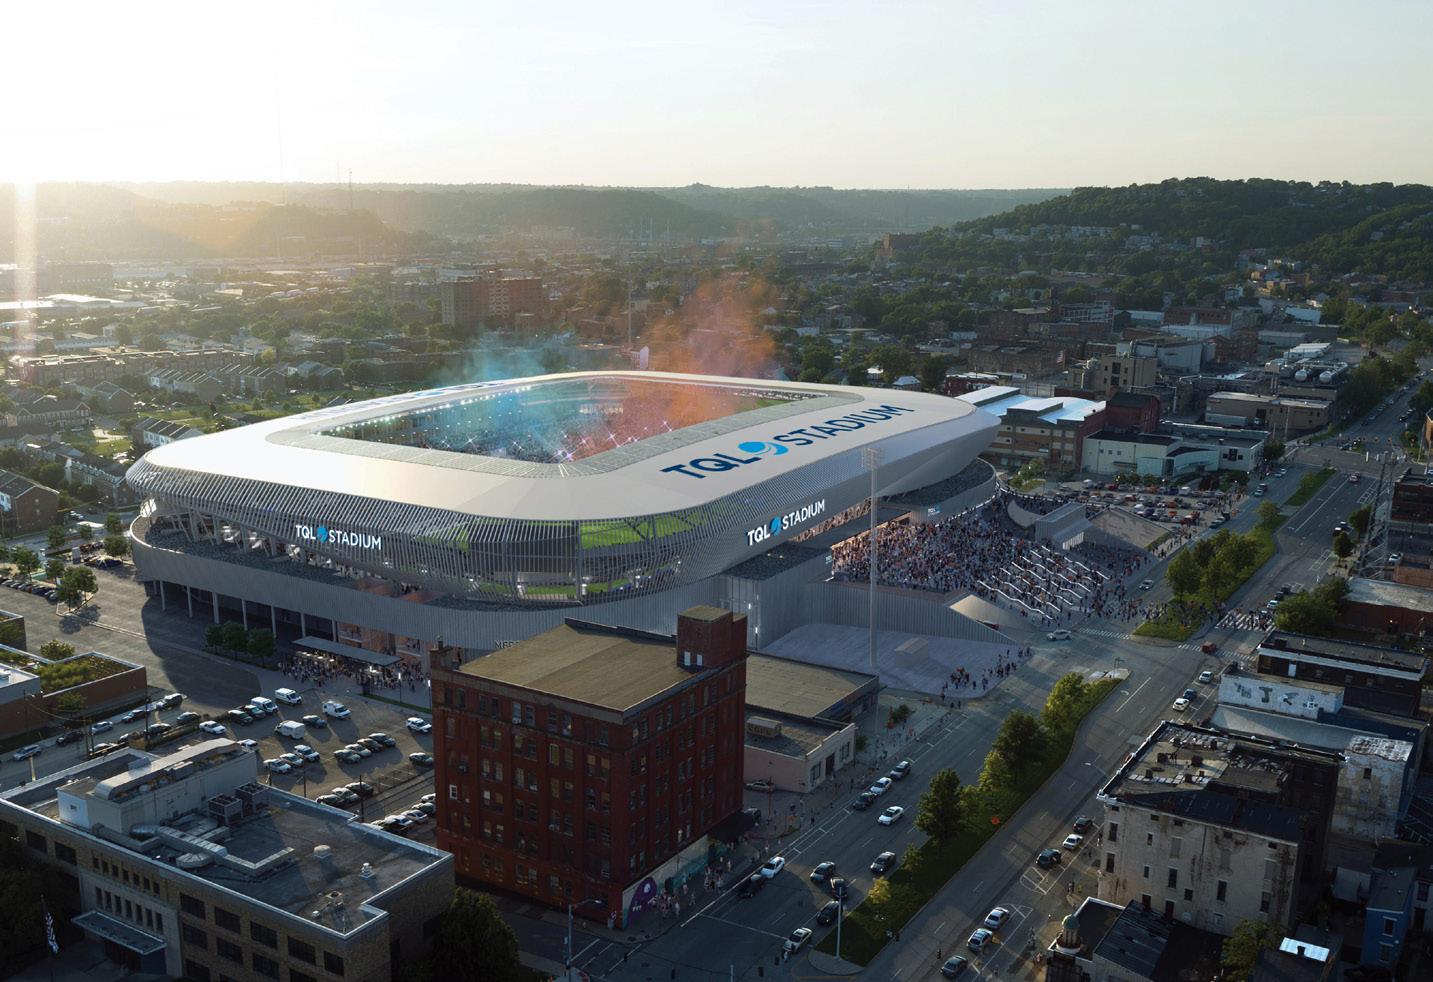
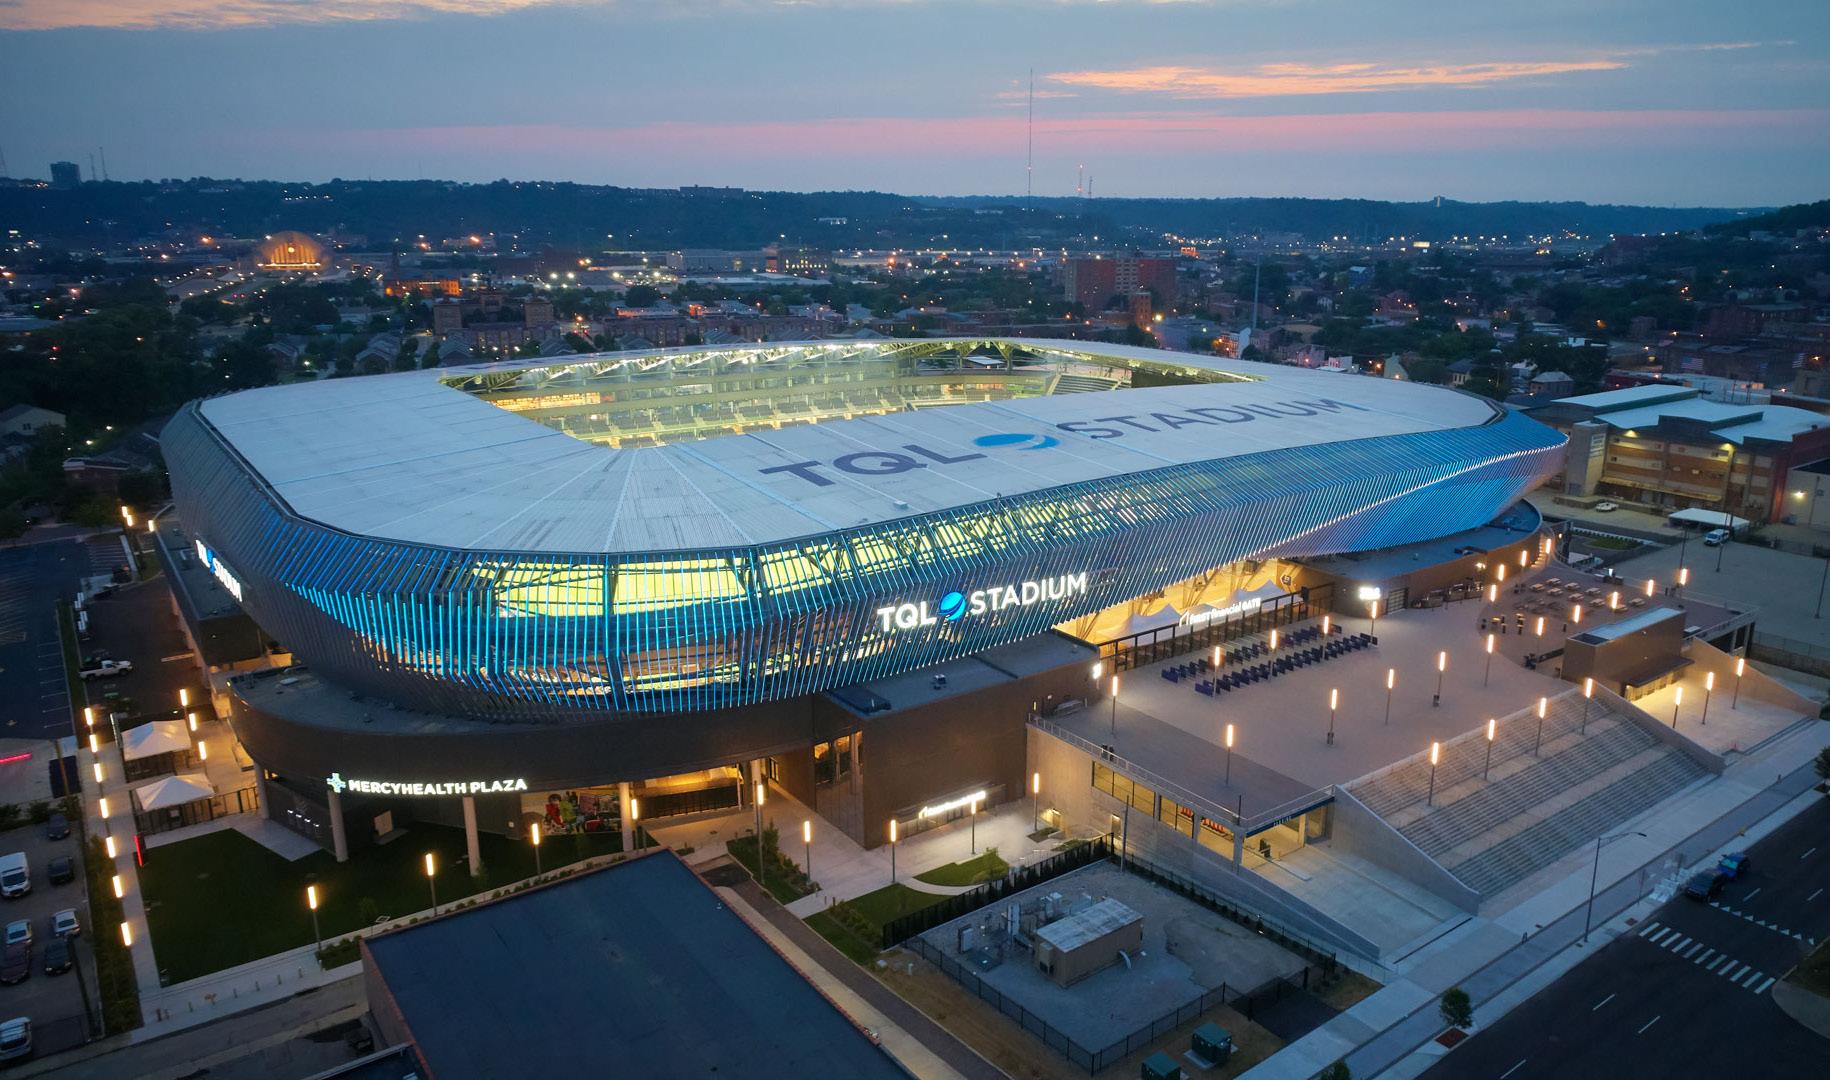
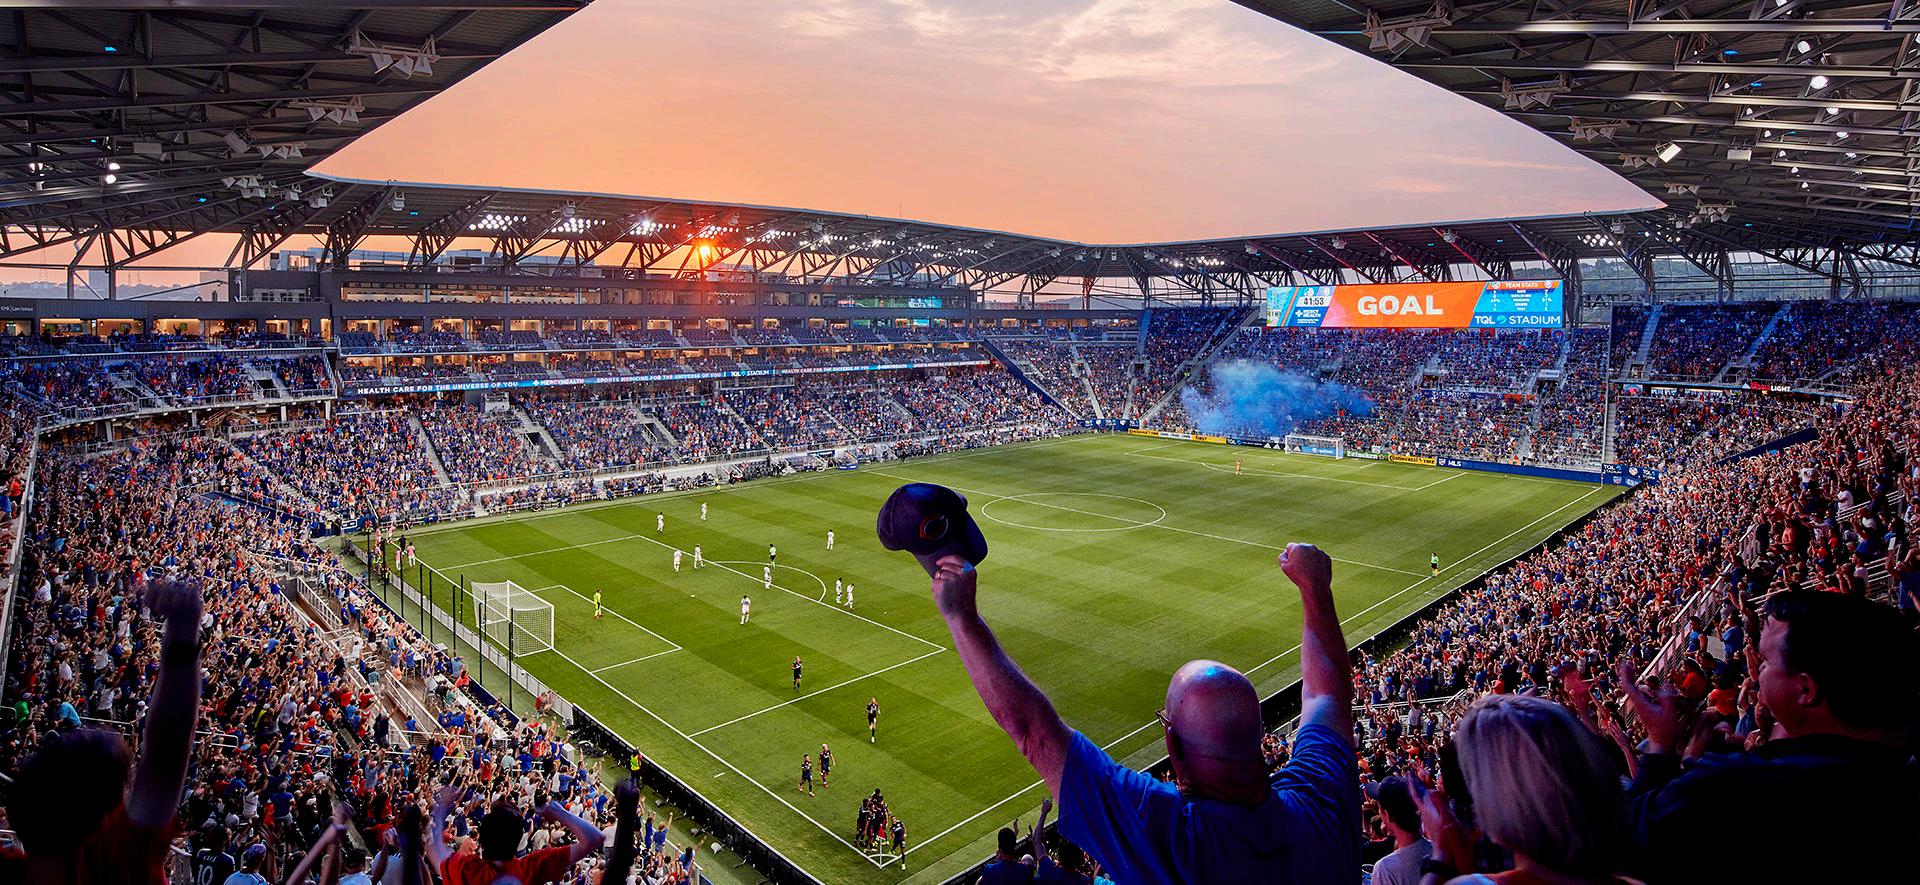
TQL MAJOR LEAGUE SOCCER STADIUM
$250 Million Project
26,000 Seats
FC Cincinnati and their fans finally have a stadium to match their caliber of play and enthusiasm. The stadium was completed in May 2021, can hold 26,000 spectators and cost a total of $250 million. Located in the West End neighborhood, the stadium draws tens of thousands of fans weekly from April to November in addition to the other events hosted there out side of the MLS season. Of the three location options being decided between, the West End was selected due to the numerous economic benefits that would stem from the stadium’s present.

DEVELOPMENTS
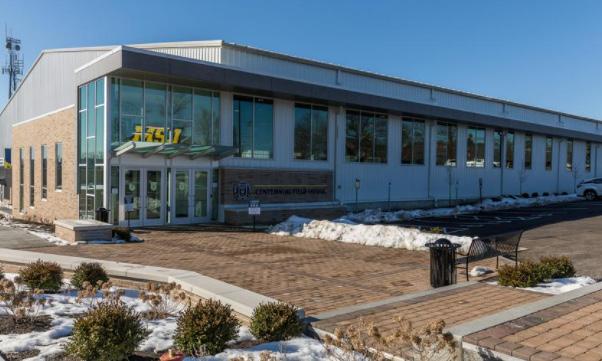
Warsaw ave creative campus
13 residential units, 7 commercial spaces coming
The Warsaw Avenue Creative Campus, helmed by Price Hill Will and The Model Group, had its official groundbreaking ceremony Wednesday. Supporters of the project say the development will be a major boon for housing and the neighborhood’s economy.
“This is just an amazing milestone for this big project so to be able to welcome all of our friends and neighbors to come celebrate with us today is really exciting,” said Rachel Hastings, the executive director of Price Hill Will.
The Warsaw Avenue Creative Campus is five years in the making. The development will consist of eight revitalized historic buildings between Considine and Grand Avenue. Thirteen residential units and seven commercial spaces will be created within the renovated buildings in a project priced at $10 million.
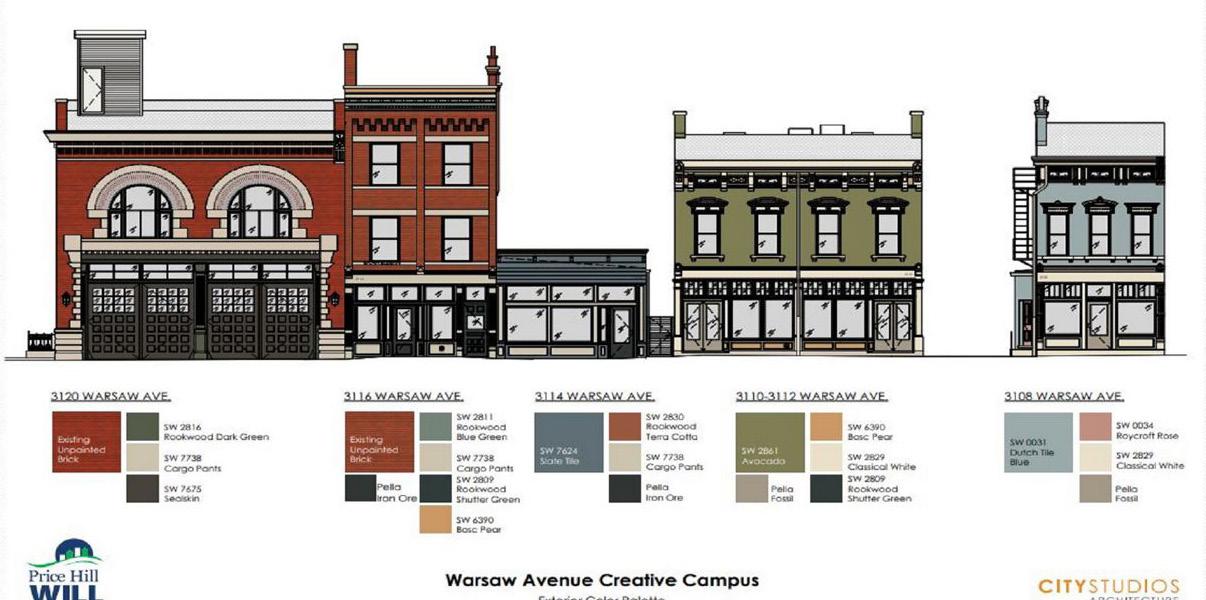
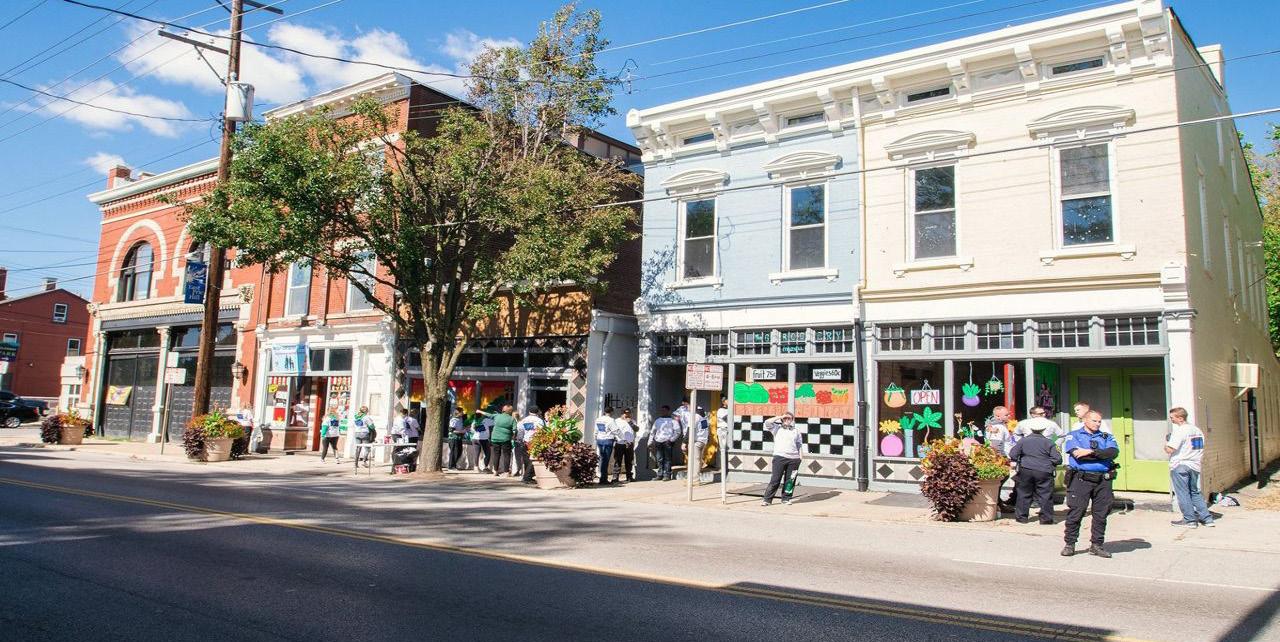 $10 Million Project
rent sort ONE BEDROOM
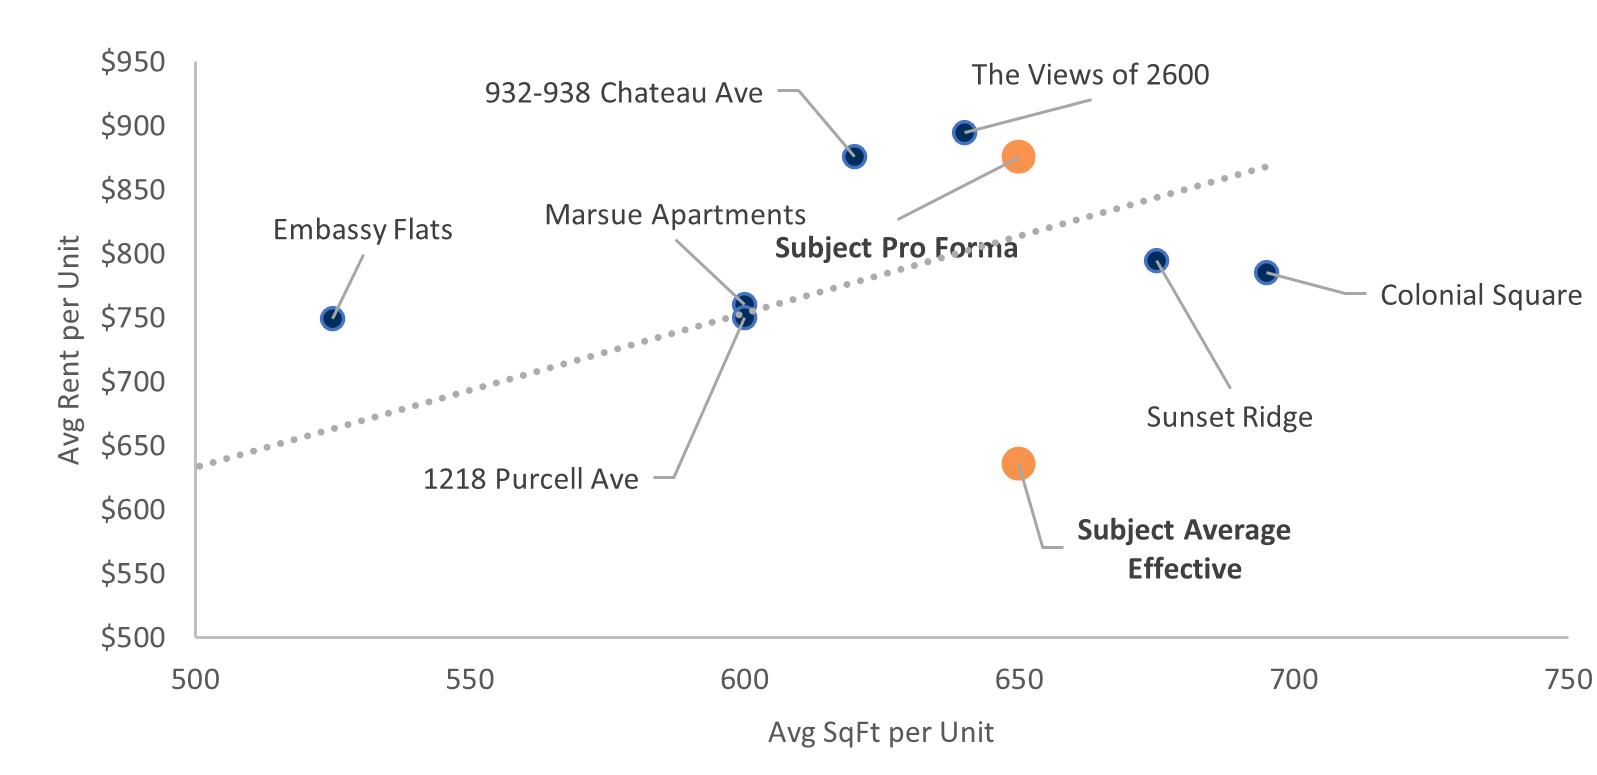
SUBJECT PROPERTIES CORRELATING TO COMPS
Bedroom Property Year Built # Units Avg SF Avg Rent Avg Rent/SF The Views of 2600 1969/2018 26 640 $895 $1.40 932-938 Chateau Ave 1972 48 620 $876 $1.41 Subject Pro Forma 1960s & 70s 222 650 $875 $1.35 Sunset Ridge 1965 58 675 $795 $1.18 Colonial Square 1956 63 695 $785 $1.13 Marsue Apartments 1940 30 600 $760 $1.27 1218 Purcell Ave 1959 4 600 $750 $1.25 Embassy Flats 1960 21 525 $749 $1.43 Subject Average Effective 1960s & 70s 222 650 $636 $0.98
One
ADDRESS YEAR BUILT UNIT COUNT AVG EFFECTIVE RENT 3050 Mickey Ave. 1963 47 $711 620 Pedretti & 4480 Foley 1964 48 $658 3113-3115 Werk Rd. 1966 22 $608 2821-2822 Price Ave 1980 24 $659 808 Harris Ave 1973 11 $659 5015 Sidney Rd. 1963 11 $594 3841 Nolan Ave. 1963 11 $670 3316 Werk Rd. 1985 12 & 1,500 SF Office $636
rent sort TWO BEDROOM
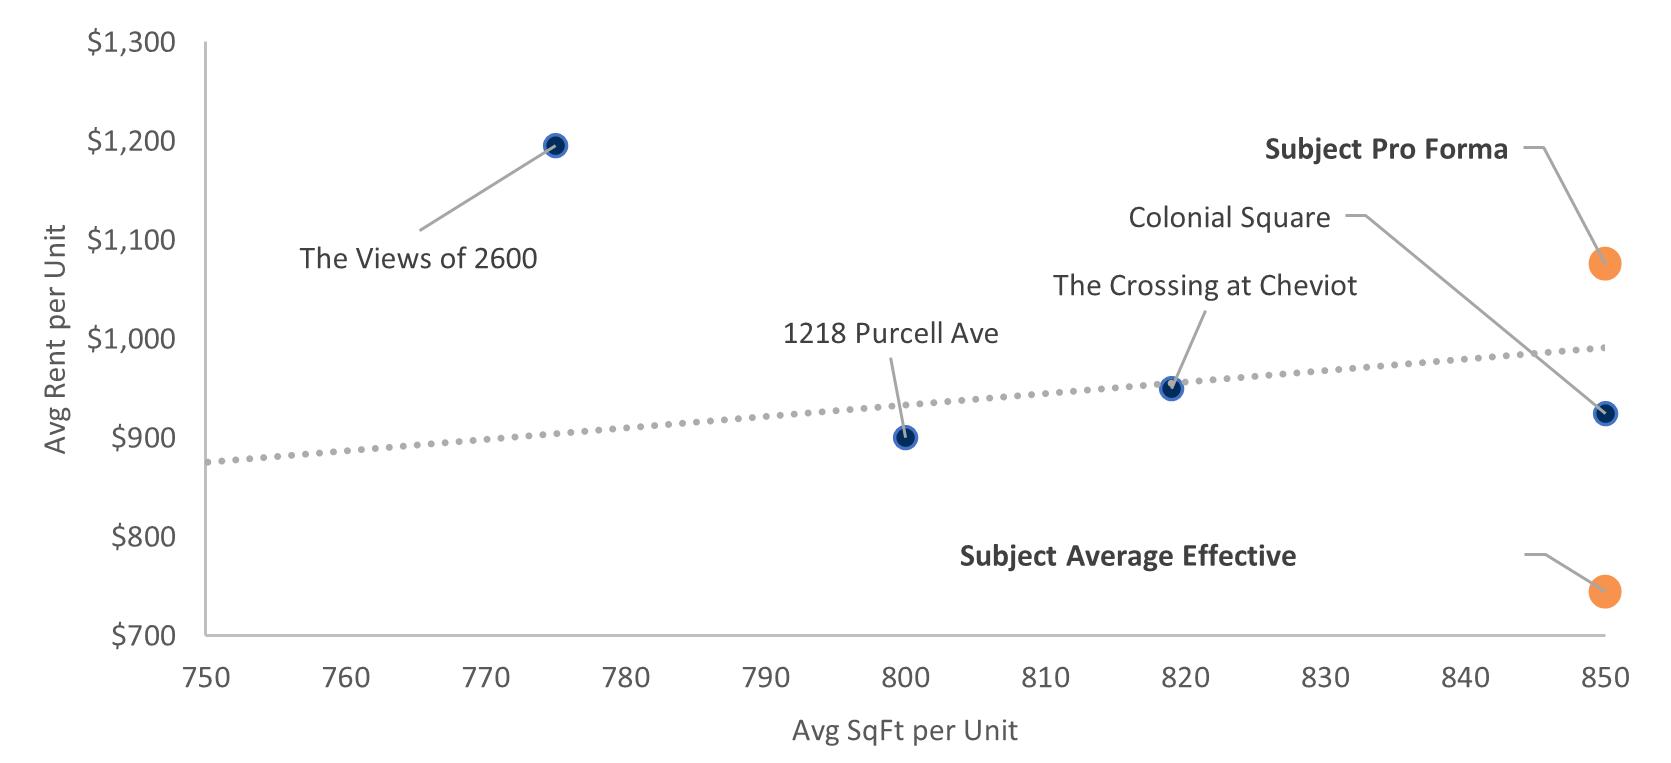
Two Bedroom
SUBJECT PROPERTIES CORRELATING TO COMPS
Property Year Built # Units Avg SF Avg Rent Avg Rent/SF The Views of 2600 1969/2018 26 775 $1,195 $1.54 Subject Pro Forma 1960s & 70s 222 850 $1,075 $1.26 The Crossing at Cheviot 1964 134 819 $950 $1.16 Colonial Square 1956 63 850 $925 $1.09 1218 Purcell Ave 1959 4 800 $900 $1.13 Subject Average Effective 1960s & 70s 222 850 $745 $0.88
ADDRESS YEAR BUILT UNIT COUNT AVG EFFECTIVE RENT 3050 Mickey Ave. 1963 47 $711 620 Pedretti & 4480 Foley 1964 48 $658 3113-3115 Werk Rd. 1966 22 $608 2821-2822 Price Ave 1980 24 $659 808 Harris Ave 1973 11 $659 5015 Sidney Rd. 1963 11 $594 3841 Nolan Ave. 1963 11 $670 3316 Werk Rd. 1985 12 & 1,500 SF Office $636
LOCAL COMPETITORS WEST SIDE
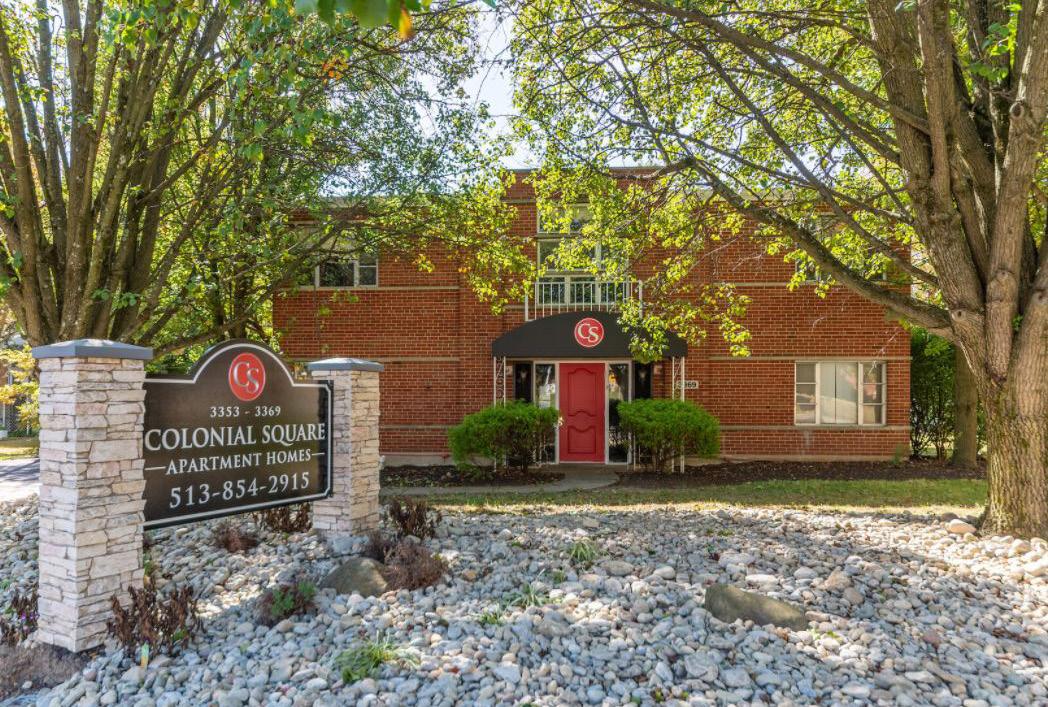
Units 63 Year Built 1956 Occupancy 95.0% One Bedroom Two Bedroom 695SF 850SF Rent: $785 Rent: $925 Rent Per SF: $1.13 Rent Per SF: $1.09 COLONIAL SQUARE 1 SUNSET RIDGE 2 Units 58 Year Built 1965 Occupancy 0.0% One Bedroom Two Bedroom 675SF SF Rent: $795 Rent: $ Rent Per SF: $1.13 Rent Per SF: $
CROSSING AT CHEVIOT
3 Units 134 Year Built 1964 Occupancy
One
SF
1218 PURCELL
4 Units 4 Year Built 1959 Occupancy
One Bedroom
600SF 800SF
100.0%
Bedroom Two Bedroom
819SF Rent: $ Rent: $950 Rent Per SF: $ Rent Per SF: $1.16
AVE
50% (In Lease-Up)
Two Bedroom
Rent: $750 Rent: $900 Rent Per SF: $1.25 Rent Per SF: $13
THE WEST SIDE | property breakdown
WESTSIDE ADDRESS
3050 MICKEY AVE
620 PEDRETTI & 4480 FOLEY ROAD
3113-3115 WERK ROAD
2821-2822 PRICE AVE
808 HARRIS AVE
5015 SIDNEY ROAD
3841 NOLAN AVE
3316 WERK ROAD
03
PROPERTY BREAKDOWN
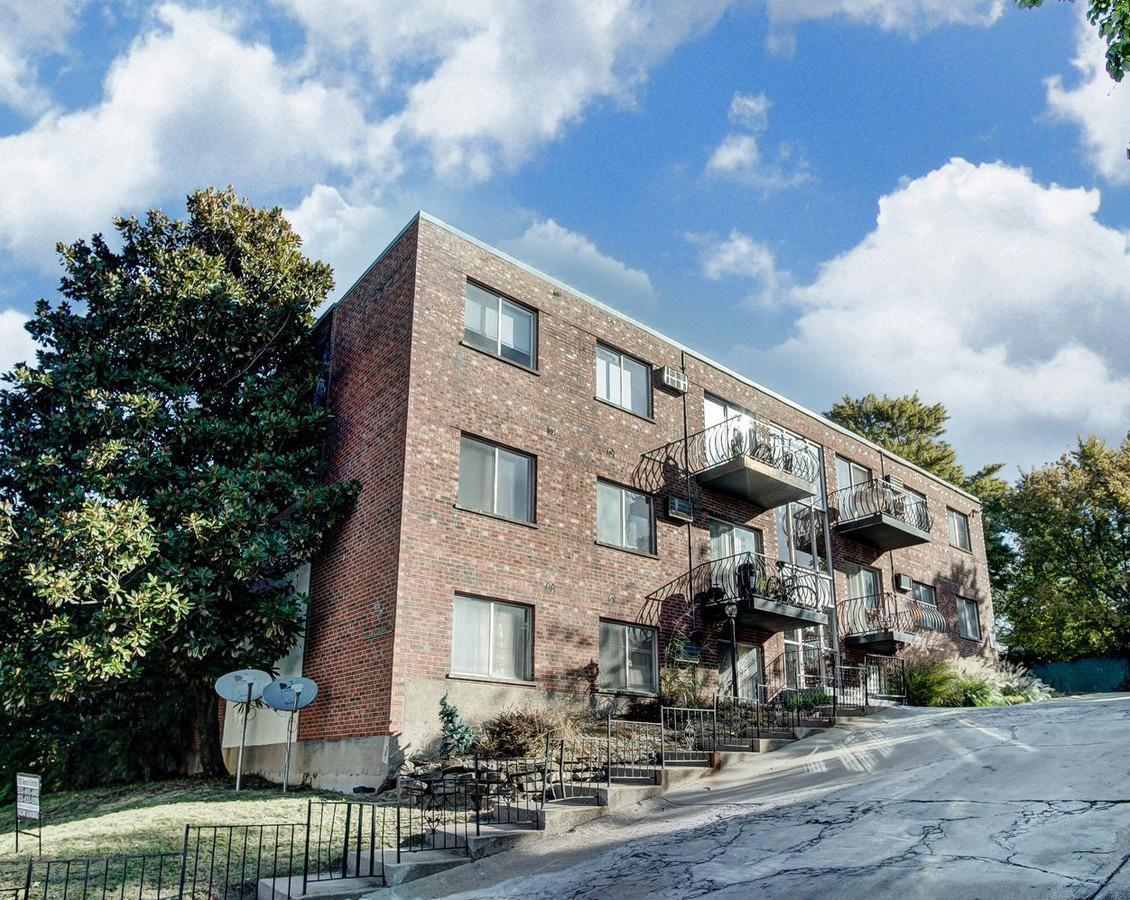
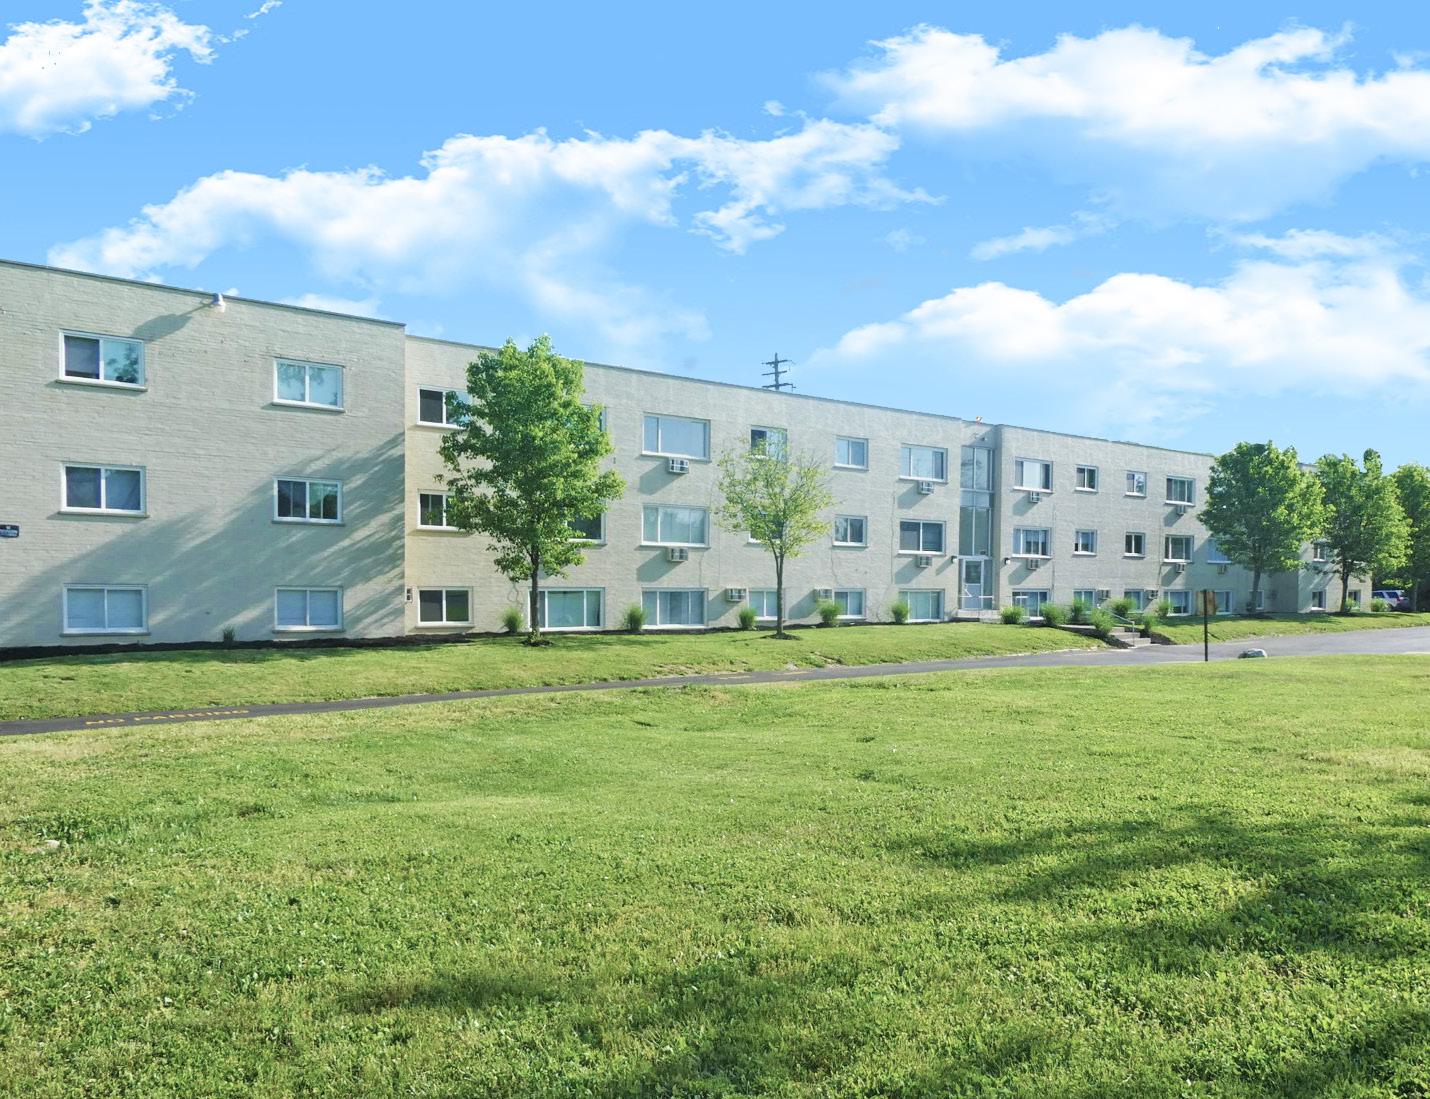
3050 MICKEY AVE
3050 MICKEY AVE YB: 1963 UNITS 47
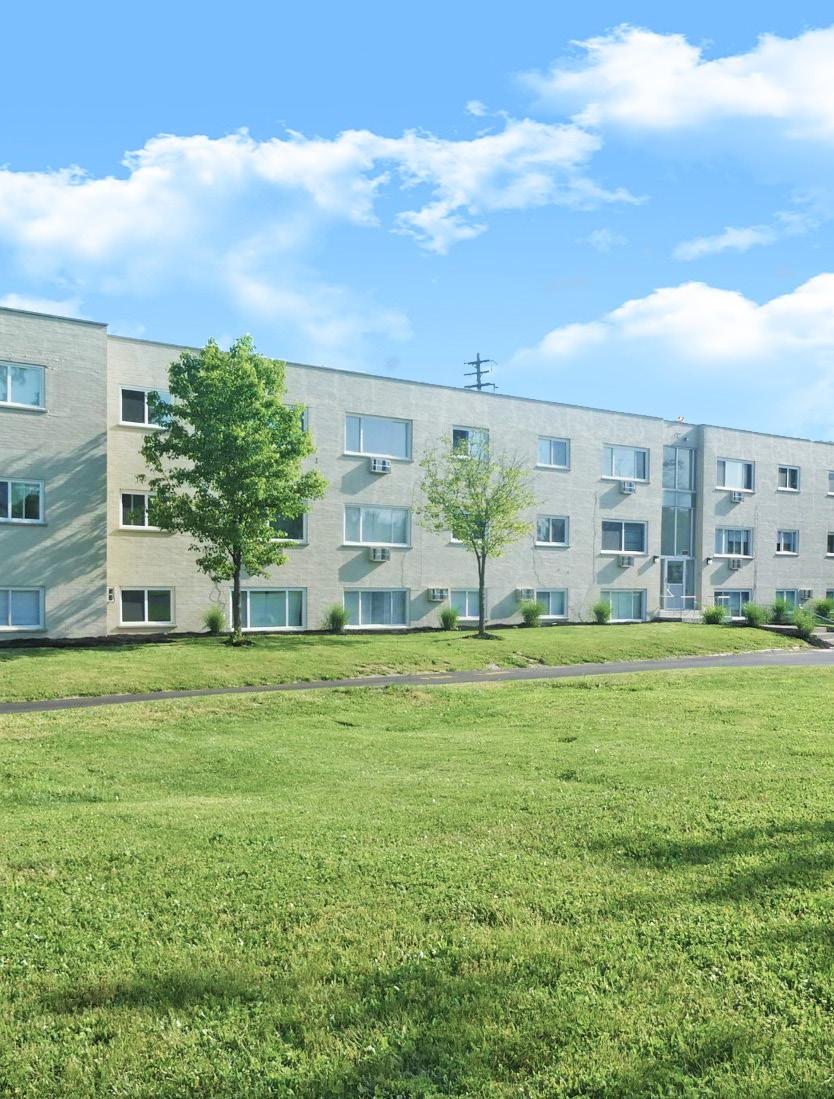
SUBMARKET EAST PRICE HILL AVERAGE EFFECTIVE RENT $733
BOILER BASED HEAT THROUGH WALL A/C
UNDERWRITING NOTES
# NOTE
1 Replacement & Reserves: added based on market norm of $255 per unit per year
2 Repairs & Maint: $7,583 of Capex improvements removed from trailing
UTILITY RESPONSIBILITY:
RESIDENT PAYS: ELECTRIC
OWNER PAYS: WATER, SEWER, TRASH, GAS
CAPEX SINCE 2016:
Painted Exterior Brick, New Vinyl Frame Windows, LVP Floor
Throughout all Units, All New Black or SS front Appliances, All New Kitchen Cabinets, All New Faux Granite Countertops, All New Bathroom Tub Surrounds, All New Toilets , All New Through Wall A/Cs, All New Lighting Fixtures
AVERAGE EFFECTIVE MARKET PROJECTED UNIT TYPE NO. OF UNITS RENTABLE SF TOTAL SF RENT/UNIT RENT/SF TOTAL RENT POTENTIAL RENT/UNIT RENT/SF TOTAL RENT POTENTIAL RENT/UNIT RENT/SF TOTAL RENT POTENTIAL SUMMARY One Bedroom 35 Units 650 SF 22,750 SF $705.39 $1.09 $24,689 $750.00 $1.15 SF $26,250 $825.00 $1.27 SF $28,875 Two Bedroom 12 Units 854 SF 10,250 SF $813.42 $0.95 $9,761 $837.50 $0.98 SF $10,050 $976.67 $1.14 SF $11,720 Totals / Wtd. Averages 47 Units 702 SF 33,000 SF $732.97 $1.04 SF $34,450 $772.34 $1.10 SF $36,300 $863.72 $1.23 SF $40,595
OCCUPANCY
HVAC
90%
CURRENT RENT ROLL: AS OF MARCH 28, 2023 INCOME & EXPENSES: AS OF JANUARY 2023 YEAR 1 GROSS POTENTIAL RENT % of GPR Per Unit % of GPR Per Unit All Units at Market Rent $435,600 RR 9,268 $487,140 10,365 Gain (Loss) to Lease ($16,656) 3.82% (354) ($9,743) 2.00% (207) GROSS SCHEDULED RENT $418,944 RR 8,914 $477,397 10,157 Other Income Security Deposit Forfeit $1,695 T12 0.40% 36 $1,745 0.37% 37 Laundry Fee $1,692 T12 0.40% 36 $1,743 0.37% 37 Pet Fee $400 T12 0.10% 9 $412 0.09% 9 Prepayment Forfeit $49 T12 0.01% 1 $51 0.01% 1 Maintenance Income $30 T12 0.01% 1 $31 0.01% 1 Repair/Maintenance Income $26 T12 0.01% 1 $27 0.01% 1 Total Other Income $3,892 0.93% 83 $4,008 0.84% 85 GROSS POTENTIAL INCOME $422,836 8,997 $481,406 10,243 Physical Vacancy ($45,553) T12 Economic 10.87% (969) ($33,418) 7.00% (711) Bad Debt $0 0.00% 0 ($4,774) 1.00% (102) EFFECTIVE GROSS INCOME $377,282 85.30% 8,027 $443,214 90.00% 9,430 NON-CONTROLLABLE Real Estate Taxes % of EGI Per Unit % of EGI 2021 Taxes Paid $13,960 Auditor 3.70% 297 $13,960 3.15% 297 Total Real Estate Taxes $13,960 3.70% 297 $13,960 3.15% 297 Insurance $12,711 T12 3.37% 270 $18,800 4.24% 400 Utilities Utilities $11,639 T12 3.08% 248 $11,872 2.68% 253 Utilities Vacant $563 T12 0.15% 12 $575 0.13% 12 Water & Sewage $34,723 T12 9.20% 739 $35,418 7.99% 754 Trash Removal $8,833 T12 2.34% 188 $9,010 2.03% 192 Total Utilities $55,759 14.78% 1,186 $56,874 12.83% 1,210 Total Non-Controllable $82,430 21.85% 1,754 $89,634 20.22% 1,907 CONTROLLABLE Contract Services Snow Removal $1,581 T12 0.42% 34 $1,645 0.37% 35 Landscaping/Grounds $2,810 T12 0.74% 60 $3,525 0.80% 75 Pest Control $6,299 T12 1.67% 134 $3,525 0.80% 75 Total Contract Services $10,691 2.83% 227 $8,695 1.96% 185 Repairs & Maintenance $52,897 T12 Note 2 14.02% 1,125 $28,200 6.36% 600 Marketing & Promotion $0 0.00% 0 $2,350 0.53% 50 On-Site Payroll $0 0.00% 0 $42,300 9.54% 900 Payroll Taxes & Benefits $1,654 T12 0.44% 35 $4,700 1.06% 100 General & Administrative $2,905 T12 0.77% 62 $4,700 1.06% 100 Management Fee $14,863 T12 3.94% 316 $22,161 5.00% 472 Replacement & Reserves $11,985 Note 1 3.18% 255 $12,345 2.79% 263 Total Controllable $94,995 25.18% 2,021 $125,450 28.30% 2,669 TOTAL EXPENSES $177,426 47.03% 3,775 $215,084 48.53% 4,576 NET OPERATING INCOME $199,857 52.97% 4,252 $228,130 51.47% 4,854 EXPENSES INCOME
PROPERTY BREAKDOWN
620 PEDRETTI & 4480 FOLEY
UNDERWRITING NOTES
1 Replacement & Reserves: added based on market norm of $255 per unit per
2 Repairs & Maint: $3,805 of Capex improvements removed from trailing
UTILITY RESPONSIBILITY: RESIDENT PAYS: ELECTRIC
OWNER PAYS: WATER, SEWER, TRASH, GAS
CAPEX SINCE 2020:
- 20% of Units Have LVP Flooring Throughout
UNITS 48 SUBMARKET DELHI
EFFECTIVE RENT $656 OCCUPANCY 98%
620 PEDRETTI & 4480 FOLEY YB: 1964
AVERAGE
HVAC BOILER BASED HEAT THROUGH WALL A/C
AVERAGE EFFECTIVE MARKET PROJECTED UNIT TYPE NO. OF UNITS RENTABLE SF TOTAL SF RENT/UNIT RENT/SF TOTAL RENT POTENTIAL RENT/UNIT RENT/SF TOTAL RENT POTENTIAL RENT/UNIT RENT/SF TOTAL RENT POTENTIAL SUMMARY One Bedroom 37 Units 650 SF 24,050 SF $629.03 $0.97 $23,274 $744.46 $1.15 SF $27,545 $825.00 $1.27 SF $30,525 Two Bedroom 11 Units 850 SF 9,350 SF $746.36 $0.88 $8,210 $781.82 $0.92 SF $8,600 $975.00 $1.15 SF $10,725 Totals / Wtd. Averages 48 Units 696 SF 33,400 SF $655.92 $0.94 SF $31,484 $753.02 $1.08 SF $36,145 $859.38 $1.24 SF $41,250
# NOTE
year
CURRENT RENT ROLL: AS OF MARCH 28, 2023 INCOME & EXPENSES: AS OF JANUARY 2023 YEAR 1 GROSS POTENTIAL RENT % of GPR Per Unit % of GPR Per Unit All Units at Market Rent $433,740 RR 9,036 $495,000 10,313 Gain (Loss) to Lease ($52,368) 12.07% (1,091) ($29,700) 6.00% (619) GROSS SCHEDULED RENT $381,372 RR 7,945 $465,300 9,694 Other Income Laundry Fee $8,067 T12 2.12% 168 $8,309 1.79% 173 Security Deposit Forfeit $1,771 T12 0.46% 37 $1,824 0.39% 38 Maintenance Income $250 T12 0.07% 5 $258 0.06% 5 Repair/Maintenance Income $10 T12 0.00% 0 $10 0.00% 0 Total Other Income $10,098 2.65% 210 $10,401 2.24% 217 GROSS POTENTIAL INCOME $391,470 8,156 $475,701 9,910 Physical Vacancy ($8,944) T12 Economic 2.35% (186) ($23,265) 5.00% (485) Bad Debt $0 0.00% 0 ($4,653) 1.00% (97) EFFECTIVE GROSS INCOME $382,526 85.58% 7,969 $447,783 88.00% 9,329 NON-CONTROLLABLE Real Estate Taxes % of EGI Per Unit % of EGI 2021 Taxes Paid $27,067 Auditor 7.08% 564 $27,067 6.04% 564 Total Real Estate Taxes $27,067 7.08% 564 $27,067 6.04% 564 Insurance $3,165 T12 0.83% 66 $19,200 4.29% 400 Utilities Utilities $25,017 T12 6.54% 521 $25,517 5.70% 532 Utilities Vacant $229 T12 0.06% 5 $234 0.05% 5 Water & Sewage $31,815 T12 8.32% 663 $32,451 7.25% 676 Trash Removal $7,340 T12 1.92% 153 $7,487 1.67% 156 Total Utilities $64,401 16.84% 1,342 $65,689 14.67% 1,369 Total Non-Controllable $94,633 24.74% 1,972 $111,956 25.00% 2,332 CONTROLLABLE Contract Services Snow Removal $2,146 T12 0.56% 45 $2,400 0.54% 50 Landscaping/Grounds $2,922 T12 0.76% 61 $3,600 0.80% 75 Pest Control $7,457 T12 1.95% 155 $3,600 0.80% 75 Total Contract Services $12,525 3.27% 261 $9,600 2.14% 200 Repairs & Maintenance $55,226 T12 14.44% 1,151 $28,800 6.43% 600 Marketing & Promotion $0 0.00% 0 $2,400 0.54% 50 On-Site Payroll $6,590 T12 1.72% 137 $43,200 9.65% 900 Payroll Taxes & Benefits $0 0.00% 0 $4,800 1.07% 100 General & Administrative $2,362 T12 0.62% 49 $4,800 1.07% 100 Management Fee $29,652 T12 7.75% 618 $31,345 7.00% 653 Replacement & Reserves $12,240 Note 1 3.20% 255 $12,607 2.82% 263 Total Controllable $118,596 31.00% 2,471 $137,552 30.72% 2,866 TOTAL EXPENSES $213,229 55.74% 4,442 $249,508 55.72% 5,198 NET OPERATING INCOME $169,297 44.26% 3,527 $198,275 44.28% 4,131 EXPENSES INCOME
PROPERTY BREAKDOWN
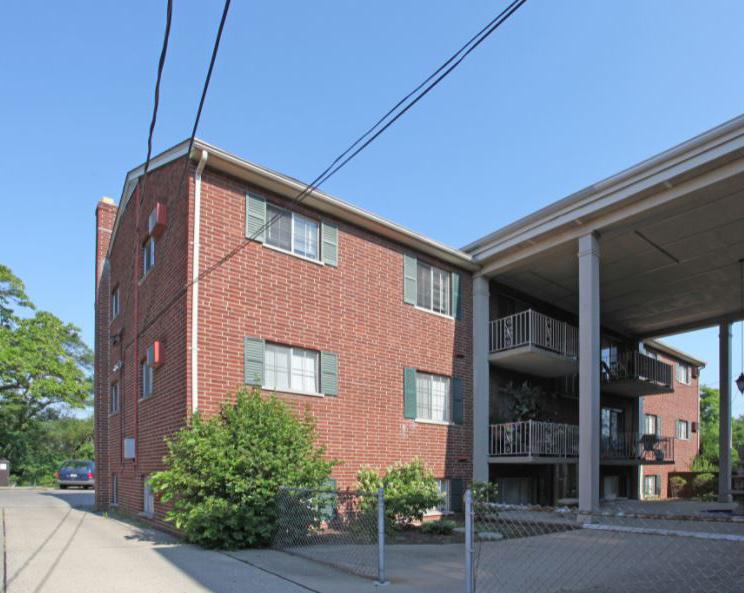
3113-3115 WERK ROAD
3113-3115 WERK ROAD YB: 1966
UNDERWRITING NOTES
1 Replacement & Reserves: added based on market norm of $255 per unit per year
AVERAGE EFFECTIVE MARKET PROJECTED UNIT TYPE NO. OF UNITS RENTABLE SF TOTAL SF RENT/UNIT RENT/SF TOTAL RENT POTENTIAL RENT/UNIT RENT/SF TOTAL RENT POTENTIAL RENT/UNIT RENT/SF TOTAL RENT POTENTIAL SUMMARY One Bedroom 22 Units 650 SF 14,300 SF $697.62 $1.07 $15,348 $750.00 $1.15 SF $16,500 $825.00 $1.27 SF $18,150 Totals / Wtd. Averages 22 Units 650 SF 14,300 SF $697.62 $1.07 SF $15,348 $750.00 $1.15 SF $16,500 $825.00 $1.27 SF $18,150
# NOTE
UNITS
SUBMARKET WESTWOOD AVERAGE EFFECTIVE RENT $697 OCCUPANCY 95% HVAC BOILER BASED HEAT THROUGH WALL A/C UTILITY RESPONSIBILITY: RESIDENT PAYS:
OWNER PAYS:
CAPEX
-30%
22
ELECTRIC
WATER, SEWER, TRASH, GAS
SINCE 2020:
of Unit Have LVP Flooring Throughout
CURRENT RENT ROLL: AS OF MARCH 28, 2023 INCOME & EXPENSES: AS OF JANUARY 2023 YEAR 1 GROSS POTENTIAL RENT % of GPR Per Unit % of GPR Per Unit All Units at Market Rent $198,000 RR 9,000 $217,800 9,900 Gain (Loss) to Lease ($11,940) 6.03% (543) ($4,356) 2.00% (198) GROSS SCHEDULED RENT $186,060 RR 8,457 $213,444 9,702 Other Income Laundry Fee $2,260 T12 1.21% 103 $2,328 1.09% 106 Total Other Income $2,260 1.21% 103 $2,328 1.09% 106 GROSS POTENTIAL INCOME $188,320 8,560 $215,772 9,808 Physical Vacancy ($9,146) T12 Economic 4.92% (416) ($10,672) 5.00% (485) Bad Debt $0 0.00% 0 ($2,134) 1.00% (97) EFFECTIVE GROSS INCOME $179,174 89.05% 8,144 $202,965 92.00% 9,226 NON-CONTROLLABLE Real Estate Taxes % of EGI Per Unit % of EGI 2021 Taxes Paid $14,221 Auditor 7.94% 646 $14,221 7.01% 646 Total Real Estate Taxes $14,221 7.94% 646 $14,221 7.01% 646 Insurance $4,705 T12 2.63% 214 $8,800 4.34% 400 Utilities Utilities $16,183 T12 9.03% 736 $16,507 8.13% 750 Utilities Vacant $115 T12 0.06% 5 $117 0.06% 5 Water & Sewage $20,162 T12 11.25% 916 $20,565 10.13% 935 Trash Removal $2,539 T12 1.42% 115 $2,590 1.28% 118 Total Utilities $38,999 21.77% 1,773 $39,779 19.60% 1,808 Total Non-Controllable $57,924 32.33% 2,633 $62,799 30.94% 2,855 CONTROLLABLE Contract Services Snow Removal $914 T12 0.51% 42 $770 0.38% 35 Landscaping/Grounds $1,755 T12 0.98% 80 $2,200 1.08% 100 Pest Control $856 T12 0.48% 39 $770 0.38% 35 Total Contract Services $3,524 1.97% 160 $3,740 1.84% 170 Repairs & Maintenance $21,570 T12 12.04% 980 $13,200 6.50% 600 Marketing & Promotion $0 0.00% 0 $1,100 0.54% 50 On-Site Payroll $0 0.00% 0 $19,800 9.76% 900 Payroll Taxes & Benefits $0 0.00% 0 $2,200 1.08% 100 General & Administrative $730 T12 0.41% 33 $2,200 1.08% 100 Management Fee $14,124 T12 7.88% 642 $14,208 7.00% 646 Replacement & Reserves $5,610 Note 1 3.13% 255 $5,778 2.85% 263 Total Controllable $45,559 25.43% 2,071 $62,226 30.66% 2,828 TOTAL EXPENSES $103,483 57.76% 4,704 $125,025 61.60% 5,683 NET OPERATING INCOME $75,692 42.24% 3,441 $77,940 38.40% 3,543 EXPENSES INCOME
PROPERTY BREAKDOWN
2821-2822 PRICE AVE
2821-2822 PRICE AVE YB: 1980
24
# NOTE
EAST PRICE HILL
EFFECTIVE RENT $731
90%
BOILER BASED HEAT THROUGH WALL A/C (2017)
UNDERWRITING NOTES
1 Replacement & Reserves: added based on market norm of $255 per unit per year
2 Repairs & Maint: $13,458 of Capex improvements removed from trailing
RESPONSIBILITY:
PAYS: ELECTRIC
PAYS: WATER, SEWER, TRASH, GAS
AVERAGE EFFECTIVE MARKET PROJECTED UNIT TYPE NO. OF UNITS RENTABLE SF TOTAL SF RENT/UNIT RENT/SF TOTAL RENT POTENTIAL RENT/UNIT RENT/SF TOTAL RENT POTENTIAL RENT/UNIT RENT/SF TOTAL RENT POTENTIAL SUMMARY One Bedroom 22 Units 650 SF 14,300 SF $730.25 $1.12 $16,066 $750.00 $1.15 SF $16,500 $825.00 $1.27 SF $18,150 Two Bedroom 2 Units 850 SF 1,700 SF $750.00 $0.88 $1,500 $750.00 $0.88 SF $1,500 $975.00 $1.15 SF $1,950 Totals / Wtd. Averages 24 Units 667 SF 16,000 SF $731.90 $1.10 SF $17,566 $750.00 $1.13 SF $18,000 $837.50 $1.26 SF $20,100
UNITS
SUBMARKET
AVERAGE
OCCUPANCY
HVAC
UTILITY
RESIDENT
OWNER
CURRENT RENT ROLL: AS OF MARCH 28, 2023 INCOME & EXPENSES: AS OF JANUARY 2023 YEAR 1 GROSS POTENTIAL RENT % of GPR Per Unit % of GPR Per Unit All Units at Market Rent $216,000 RR 9,000 $241,200 10,050 Gain (Loss) to Lease ($4,740) 2.19% (198) ($4,824) 2.00% (201) GROSS SCHEDULED RENT $211,260 RR 8,803 $236,376 9,849 Other Income Security Deposit Forfeit $2,214 T12 1.05% 92 $2,281 0.96% 95 Laundry Fee $1,672 T12 0.79% 70 $1,722 0.73% 72 Total Other Income $3,886 1.84% 162 $4,003 1.69% 167 GROSS POTENTIAL INCOME $215,146 8,964 $240,379 10,016 Physical Vacancy ($20,255) T12 Economic 9.59% (844) ($11,819) 5.00% (492) Bad Debt $0 0.00% 0 ($2,364) 1.00% (98) EFFECTIVE GROSS INCOME $194,891 88.22% 8,120 $226,196 92.00% 9,425 NON-CONTROLLABLE Real Estate Taxes % of EGI Per Unit % of EGI 2021 Taxes Paid $13,068 Auditor 6.71% 544 $13,068 5.78% 544 Total Real Estate Taxes $13,068 6.71% 544 $13,068 5.78% 544 Insurance $4,333 T12 2.22% 181 $9,600 4.24% 400 Utilities Utilities $8,632 T12 4.43% 360 $8,805 3.89% 367 Utilities Vacant $58 T12 0.03% 2 $59 0.03% 2 Water & Sewage $11,156 T12 5.72% 465 $11,379 5.03% 474 Trash Removal $4,510 T12 2.31% 188 $4,600 2.03% 192 Total Utilities $24,356 12.50% 1,015 $24,844 10.98% 1,035 Total Non-Controllable $41,757 21.43% 1,740 $47,511 21.00% 1,980 CONTROLLABLE Contract Services Snow Removal $1,258 T12 0.65% 52 $1,200 0.53% 50 Landscaping/Grounds $2,054 T12 1.05% 86 $2,400 1.06% 100 Pest Control $998 T12 0.51% 42 $840 0.37% 35 Total Contract Services $4,310 2.21% 180 $4,440 1.96% 185 Repairs & Maintenance $32,400 T12 Note 2 16.62% 1,350 $14,400 6.37% 600 Marketing & Promotion $0 0.00% 0 $1,200 0.53% 50 On-Site Payroll $1,142 T12 0.59% 48 $24,000 10.61% 1,000 Payroll Taxes & Benefits $0 0.00% 0 $2,400 1.06% 100 General & Administrative $1,600 T12 0.82% 67 $2,400 1.06% 100 Management Fee $15,360 T12 7.88% 640 $15,834 7.00% 660 Replacement & Reserves $6,120 Note 1 3.14% 255 $6,304 2.79% 263 Total Controllable $60,932 31.26% 2,539 $70,977 31.38% 2,957 TOTAL EXPENSES $102,690 52.69% 4,279 $118,489 52.38% 4,937 NET OPERATING INCOME $92,202 47.31% 3,842 $107,708 47.62% 4,488 EXPENSES INCOME
808 HARRIS AVE
808 HARRIS AVE YB: 1973
UNITS 11
SUBMARKET EAST PRICE HILL AVERAGE EFFECTIVE RENT $710
90%
HVAC BOILER BASED HEAT THROUGH WALL A/C
UTILITY RESPONSIBILITY:
RESIDENT PAYS: ELECTRIC
OWNER PAYS: WATER, SEWER, TRASH, GAS
CAPEX SINCE 2019:
- New Flat Rubber Membrane Roof (complete tear-off)
- Three Units with LVP Flooring Throughout
UNDERWRITING NOTES
# NOTE
1 Replacement & Reserves: added based on market norm of $255 per unit per year
AVERAGE EFFECTIVE MARKET PROJECTED UNIT TYPE NO. OF UNITS RENTABLE SF TOTAL SF RENT/UNIT RENT/SF TOTAL RENT POTENTIAL RENT/UNIT RENT/SF TOTAL RENT POTENTIAL RENT/UNIT RENT/SF TOTAL RENT POTENTIAL SUMMARY One Bedroom 11 Units 650 SF 7,150 SF $710.11 $1.09 $7,811 $750.00 $1.15 SF $8,250 $825.00 $1.27 SF $9,075 Totals / Wtd. Averages 11 Units 650 SF 7,150 SF $710.11 $1.09 SF $7,811 $750.00 $1.15 SF $8,250 $825.00 $1.27 SF $9,075
PROPERTY BREAKDOWN
OCCUPANCY
CURRENT RENT ROLL: AS OF MARCH 28, 2023 INCOME & EXPENSES: AS OF JANUARY 2023 YEAR 1 GROSS POTENTIAL RENT % of GPR Per Unit % of GPR Per Unit All Units at Market Rent $106,800 RR 9,709 $108,900 9,900 Gain (Loss) to Lease ($4,308) 4.03% (392) ($4,356) 4.00% (396) GROSS SCHEDULED RENT $102,492 RR 9,317 $104,544 9,504 Other Income Laundry Fee $709 T12 0.69% 64 $730 0.70% 66 Prepayment Forfeit $675 T12 0.66% 61 $695 0.67% 63 Total Other Income $1,384 1.35% 126 $1,426 1.36% 130 GROSS POTENTIAL INCOME $103,876 9,443 $105,970 9,634 Physical Vacancy ($10,093) T12 Economic 9.85% (918) ($5,227) 5.00% (475) Bad Debt $0 0.00% 0 ($1,045) 1.00% (95) EFFECTIVE GROSS INCOME $93,783 86.12% 8,526 $99,697 90.00% 9,063 NON-CONTROLLABLE Real Estate Taxes % of EGI Per Unit % of EGI 2021 Taxes Paid $4,812 Auditor 5.13% 437 $4,812 4.83% 437 Total Real Estate Taxes $4,812 5.13% 437 $4,812 4.83% 437 Insurance $1,076 T12 1.15% 98 $3,300 3.31% 300 Utilities Utilities $6,741 T12 7.19% 613 $6,876 6.90% 625 Utilities Vacant $230 T12 0.25% 21 $234 0.24% 21 Water & Sewage $5,323 T12 5.68% 484 $5,429 5.45% 494 Trash Removal $2,256 T12 2.41% 205 $2,301 2.31% 209 Total Utilities $14,549 15.51% 1,323 $14,840 14.89% 1,349 Total Non-Controllable $20,437 21.79% 1,858 $22,952 23.02% 2,087 CONTROLLABLE Contract Services Snow Removal $884 T12 0.94% 80 $825 0.83% 75 Landscaping/Grounds $1,335 T12 1.42% 121 $1,100 1.10% 100 Pest Control $1,455 T12 1.55% 132 $825 0.83% 75 Total Contract Services $3,674 3.92% 334 $2,750 2.76% 250 Repairs & Maintenance $13,766 T12 14.68% 1,251 $6,600 6.62% 600 Marketing & Promotion $0 0.00% 0 $550 0.55% 50 On-Site Payroll $0 0.00% 0 $9,900 9.93% 900 Payroll Taxes & Benefits $2,092 T12 2.23% 190 $1,100 1.10% 100 General & Administrative $0 0.00% 0 $1,100 1.10% 100 Management Fee $7,378 T12 7.87% 671 $7,976 8.00% 725 Replacement & Reserves $2,805 Note 1 2.99% 255 $2,889 2.90% 263 Total Controllable $29,716 31.69% 2,701 $32,865 32.96% 2,988 TOTAL EXPENSES $50,153 53.48% 4,559 $55,817 55.99% 5,074 NET OPERATING INCOME $43,630 46.52% 3,966 $43,880 44.01% 3,989 EXPENSES INCOME
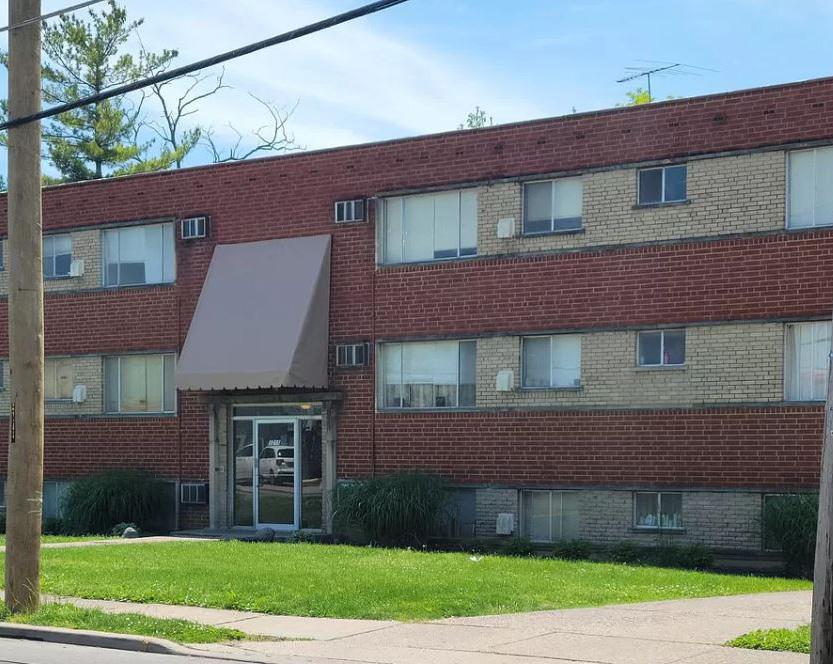
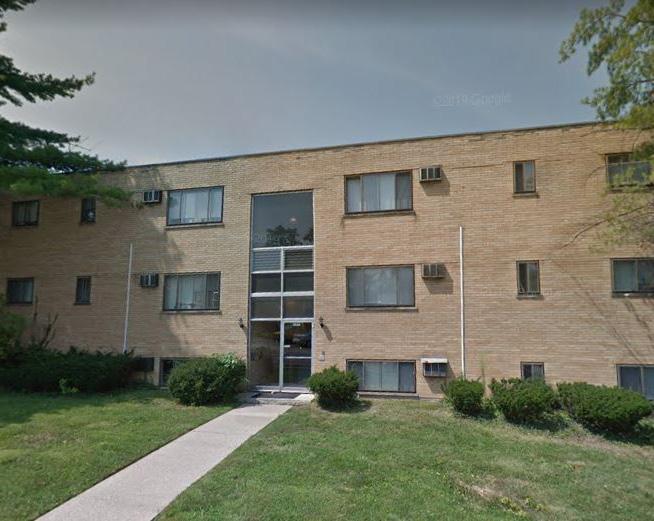
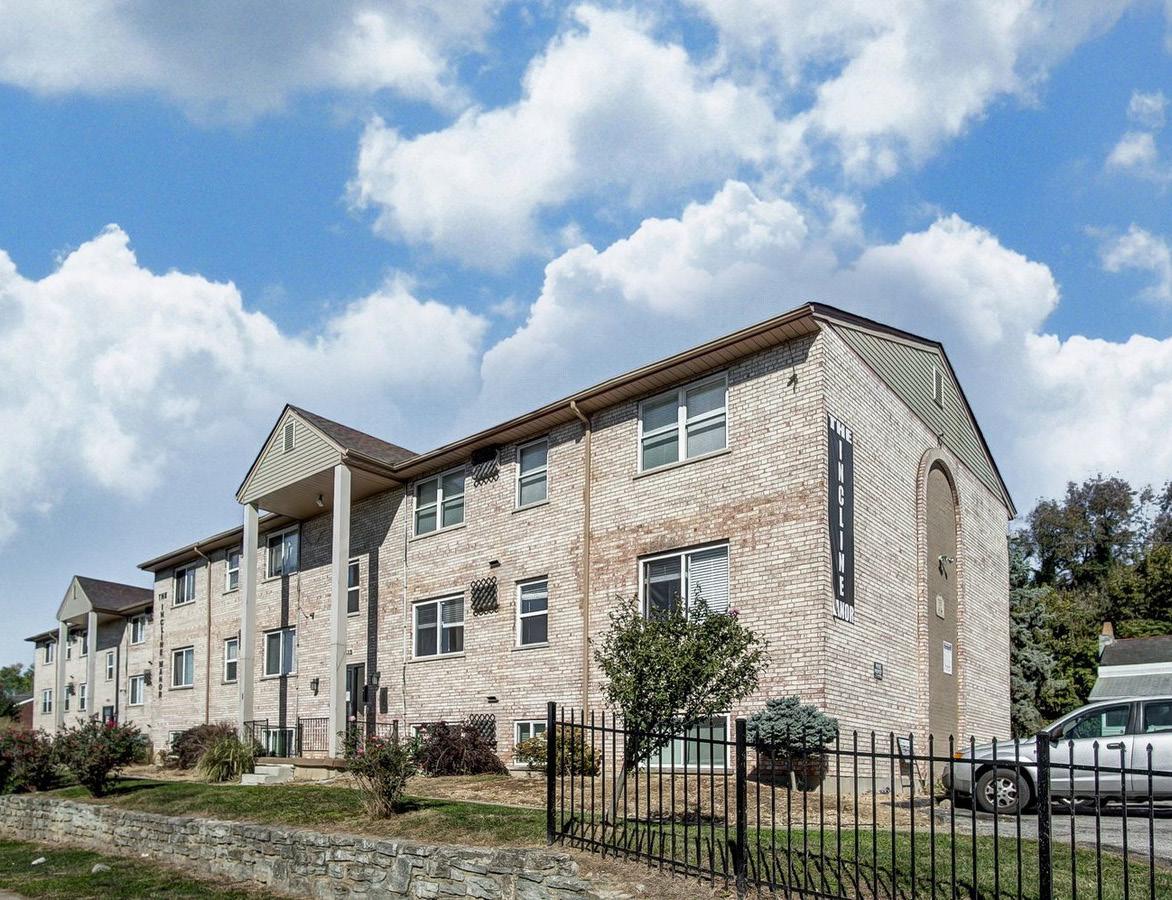
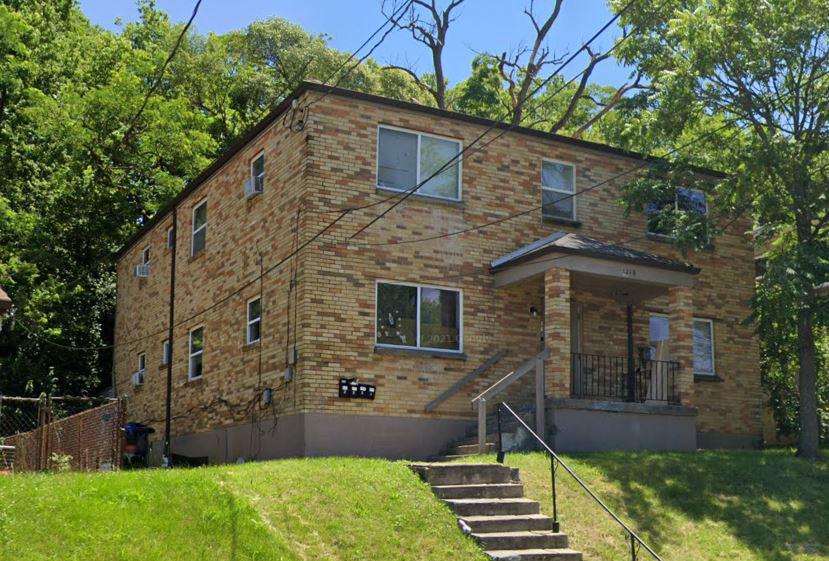
5015 SIDNEY ROAD
5015
SIDNEY ROAD YB: 1963
UNDERWRITING NOTES
# NOTE
1 Replacement & Reserves: added based on market norm of $255 per unit per year
2 Repairs & Maint: $1,497 of Capex improvements removed from trailing
BASED HEAT
OWNER
CAPEX
-20%
PROPERTY BREAKDOWN AVERAGE EFFECTIVE MARKET PROJECTED UNIT TYPE NO. OF UNITS RENTABLE SF TOTAL SF RENT/UNIT RENT/SF TOTAL RENT POTENTIAL RENT/UNIT RENT/SF TOTAL RENT POTENTIAL RENT/UNIT RENT/SF TOTAL RENT POTENTIAL SUMMARY One Bedroom 11 Units 650 SF 7,150 SF $628.13 $0.97 $6,909 $750.00 $1.15 SF $8,250 $825.00 $1.27 SF $9,075 Totals / Wtd. Averages 11 Units 650 SF 7,150 SF $628.13 $0.97 SF $6,909 $750.00 $1.15 SF $8,250 $825.00 $1.27 SF $9,075
UNITS 11 SUBMARKET WESTWOOD AVERAGE EFFECTIVE RENT $628 OCCUPANCY 75% HVAC BOILER
THROUGH
UTILITY
3 Water/Sewer: Recduced by 50% due to leak RESIDENT
WALL A/C
RESPONSIBILITY:
PAYS: ELECTRIC
PAYS: WATER, SEWER, TRASH, GAS
SINCE 2020:
of Units Have LVP Flooring Throughout
CURRENT RENT ROLL: AS OF MARCH 28, 2023 INCOME & EXPENSES: AS OF JANUARY 2023 YEAR 1 GROSS POTENTIAL RENT % of GPR Per Unit % of GPR Per Unit All Units at Market Rent $99,000 RR 9,000 $108,900 9,900 Gain (Loss) to Lease ($11,700) 11.82% (1,064) ($6,534) 6.00% (594) GROSS SCHEDULED RENT $87,300 RR 7,936 $102,366 9,306 Other Income Laundry Fee $957 T12 1.10% 87 $985 0.96% 90 Maintenance Income $75 T12 0.09% 7 $77 0.08% 7 Total Other Income $1,032 1.18% 94 $1,063 1.04% 97 GROSS POTENTIAL INCOME $88,332 8,030 $103,429 9,403 Physical Vacancy ($22,274) T12 Economic 25.51% (2,025) ($15,355) 15.00% (1,396) Bad Debt $0 0.00% 0 ($1,024) 1.00% (93) EFFECTIVE GROSS INCOME $66,058 62.67% 6,005 $87,050 78.00% 7,914 NON-CONTROLLABLE Real Estate Taxes % of EGI Per Unit % of EGI 2021 Taxes Paid $6,850 Auditor 10.37% 623 $6,850 7.87% 623 Total Real Estate Taxes $6,850 10.37% 623 $6,850 7.87% 623 Insurance $7,875 T12 11.92% 716 $4,400 5.05% 400 Utilities Utilities $8,390 T12 12.70% 763 $8,558 9.83% 778 Utilities Vacant $200 T12 0.30% 18 $204 0.23% 19 Water & Sewage $18,874 T12 Note 3 28.57% 1,716 $9,437 10.84% 858 Trash Removal $2,208 T12 3.34% 201 $2,252 2.59% 205 Total Utilities $29,673 44.92% 2,698 $20,452 23.49% 1,859 Total Non-Controllable $44,397 67.21% 4,036 $31,701 36.42% 2,882 CONTROLLABLE Contract Services Snow Removal $959 T12 1.45% 87 $990 1.14% 90 Landscaping/Grounds $1,854 T12 2.81% 169 $1,650 1.90% 150 Pest Control $405 T12 0.61% 37 $385 0.44% 35 Total Contract Services $3,217 4.87% 292 $3,025 3.48% 275 Repairs & Maintenance $19,810 T12 Note 2 29.99% 1,801 $7,150 8.21% 650 Marketing & Promotion $0 0.00% 0 $550 0.63% 50 On-Site Payroll $0 0.00% 0 $11,550 13.27% 1,050 Payroll Taxes & Benefits $0 0.00% 0 $1,100 1.26% 100 General & Administrative $1,072 T12 1.62% 97 $1,100 1.26% 100 Management Fee $5,186 T12 7.85% 471 $6,964 8.00% 633 Replacement & Reserves $2,805 Note 1 4.25% 255 $2,889 3.32% 263 Total Controllable $32,090 48.58% 2,917 $34,328 39.43% 3,121 TOTAL EXPENSES $76,487 115.79% 6,953 $66,029 75.85% 6,003 NET OPERATING INCOME ($10,429) -15.79% (948) $21,021 24.15% 1,911 EXPENSES INCOME
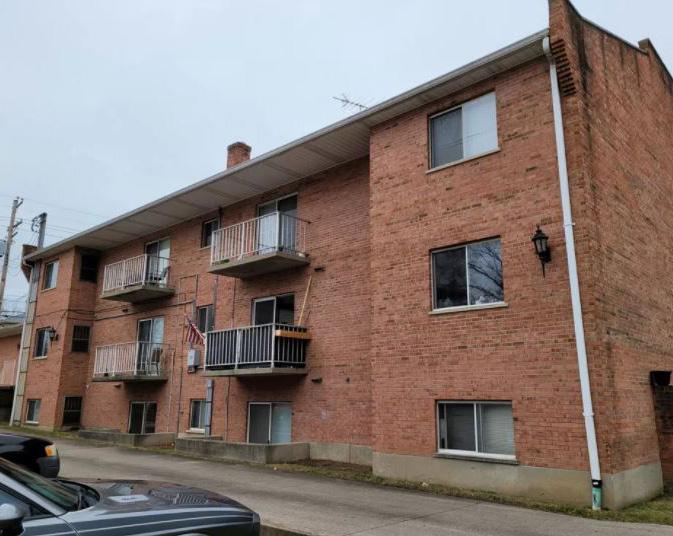
3841 nolan ave
3841 NOLAN AVE YB: 1963 UNITS 11
SUBMARKET CHEVIOT AVERAGE EFFECTIVE RENT $711
92%
BOILER BASED HEAT THROUGH WALL A/C (2017)
UNDERWRITING NOTES
UTILITY RESPONSIBILITY:
PAYS: ELECTRIC
PAYS: WATER, SEWER, TRASH, GAS CAPEX SINCE 2020: -30% of Unit Have LVP Flooring Throughout
# NOTE
1 Replacement & Reserves: added based on market norm of $255 per unit per year
2 Repairs & Maint: $4,345 of Capex improvements removed from trailing
PROPERTY BREAKDOWN AVERAGE EFFECTIVE MARKET PROJECTED UNIT TYPE NO. OF UNITS RENTABLE SF TOTAL SF RENT/UNIT RENT/SF TOTAL RENT POTENTIAL RENT/UNIT RENT/SF TOTAL RENT POTENTIAL RENT/UNIT RENT/SF TOTAL RENT POTENTIAL SUMMARY One Bedoom 5 Units 650 SF 3,250 SF $637.50 $0.98 $3,188 $650.00 $1.00 SF $3,250 $825.00 $1.27 SF $4,125 Two Bedroom 6 Units 850 SF 5,100 SF $772.50 $0.91 $4,635 $850.00 $1.00 SF $5,100 $975.00 $1.15 SF $5,850 Totals / Wtd. Averages 11 Units 759 SF 8,350 SF $711.14 $0.94 SF $7,823 $759.09 $1.00 SF $8,350 $906.82 $1.19 SF $9,975
OCCUPANCY
HVAC
RESIDENT
OWNER
RENT ROLL: AS OF MARCH 28, 2023 INCOME & EXPENSES: AS OF JANUARY 2023 YEAR 1 GROSS POTENTIAL RENT % of GPR Per Unit % of GPR Per Unit All Units at Market Rent $100,200 RR 9,109 $119,700 10,882 Gain (Loss) to Lease ($4,620) 4.61% (420) ($2,394) 2.00% (218) GROSS SCHEDULED RENT $95,580 RR 8,689 $117,306 10,664 Other Income Laundry Fee $1,363 T12 1.43% 124 $1,404 1.20% 128 Maintenance Income $75 T12 0.08% 7 $77 0.07% 7 Total Other Income $1,438 1.50% 131 $1,481 1.26% 135 GROSS POTENTIAL INCOME $97,018 8,820 $118,787 10,799 Physical Vacancy ($8,113) T12 Economic 8.49% (738) ($5,865) 5.00% (533) Bad Debt $0 0.00% 0 ($1,173) 1.00% (107) EFFECTIVE GROSS INCOME $88,905 86.90% 8,082 $111,749 92.00% 10,159 NON-CONTROLLABLE Real Estate Taxes % of EGI Per Unit % of EGI 2021 Taxes Paid $9,104 Auditor 10.24% 828 $9,104 8.15% 828 Total Real Estate Taxes $9,104 10.24% 828 $9,104 8.15% 828 Insurance $1,613 T12 1.81% 147 $4,400 3.94% 400 Utilities Utilities $5,259 T12 5.92% 478 $5,364 4.80% 488 Utilities Vacant $147 T12 0.17% 13 $150 0.13% 14 Water & Sewage $14,693 T12 16.53% 1,336 $14,987 13.41% 1,362 Trash Removal $367 T12 0.41% 33 $375 0.34% 34 Total Utilities $20,466 23.02% 1,861 $20,876 18.68% 1,898 Total Non-Controllable $31,183 35.07% 2,835 $34,380 30.77% 3,125 CONTROLLABLE Contract Services Snow Removal $810 T12 0.91% 74 $825 0.74% 75 Landscaping/Grounds $1,785 T12 2.01% 162 $1,650 1.48% 150 Pest Control $0 0.00% 0 $385 0.34% 35 Total Contract Services $2,595 2.92% 236 $2,860 2.56% 260 Repairs & Maintenance $11,629 T12 Note 2 13.08% 1,057 $6,600 5.91% 600 Marketing & Promotion $0 0.00% 0 $825 0.74% 75 On-Site Payroll $0 0.00% 0 $9,900 8.86% 900 Payroll Taxes & Benefits $2,003 T12 2.25% 182 $1,100 0.98% 100 General & Administrative $555 T12 0.62% 50 $1,100 0.98% 100 Management Fee $6,877 T12 7.74% 625 $8,940 8.00% 813 Replacement & Reserves $2,805 Note 1 3.16% 255 $2,889 2.59% 263 Total Controllable $26,464 29.77% 2,406 $34,214 30.62% 3,110 TOTAL EXPENSES $57,647 64.84% 5,241 $68,594 61.38% 6,236 NET OPERATING INCOME $31,258 35.16% 2,842 $43,155 38.62% 3,923 EXPENSES INCOME
CURRENT
PROPERTY BREAKDOWN
3316 werk road
#
UNDERWRITING NOTES
AVERAGE EFFECTIVE MARKET PROJECTED UNIT TYPE NO. OF UNITS RENTABLE SF TOTAL SF RENT/UNIT RENT/SF TOTAL RENT POTENTIAL RENT/UNIT RENT/SF TOTAL RENT POTENTIAL RENT/UNIT RENT/SF TOTAL RENT POTENTIAL SUMMARY Office 1 Units 1,200 SF 1,200 SF $1,500.00 $1.25 $1,500 $1,500.00 $1.25 SF $1,500 $1,500.00 $1.25 SF $1,500 One Bedroom 9 Units 650 SF 5,850 SF $646.88 $1.00 $5,822 $750.00 $1.15 SF $6,750 $825.00 $1.27 SF $7,425 Two Bedroom 3 Units 850 SF 2,550 SF $733.33 $0.86 $2,200 $825.00 $0.97 SF $2,475 $975.00 $1.15 SF $2,925 Totals / Wtd. Averages 13 Units 738 SF 9,600 SF $732.45 $0.99 SF $9,522 $825.00 $1.12 SF $10,725 $911.54 $1.23 SF $11,850
NOTE
Replacement & Reserves: added based on market norm of $255 per unit per year
WERK ROAD YB: 1985 UNITS 12 & OFFICE SUBMARKET WESTWOOD AVERAGE EFFECTIVE RENT $732 OCCUPANCY 88% HVAC BOILER BASED HEAT THROUGH WALL A/C UTILITY RESPONSIBILITY: RESIDENT PAYS: ELECTRIC OWNER PAYS: WATER, SEWER, TRASH, GAS
1
3316
CURRENT RENT ROLL: AS OF MARCH 28, 2023 INCOME & EXPENSES: AS OF JANUARY 2023 YEAR 1 GROSS POTENTIAL RENT % of GPR Per Unit % of GPR Per Unit All Units at Market Rent $128,700 RR 9,900 $142,200 10,938 Gain (Loss) to Lease ($13,200) 10.26% (1,015) ($9,954) 7.00% (766) GROSS SCHEDULED RENT $115,500 RR 8,885 $132,246 10,173 Other Income Laundry Fee $1,241 T12 1.07% 95 $1,278 0.97% 98 Maintenance Income $480 T12 0.42% 37 $494 0.37% 38 Total Other Income $1,721 1.49% 132 $1,773 1.34% 136 GROSS POTENTIAL INCOME $117,221 9,017 $134,019 10,309 Physical Vacancy ($13,963) T12 Economic 12.09% (1,074) ($10,580) 8.00% (814) Bad Debt $0 0.00% 0 ($1,322) 1.00% (102) EFFECTIVE GROSS INCOME $103,258 77.65% 7,943 $122,117 84.00% 9,394 NON-CONTROLLABLE Real Estate Taxes % of EGI Per Unit % of EGI 2021 Taxes Paid $12,305 Auditor 11.92% 947 $12,305 10.08% 947 Total Real Estate Taxes $12,305 11.92% 947 $12,305 10.08% 947 Insurance $4,631 T12 4.48% 356 $5,200 4.26% 400 Utilities Utilities $4,178 T12 4.05% 321 $4,262 3.49% 328 Utilities Vacant $1,011 T12 0.98% 78 $1,031 0.84% 79 Water & Sewage $10,618 T12 10.28% 817 $10,830 8.87% 833 Trash Removal $3,985 T12 3.86% 307 $4,065 3.33% 313 Total Utilities $19,792 19.17% 1,522 $20,188 16.53% 1,553 Total Non-Controllable $36,727 35.57% 2,825 $37,693 30.87% 2,899 CONTROLLABLE Contract Services Snow Removal $939 T12 0.91% 72 $845 0.69% 65 Landscaping/Grounds $1,610 T12 1.56% 124 $1,625 1.33% 125 Pest Control $384 T12 0.37% 30 $455 0.37% 35 Total Contract Services $2,933 2.84% 226 $2,925 2.40% 225 Repairs & Maintenance $14,155 T12 13.71% 1,089 $7,800 6.39% 600 Marketing & Promotion $0 0.00% 0 $650 0.53% 50 On-Site Payroll $1,419 T12 1.37% 109 $11,700 9.58% 900 Payroll Taxes & Benefits $0 0.00% 0 $1,300 1.06% 100 General & Administrative $1,252 T12 1.21% 96 $1,300 1.06% 100 Management Fee $8,123 T12 7.87% 625 $8,548 7.00% 658 Replacement & Reserves $3,315 Note 1 3.21% 255 $3,414 2.80% 263 Total Controllable $31,196 30.21% 2,400 $37,638 30.82% 2,895 TOTAL EXPENSES $67,923 65.78% 5,225 $75,330 61.69% 5,795 NET OPERATING INCOME $35,335 34.22% 2,718 $46,786 38.31% 3,599 EXPENSES INCOME
04 avondale avondale ADDRESS 603-613 FOREST AVE
LOCATION - AVONDALE COMPS
RENT COMPARABLES

603 FOREST AVE * 3 1 4 2 1 3553 VAN ANTWERP PLACE 2 319 NORTHERN AVE 3 671 GLENWOOD AVE 4 514 FOREST AVE

LOCAL COMPETITORS AVONDALE
Units 18 Year Built 1963 Occupancy 88.0% One Bedroom Three Bedroom 650SF 1100SF Rent: $650 Rent: $1,100 Rent Per SF: $1.00 Rent Per SF: $1.00
VAN ANTWERP PLZ 1 319 NORTHERN AVE 2 Units 6 Year Built 1910 Occupancy 67.0% Two Bedroom Three Bedroom 890SF 1200SF Rent: $900 Rent: $1,300 Rent Per SF: $1.01 Rent Per SF: $1.08
3553
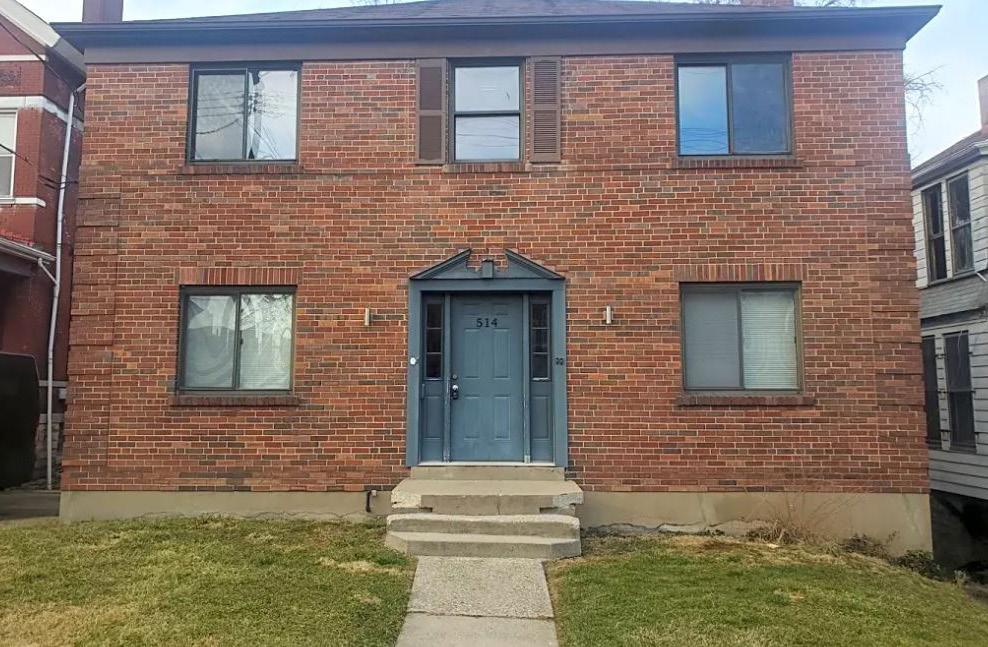
3 Units 2 Year Built 1935 Occupancy Lease-Up Post Reno One Bedroom Two Bedroom 900SF 1300SF Rent: $900 Rent: $1,200 Rent Per SF: $1.00 Rent Per SF: $0.92 514 FOREST AVE 4 Units 4 Year Built 1940 Occupancy 75.0% One Bedroom Two Bedroom 600SF SF Rent: $775 Rent: $ Rent Per SF: $1.29 Rent Per SF: $
671 GLENWOOD
PROPERTY BREAKDOWN
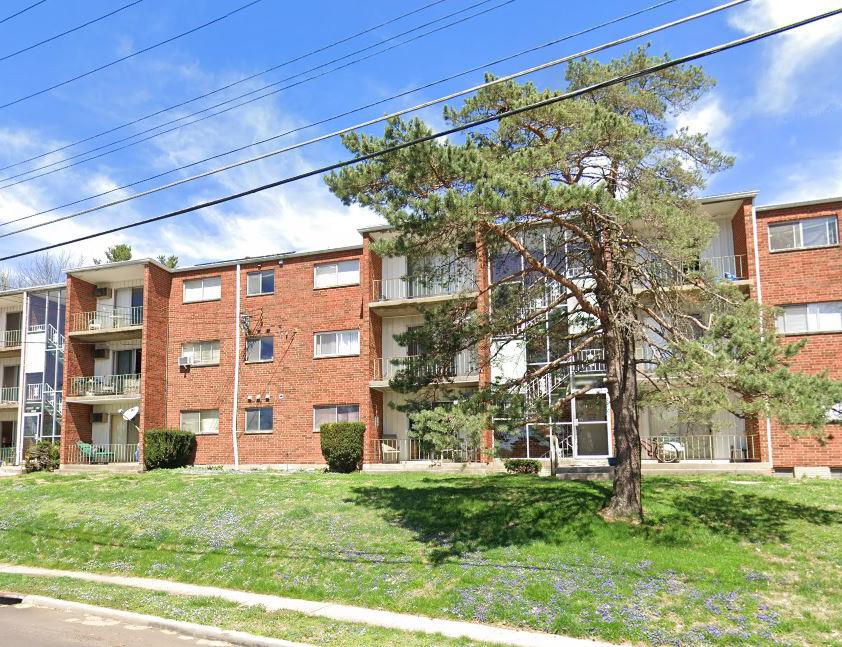
603-613 FOREST AVE
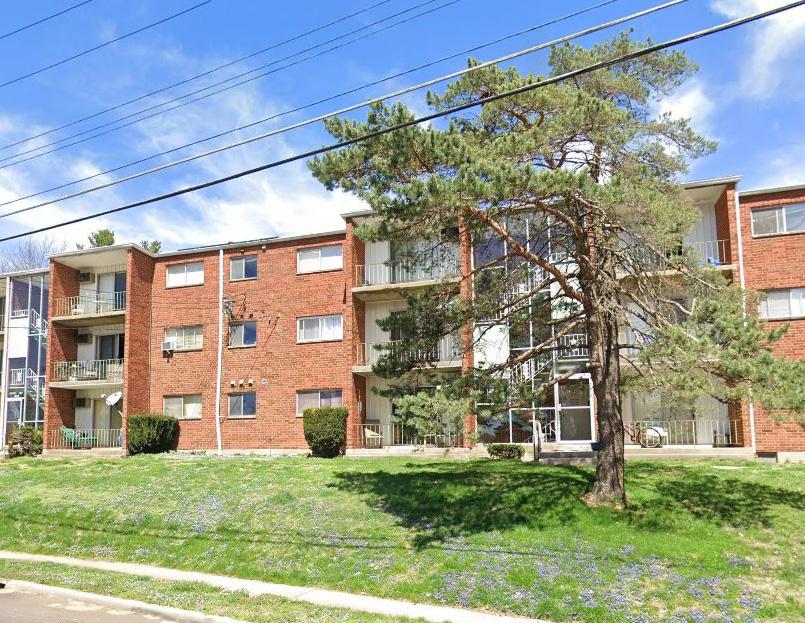
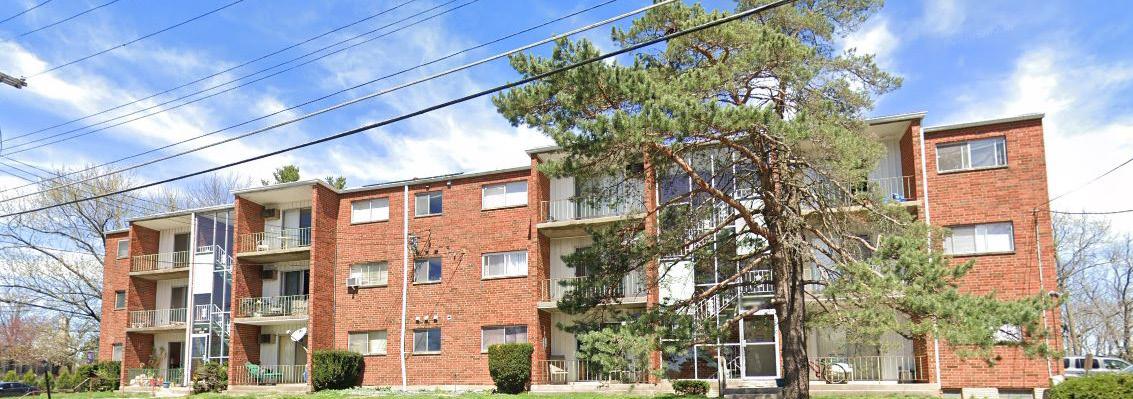
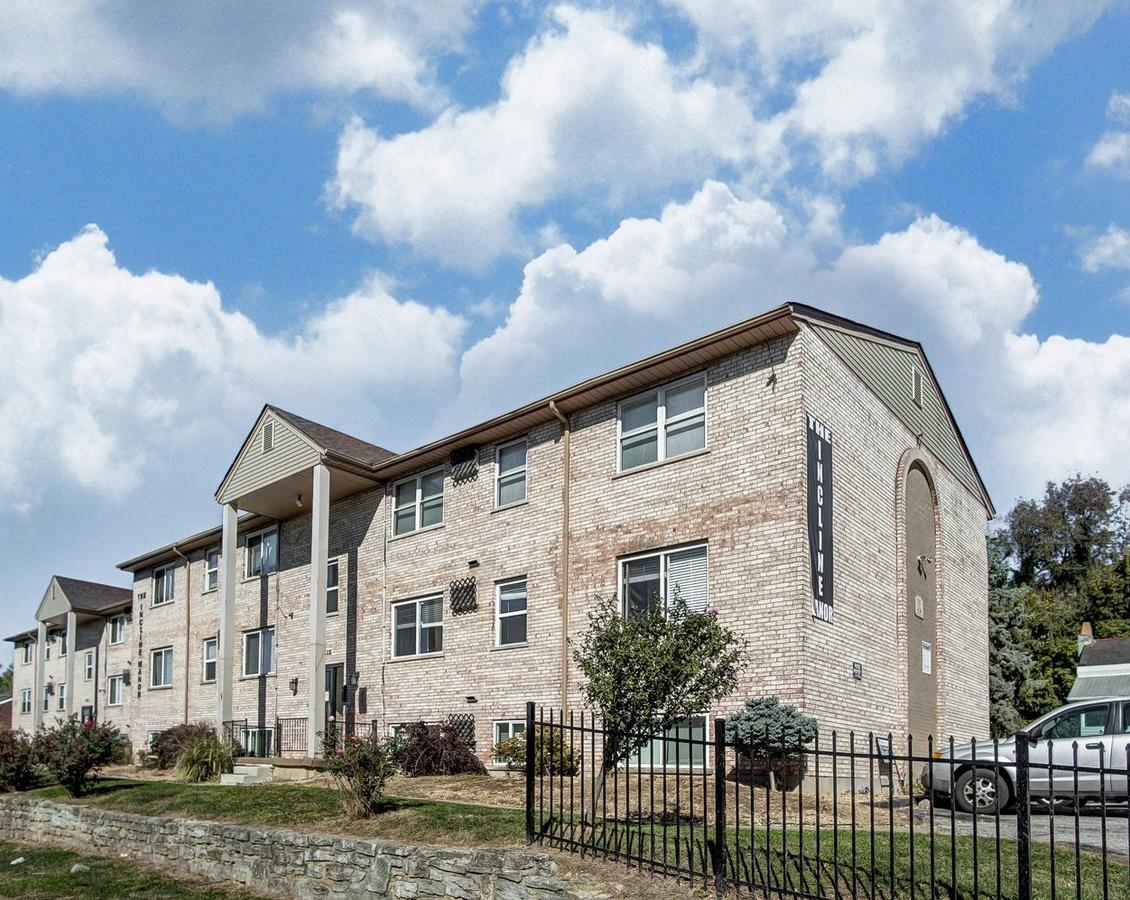
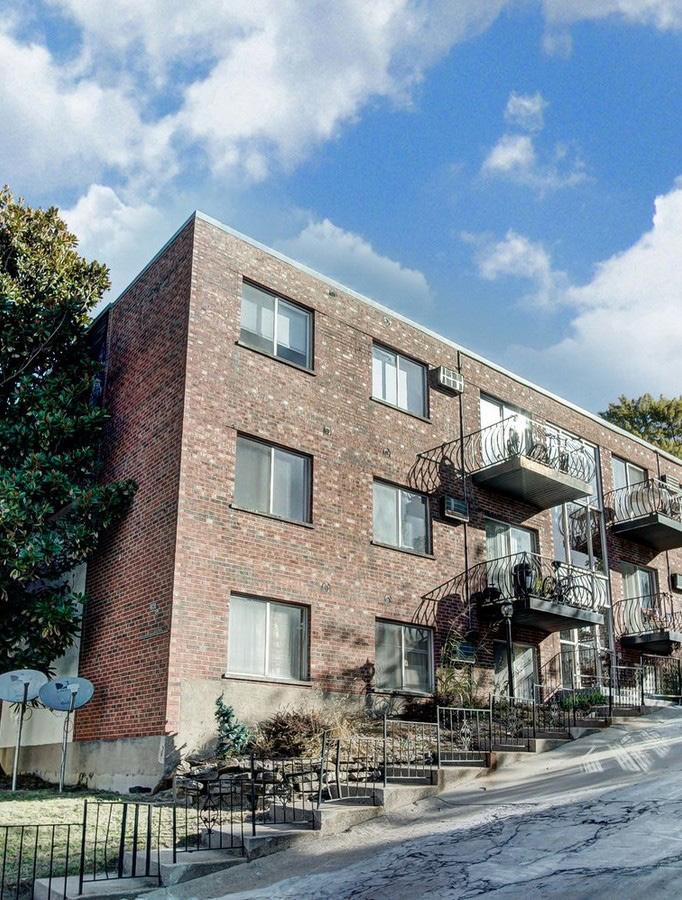
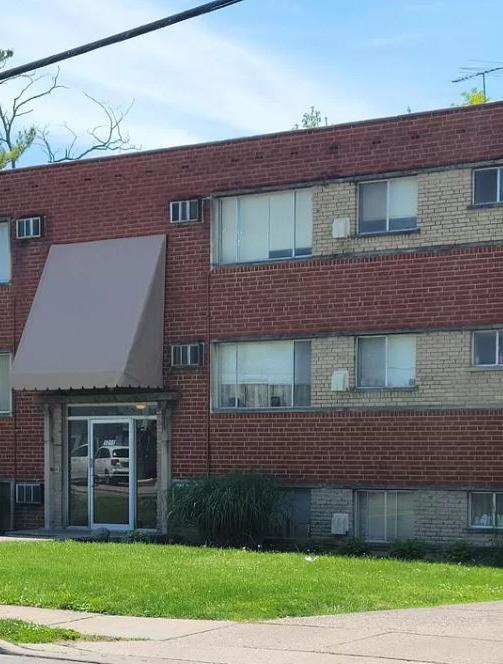
603-613 FOREST AVE YB: 1929
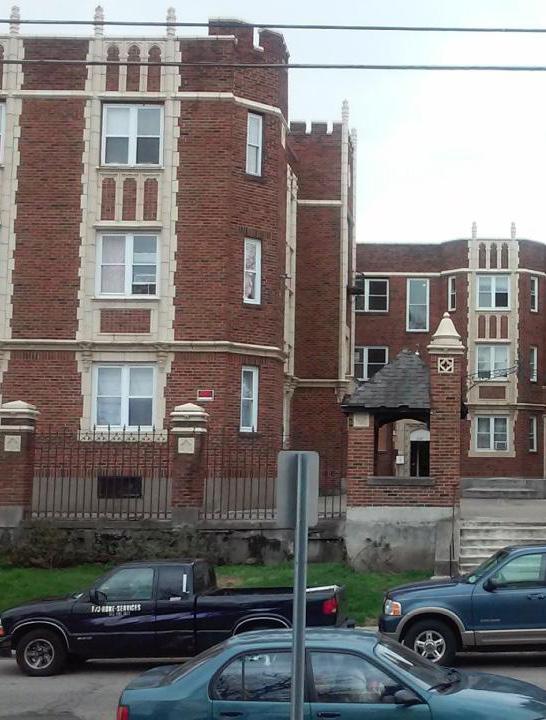
UNITS 35
SUBMARKET AVONDALE
AVERAGE EFFECTIVE RENT $963
OCCUPANCY 95%
HVAC BOILER BASED HEAT THROUGH WALL A/C
UTILITY RESPONSIBILITY:
RESIDENT PAYS: NONE
OWNER PAYS: WATER, SEWER, TRASH, GAS
CAPEX SINCE 2017:
New High Efficiency Boiler, All New LVP Throughout all Units
- 80% of Units Have New Kitchen Cabinets
- 80% of Units Have New Faux-Granite Countertops
- 80% of Units Have New SS Appliances
- 80% of Units Have New Lighting Fixtures
- All New Exterior Doors
# NOTE
UNDERWRITING NOTES
1 Replacement & Reserves: added based on market norm of $255 per unit per year
2 Repairs & Maint: $3,816 of Capex improvements removed from trailing
AVERAGE EFFECTIVE MARKET PROJECTED UNIT TYPE NO. OF UNITS RENTABLE SF TOTAL SF RENT/UNIT RENT/SF TOTAL RENT POTENTIAL RENT/UNIT RENT/SF TOTAL RENT POTENTIAL RENT/UNIT RENT/SF TOTAL RENT POTENTIAL SUMMARY One Bedroom 14 Units 650 SF 9,100 SF $753.55 $1.16 $10,550 $875.00 $1.35 SF $12,250 $825.00 $1.27 SF $11,550 Two Bedroom 9 Units 850 SF 7,650 SF $958.75 $1.13 $8,629 $1,000.00 $1.18 SF $9,000 $975.00 $1.15 SF $8,775 Three Bedroom 9 Units 1,100 SF 9,900 SF $1,159.78 $1.05 $10,438 $1,248.00 $1.13 SF $11,232 $1,250.00 $1.14 SF $11,250 Four Bedroom 3 Units 1,300 SF 3,900 SF $1,366.67 $1.05 $4,100 $1,450.00 $1.12 SF $4,350 $1,450.00 $1.12 SF $4,350 Totals / Wtd. Averages 35 Units 873 SF 30,550 SF $963.33 $1.10 SF $33,716 $1,052.34 $1.21 SF $36,832 $1,026.43 $1.18 SF $35,925
CURRENT RENT ROLL: AS OF MARCH 28, 2023 INCOME & EXPENSES: AS OF JANUARY 2023 YEAR 1 GROSS POTENTIAL RENT % of GPR Per Unit % of GPR Per Unit All Units at Market Rent $441,984 RR 12,628 $431,100 12,317 Gain (Loss) to Lease ($32,520) 7.36% (929) ($25,866) 6.00% (739) GROSS SCHEDULED RENT $409,464 RR 11,699 $405,234 11,578 Other Income Security Deposit Forfeit $2,727 T12 0.67% 78 $2,809 0.69% 80 Total Other Income $2,727 0.67% 78 $2,809 0.69% 80 GROSS POTENTIAL INCOME $412,191 11,777 $408,043 11,658 Physical Vacancy ($18,301) T12 Economic 4.47% (523) ($20,262) 5.00% (579) Bad Debt $0 0.00% 0 ($4,052) 1.00% (116) EFFECTIVE GROSS INCOME $393,890 88.17% 11,254 $383,729 88.00% 10,964 NON-CONTROLLABLE Real Estate Taxes % of EGI Per Unit % of EGI 2021 Taxes Paid $16,343 Auditor 4.15% 467 $16,343 4.26% 467 Total Real Estate Taxes $16,343 4.15% 467 $16,343 4.26% 467 Insurance $7,361 T12 1.87% 210 $14,000 3.65% 400 Utilities Utilities $27,294 T12 6.93% 780 $27,840 7.26% 795 Water & Sewage $26,005 T12 6.60% 743 $26,525 6.91% 758 Trash Removal $9,719 T12 2.47% 278 $9,914 2.58% 283 Total Utilities $63,019 16.00% 1,801 $64,279 16.75% 1,837 Total Non-Controllable $86,722 22.02% 2,478 $94,622 24.66% 2,703 CONTROLLABLE Contract Services Snow Removal $519 T12 0.13% 15 $1,225 0.32% 35 Landscaping/Grounds $1,860 T12 0.47% 53 $1,750 0.46% 50 Pest Control $3,089 T12 0.78% 88 $2,625 0.68% 75 Total Contract Services $5,468 1.39% 156 $5,600 1.46% 160 Repairs & Maintenance $39,564 T12 10.04% 1,130 $21,000 5.47% 600 Marketing & Promotion $0 0.00% 0 $1,750 0.46% 50 On-Site Payroll $0 0.00% 0 $31,500 8.21% 900 Payroll Taxes & Benefits $0 0.00% 0 $3,500 0.91% 100 General & Administrative $980 T12 0.25% 28 $3,500 0.91% 100 Management Fee $31,267 T12 7.94% 893 $26,861 7.00% 767 Replacement & Reserves $8,925 Note 1 2.27% 255 $9,193 2.40% 263 Total Controllable $86,204 21.89% 2,463 $102,904 26.82% 2,940 TOTAL EXPENSES $172,926 43.90% 4,941 $197,526 51.48% 5,644 NET OPERATING INCOME $220,964 56.10% 6,313 $186,203 48.52% 5,320 EXPENSES INCOME
LOCAL MARKET
05
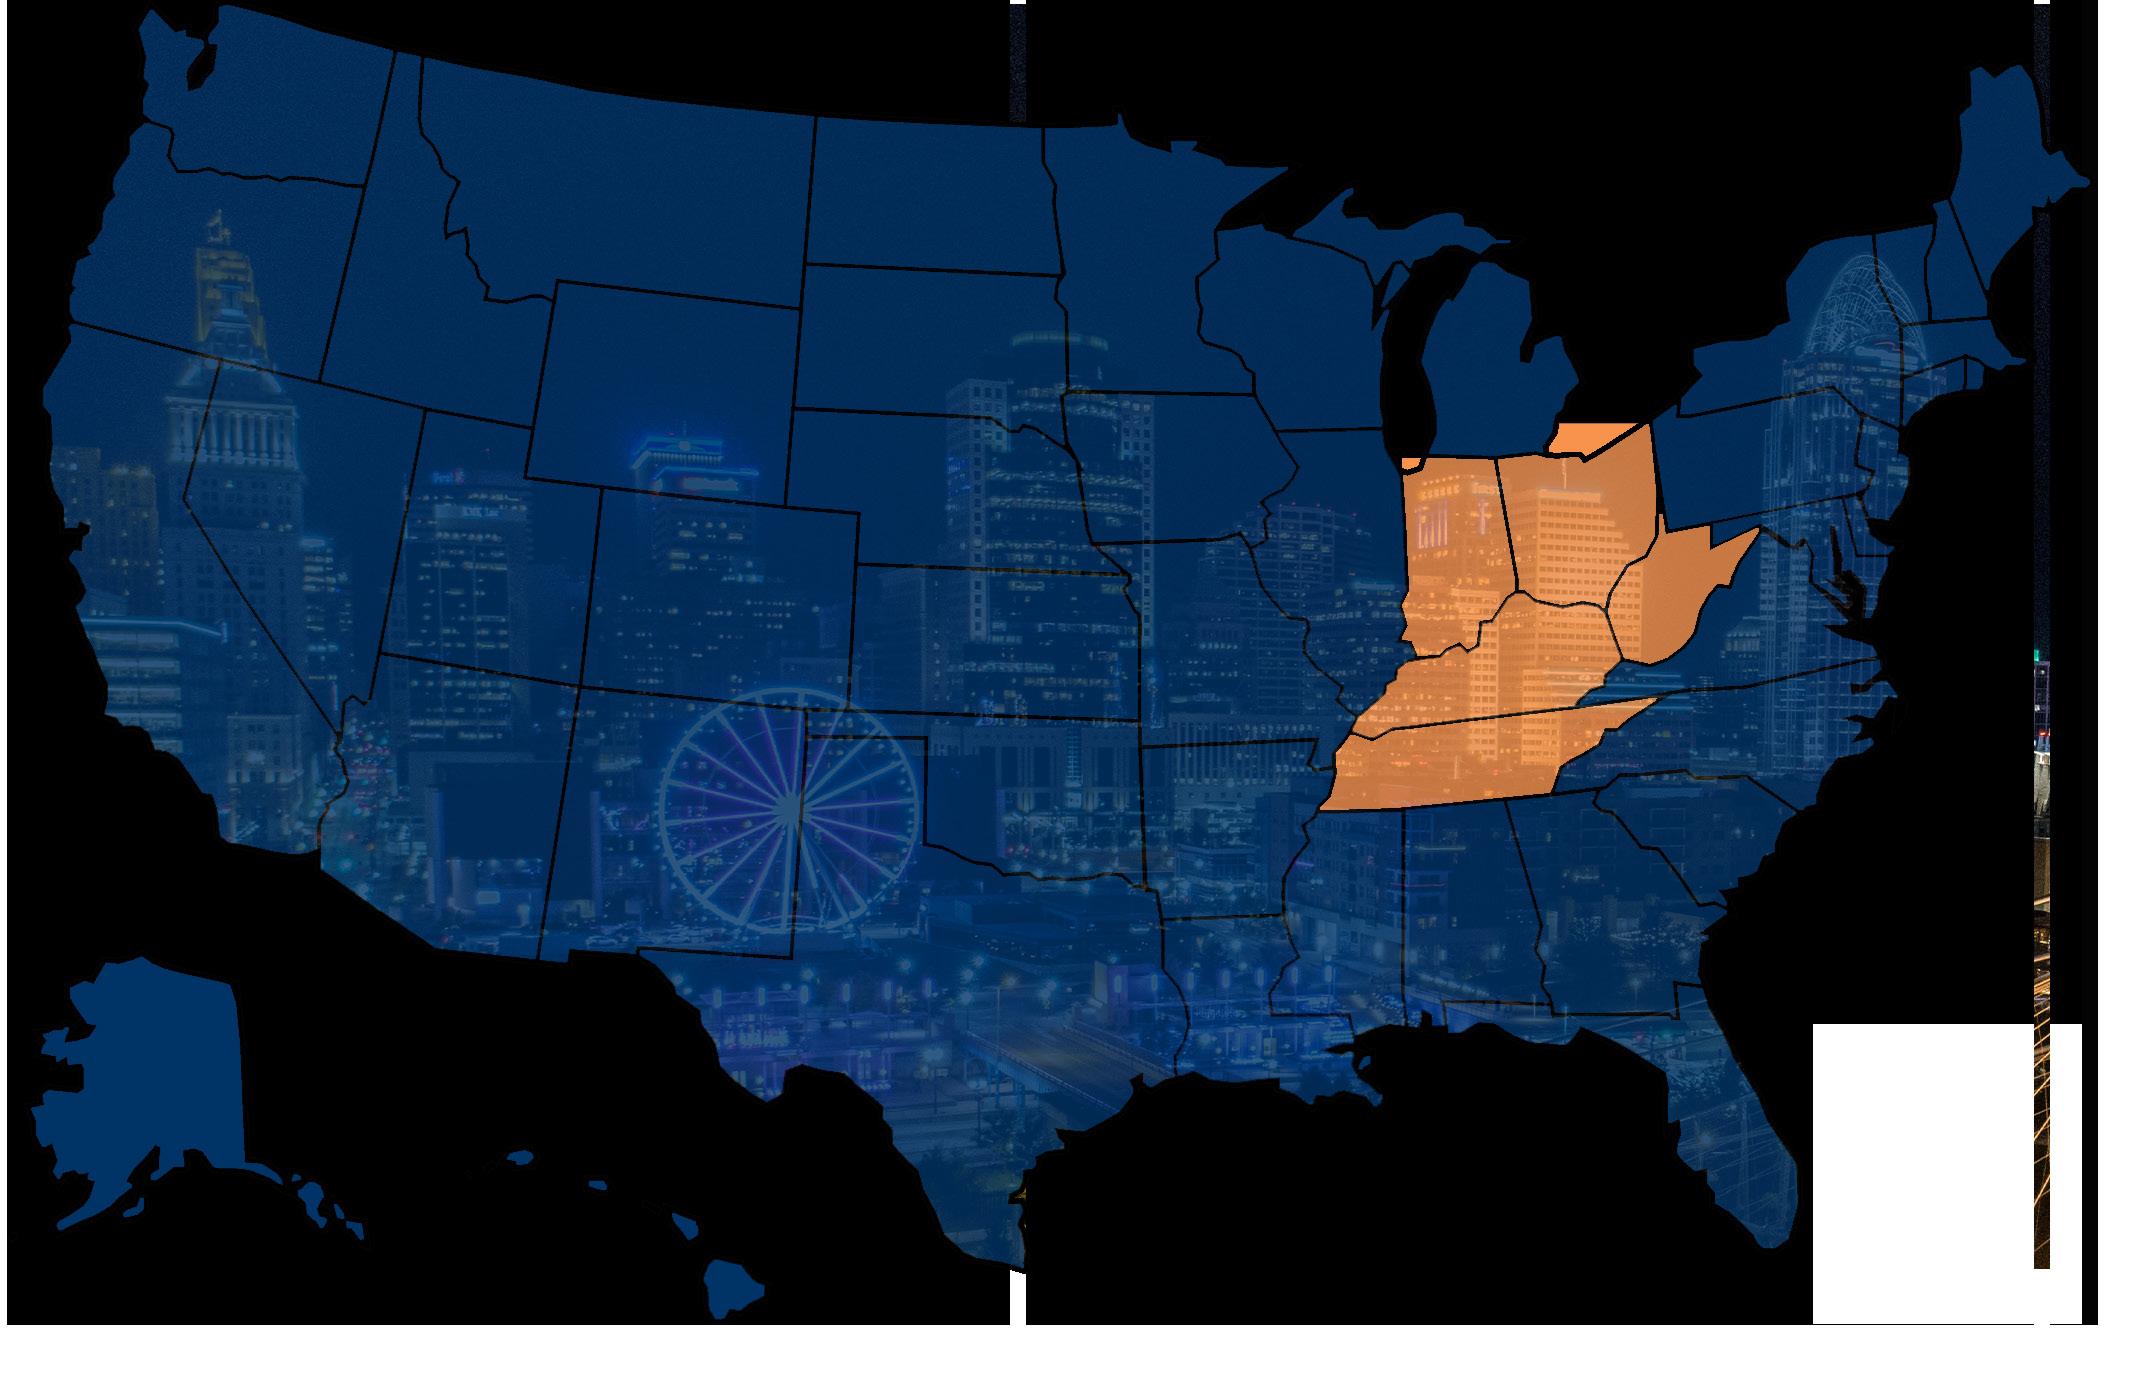
CINCINNATI, Ohio
The steady and stable nature of the Cincinnati apartment market was undoubtfully a benefit through 2020. The MSA saw a 2.7% annual increase in effective asking rents on new leases which matched the market’s norm for the 2010s decade. This growth put Cincinnati at #14 amongst the 50 largest markets for rent growth in 2020. Although occupancy was down 0.3 points from the prior year’s rate, the 4th quarter 2020 occupancy rate (96.4%) ranked #11 among the top 50 markets and #3 regionally. Only Q1 2020 saw net move-outs, although that’s typically the case in the local

market due to seasonal demand patterns, the three subsequent quarters saw huge demand and absorption totaled 1,563 units. That is 38% above the 20-year norm for annual absorption. During the peak of the pandemic challenges the job market declined 4.6%, this ranked Cincinnati 3rd best among the Midwest and was significantly better than the national average of 5.8%.
ECONOMIC OVERVIEW

Prior to the pandemic, Cincinnati’s real gross metropolitan prod uct grew at an average annual rate of 1.8% from 2015 to 2019. During that same five-year period, job growth averaged 1.4% annually, with roughly 15,500 jobs added on average each year. In 2020, COVID-19 mitigation measures and limited business activity caused the local economy to contract as much as 9.7% year-over-year in 2nd quarter. In the year-ending 3rd quarter 2022, the metro’s inflation-adjusted economic output expand ed 0.3%. At the same time, the metro recorded a net gain of 1,400 jobs, expanding the employment base 0.1%. Cincinnati’s unemployment rate in August 2022 declined 0.5 points yearover-year to 3.8%, on par with the national average of 3.8%. During the past year, job gains in Cincinnati were most pro nounced in the Manufacturing sector followed by Trade/Trans portation/Utilities. Due to job losses stemming from the pan demic, Cincinnati’s current employment base now sits at about 1% below the pre-pandemic level in February 2020. Cincinnati, like many other Rust Belt markets, has long had a concentration in higher-paying manufacturing jobs and has been working to reinvent its economy as a high-skill, high-value manufacturing center. Further, Cincinnati is home to corporate headquarters for seven Fortune 500 companies.

• Cincinnati characteristically managed to escape the more extreme swings in apartment market performance seen over the last two years in the wake of the pandemic. Although apartment absorption cooled considerably in 3rd quarter 2022, Cincinnati apartment demand did not plumet to the degree seen in many other markets nationwide.
• As deliveries mount to a record rate over the next year, operators will be unlikely to sustain Cincinnati’s recent record high rent growth. There were 6,411 units under construction at the end of 3rd quarter, with 3,722
DEMOGRAPHICS: STATISTICS
Population: 2.2M
Average occupancy: 96.9%
DEMOGRAPHIC OVERVIEW the rent
of those units slated to come online within the next 12 months. Although those deliveries will be spread more evenly throughout the Cincinnati market, new supply will test the depth of the Class A renter pool in a market that has still yet to recover all its pandemic-era job losses.
• During the year-ending 3rd Quarter 2022, median home prices in Cincinnati increased an average of 10.6%, landing at a median price of roughly $270,000.
• The local homeownership rate averaged 70.6% in the year-ending 2nd
• In 3rd quarter 2022, effective asking rents for new leases were up 11.8% yearover-year. That annual rent performance was above the market’s five-year average of 4.7%. Cincinnati’s recent annual rent change performance ranked #2 in the Midwest region.
Median age: 37.9
Rent growth: 11.8%
MSA median home value: $270,000
MSA median hhi: $66,900
• Product classes in Cincinnati, annual effective rent change registered at 14.8% in Class A units, 11.6% in Class B units and 8.1% in Class C units.
1 - Year growth: 10.6%
1 - Year growth: 2.35%
• Among submarkets, the strongest annual rent change performances over the past year were in Butler County and North Central Cincinnati.
• The weakest performances were in West Cincinnati and North Cincinnati. As of 3rd quarter 2022, effective asking rental rates in Cincinnati averaged S1,286 per month, or $1.372 per square foot.
SUPPLY & DEMAND
• New apartment completions in Cincinnati were modest recently, as 2,130 units delivered in the year-ending 3rd quarter 2022. With 176 units removed from existing stock over the past year, the local inventory base grew 1.2%.
• In the past year, supply was greatest in Central Cincinnati and Campbell/Kenton Counties. New supply was concentrated in Central Cincinnati, Campbell/Kenton Counties and Northeast Cincinnati/Warren County, which received 65% of the market’s total completions.
• At the end of 3rd quarter 2022, there were 6,411 units under construction with 3,722 of those units scheduled to complete in the next four quarters.
• Scheduled deliveries in the coming year are expected to be concentrated in North Central Cincinnati and Central Cincinnati.
• Over the past five years, annual absorption in Cincinnati has ranged from 675 units to 4,536 units, averaging 2,286 units annually during that time.
• In the year-ending 3rd quarter 2022, the market recorded demand for 1,013 units, trailing concurrent supply volumes. Among submarkets, the strongest absorption over the past five years was seen in Central Cincinnati, Campbell/Kenton Counties and Northeast Cincinnati/Warren County.
• Those areas accounted for 56% of the market’s total demand over the past five years. In the past year, demand was greatest in Central Cincinnati and Campbell/Kenton Counties.
CAPITAL MARKETS
• Transaction dollar volumes in Cincinnati totaled roughly $332.9 million in the year-ending 3rd quarter 2022, down about 40% year-over-year.
• Transactions in the year-ending 3rd quarter 2022 yielded an average cap rate of 5.50%, down 21 basis points year-over-year. By comparison, cap rates averaged 5.05% in the Midwest region and 4.56% nationally.
• The average price per unit in Cincinnati came in at roughly $151,800, up 57.4% annually. Cincinnati’s average price per unit landed below the norms for both the Midwest region ($173,900) and U.S. overall ($238,700).
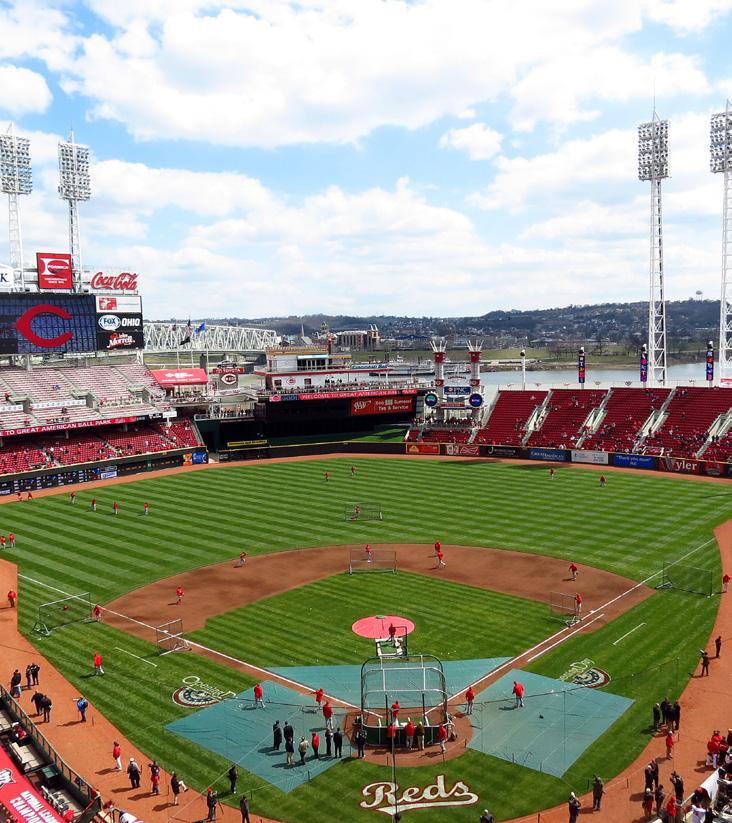
ATTRACTIONS
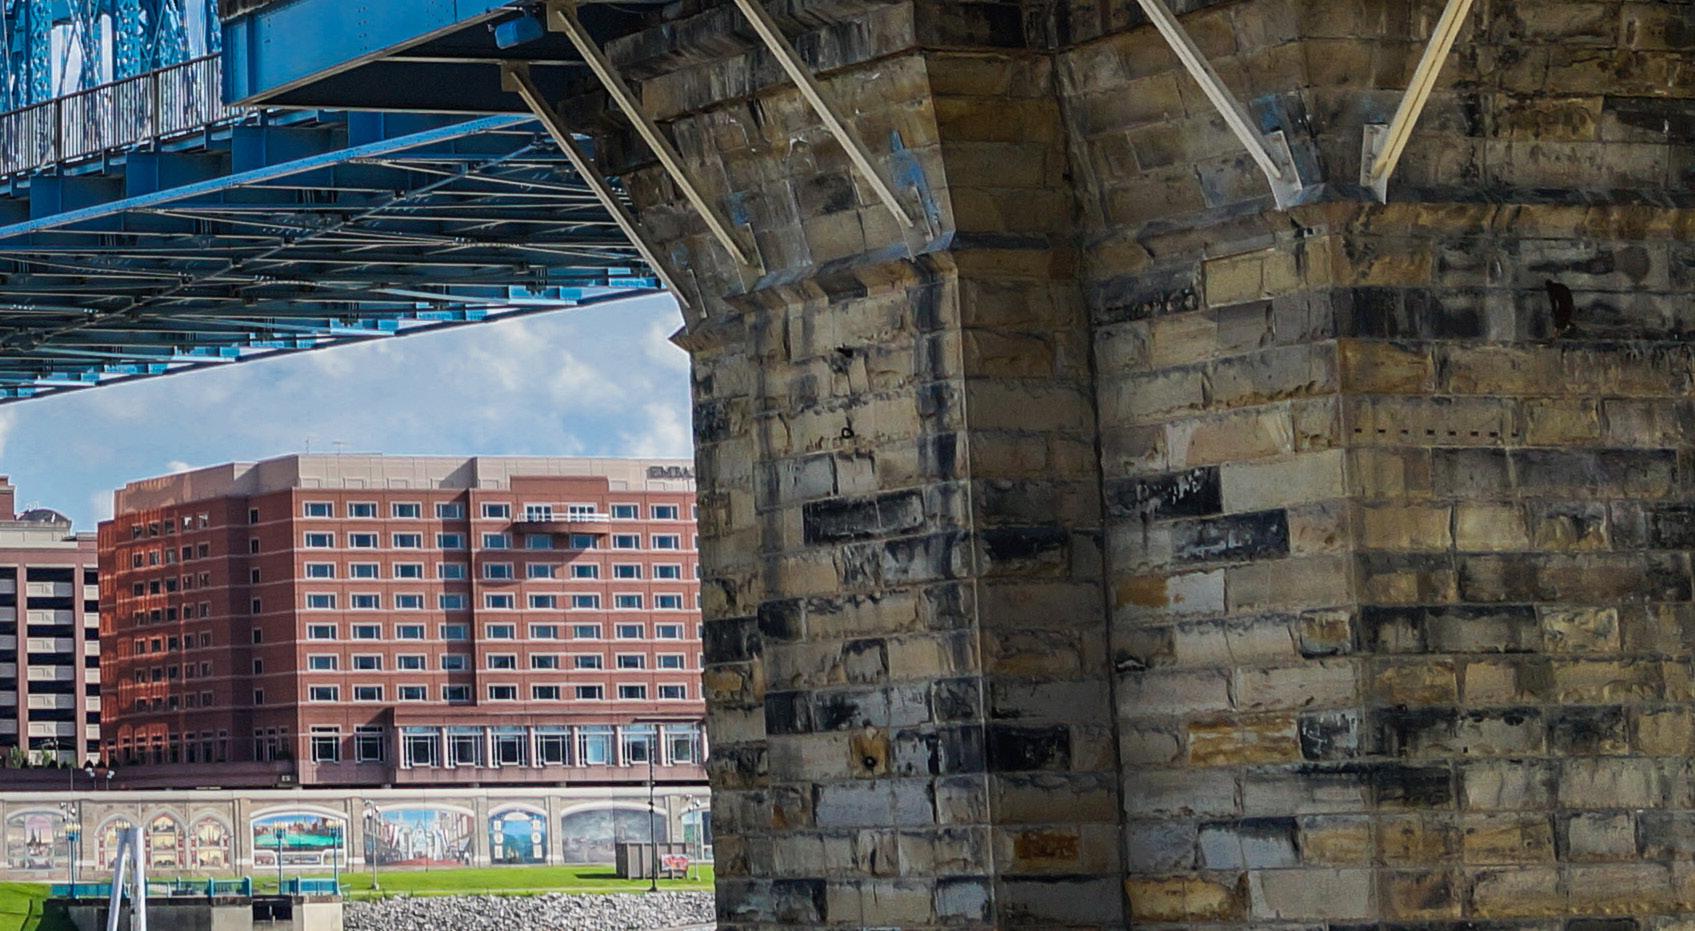
HEART OF DOWNTOWN
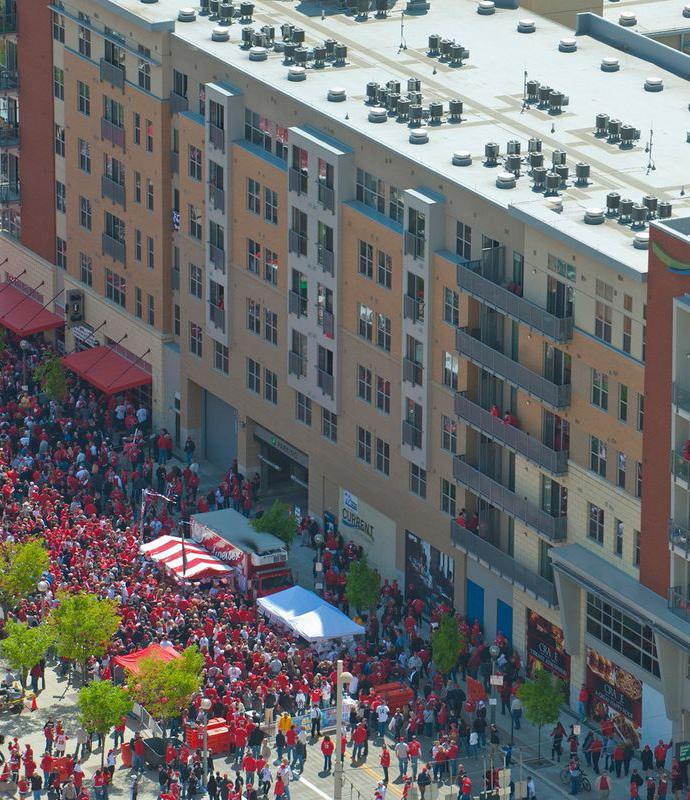
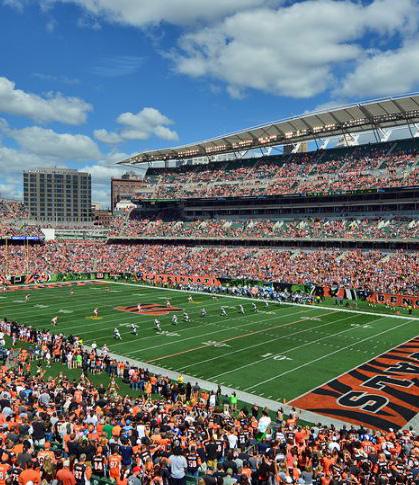
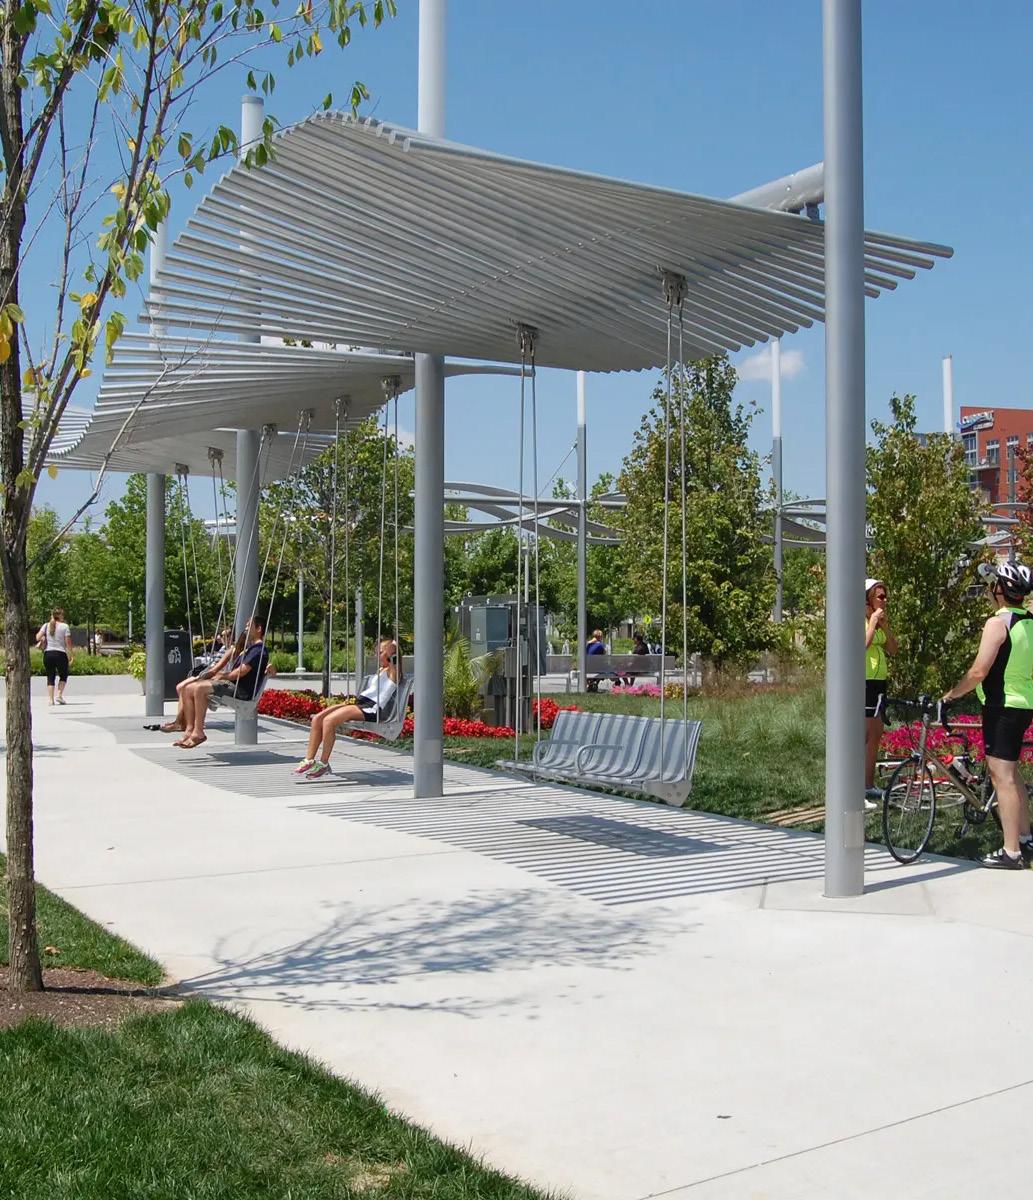
Right on the water and brimming with activity- The Banks is where you will find everything from sports events to a lively nightlife scene. Located along the Ohio River, The Banks provides spectacular riverfront views and lines the water with a family friendly park. Along with great biking, walking, and other recreational amenities during the daytime, The Banks comes alive at night. With live music and entertainment, a thriving bar scene nestled between two sports stadiums, The Banks is the place to be.

A major attraction at The Banks, the Andrew J Brady ICON Music Center was built for the audience experience, offering an intimate yet spacious setting. Offering both indoor and outdoor venues, the state-of-the-art facility hosts a wide variety of musical acts, spanning all genres. Visitors can enjoy a live concert while taking in the scenic riverfront view.

Ranked by USA Today readers as a Top 5 Riverwalk in the nation, Smale Riverfront Park offers walking trails, water features, swings, and other amenities to enjoy, while taking in the beautiful views of the Ohio River and the historic John A. Roebling Suspension Bridge. If you have kids in tow, make sure to visit Carol Ann’s Carousel, featuring 44 characters and illustrations incorporating Cincinnati landmarks. Enclosed in a glass building, the carousel is open year-round.

TQL STADIUM
The FCC-TQL partnership brings together two Cincinnati-grown, leading businesses that share a “no limits” philosophy as well as a deep connection and commitment to our local community. There are a lot of synergies that make this alliance between TQL and FCC a perfect match and are reflected throughout the stadium from — the fin lighting to the TQL Beer District. The stadium features first-in-the-world lighting technology powered by 2.7 miles of LED lights.
ATTRACTIONS CINCINNATI ZOO
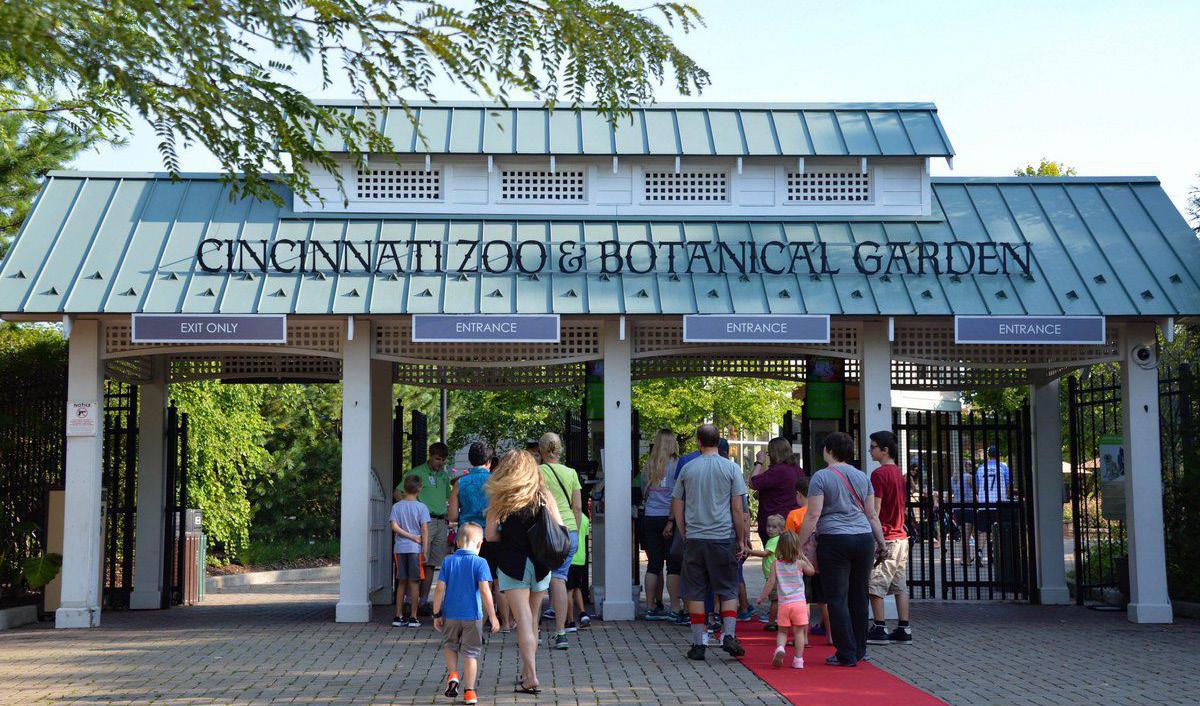
The Cincinnati Zoo & Botanical Garden is the second oldest zoo in the United States, founded in 1873 and officially opening in 1875, after the Roger Williams Park Zoo. It is located in the Avondale neighborhood of Cincinnati, Ohio. It originally began with 64.5 acres in the middle of the city, but has spread into the neighboring blocks and several reserves in Cincinnati’s outer suburbs. It was appointed as a National Historic Landmark in 1987.
From 11am – 1am daily, the 85-acre DORA district at The Banks allows guests to take their beverage purchased from one of the 18 Banks establishments and explore our public plazas and green spaces. It simply needs to be in the Official DORA Cup.
At risk of missing the first pitch? Late for the opening act? Take your beverage purchased in a DORA cup from a Banks establishment and go! Waiting for a table, or wish to picnic outside in The Banks plazas or greenspaces? Grab a DORA beverage from a Banks establishment and explore!
DORA
HARD ROCK CASINO

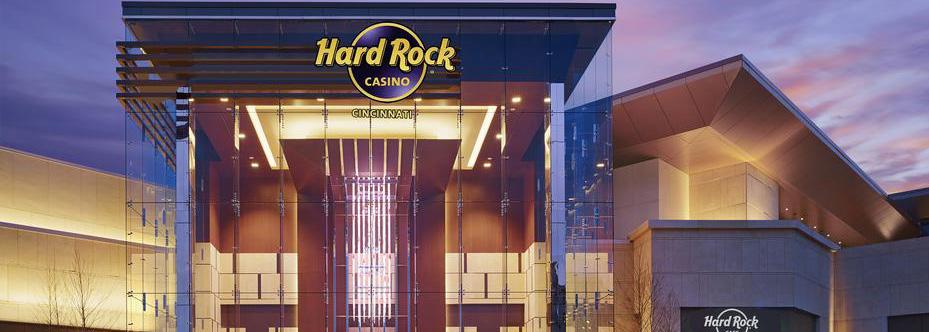
The game is always on at Hard Rock Casinos, where stars are made every night. Come try your hand at the tables, with classic games including blackjack, baccarat and poker, or tap into thousands of the hottest slots on the planet. With the world’s greatest rock memorabilia collection to enhance the thrill, plus the accompaniment of live, world-class entertainment, the atmosphere is like no other.
CINCINNATI ART MUSEUM

Located in scenic Eden Park, the Cincinnati Art Museum features a diverse, encyclopedic art collection of more than 67,000 works spanning 6,000 years. In addition to displaying its own broad collection, the museum also hosts several national and international traveling exhibitions each year. Visitors can enjoy the exhibitions or participate in the museum’s wide range of art-related programs, activities and special events. General admission is always free
for all. Museum members receive additional benefits. The museum is supported by the generosity of individuals and businesses that give annually to ArtsWave. The Ohio Arts Council helped fund the museum with state tax dollars to encourage economic growth, educational excellence and cultural enrichment for all Ohioans. The museum gratefully acknowledges operating support from the City of Cincinnati, as well as our museum members.
RETAIL & SHOPPING


In addition to the restaurant and nightlight scene, the area has no shortage of retail options. Downtown offers both boutiques and department stores. Over-the-Rhine (OTR) is a historic, walkable district of downtown Cincinnati with many independent shops. Cincinnati’s Over-the-Rhine neighborhood was once a place where residents would not recommend to visitors, but that has changed. The restaurant and nightlife scene is now thriving, and the shopping scene is beginning to catch up. Most of the shops are in the southwest quarter of Over-the-Rhine, on either Vine or Main St. You won’t find chain stores in this walkable shopping district. MiCA 12/v and Urban Eden are a popular gift shops that sell local arts and crafts. Elm & Iron sells vintage and up-cycled items for the home. The Little Mahatma sells exotic jewelry and folk art from around the world. You’ll find several clothing boutiques, including Mannequin, a non-profit upscale and vintage boutique that benefits local charities. Park + Vine is a popular general store for environmentally-conscious shoppers; they sell a variety of merchandise including green cleaning and personal products, vegan foods, garden products and more.
FINDLAY MARKET

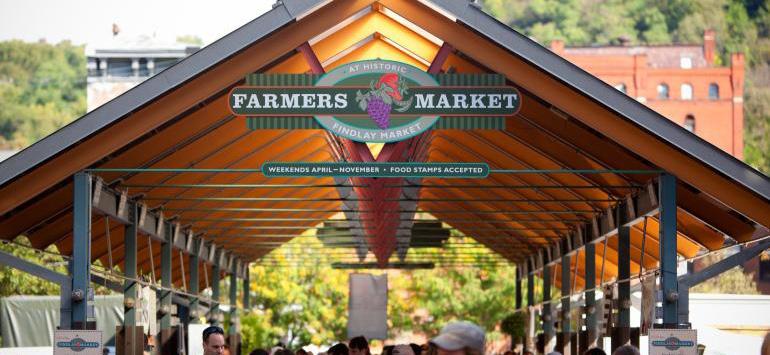
Findlay Market is Ohio’s oldest continuously operated public market and is located in the historic Over-the-Rhine neighborhood. The market is a wonderful place for locals to buy their groceries as well as a must-see historic spot for visitors to Cincinnati. Findlay Market is open year-round, Tuesday through Sunday, with a seasonal farmers market. Nearly 40 full-time businesses operate year-round, plus over 100 more vendors operate on weekends or part-time. Many vendors sell raw food while others specialize in prepared foods. Some of the merchants are new startups, while others have been in business for generations. You’ll find everything from fresh meat and produce to imported fine teas to Belgian waffles. There are restaurants as well as a beer garden, so plan to stay for lunch. Findlay Market has a fascinating history. Why not take a tour to learn more? There are several different tour options, including a culinary tour with tasty samples.

LEAD AGENTS Nick Andrews First Vice President Investments Cincinnati Office D. 513.878.7741 nicholas.andrews@marcusmillichap.com Jordan Dickman First Vice President Investments Cincinnati Office D. 513.878.7735 jordan.dickman@marcusmillichap.com Austin Sum Senior Associate Cincinnati Office D. 513.878.7747 austin.sum@marcusmillichap.com “OUR COMMITMENT IS TO HELP OUR CLIENTS CREATE AND PRESERVE WEALTH BY PROVIDING THEM WITH THE BEST REAL ESTATE INVESTMENT SALES, FINANCING, RESEARCH AND ADVISORY SERVICES AVAILABLE.”