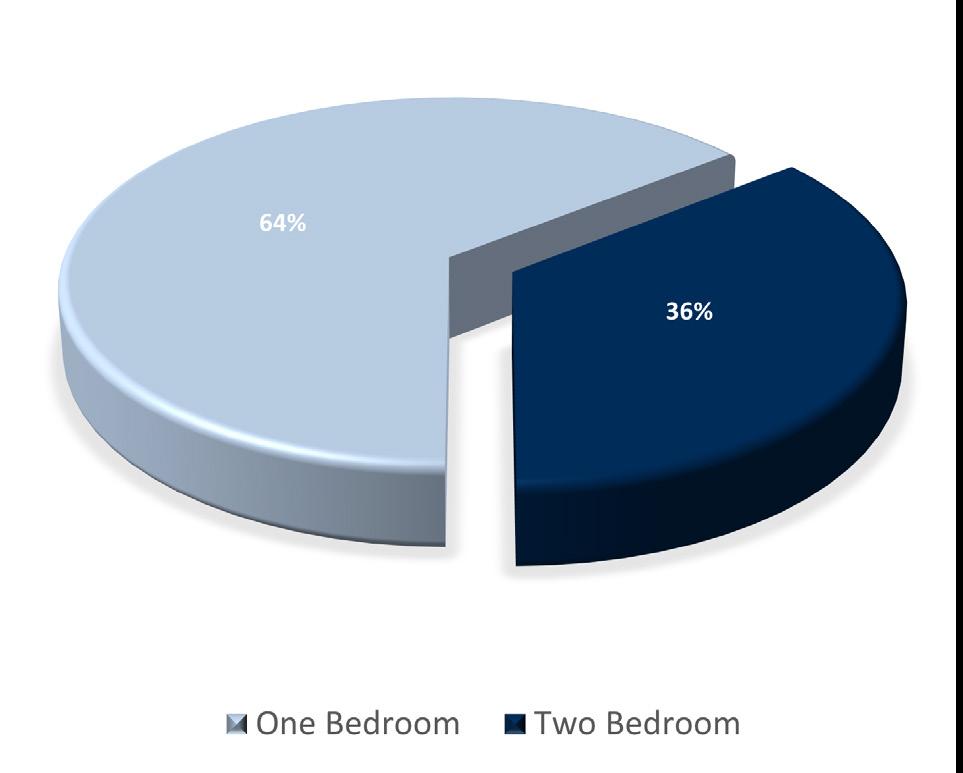
UNIT MIX BREAKDOWN
One Bedroom
1BR/1BA
1BR/1BA
1BR/1BA
1BR/1BA
5490-5500
SF $8,550
1BR/1BA - Large - 5653-5659 11 Units 685 SF 7,535 SF $740.91 $1.08 SF $8,150 $745.00 $1.09 SF $8,195 $950.00 $1.39 SF $10,450

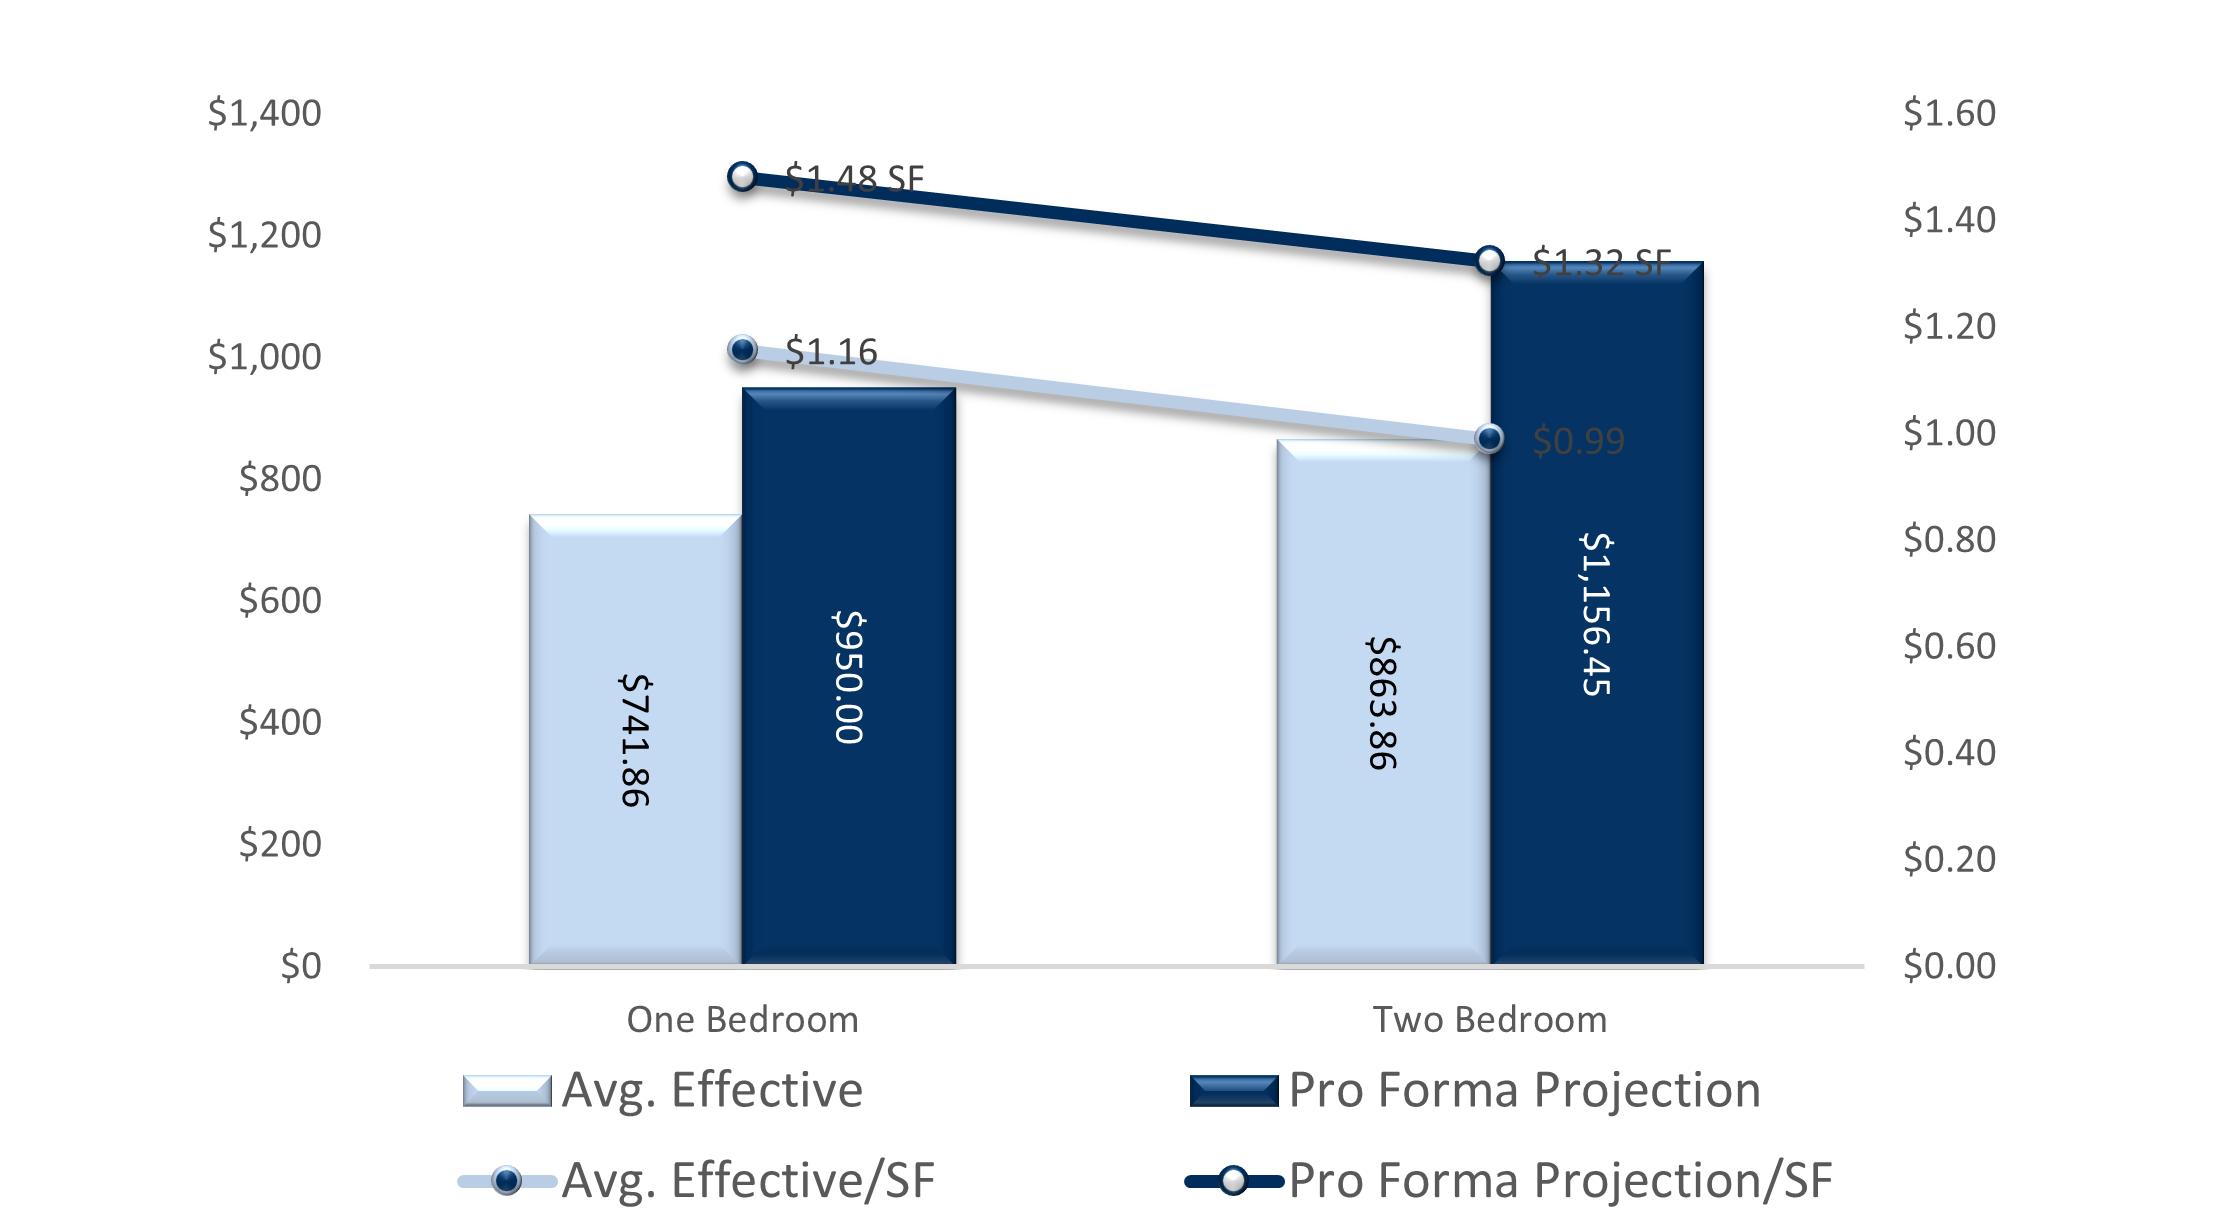
Totals / Wtd. Averages 56 Units 642 SF 35,930 SF $741.86 $1.16 SF $41,544 $756.25 $1.18 SF $42,350 $950.00 $1.48 SF $53,200
Two Bedroom
2BR/1BA - Small - 5490-5500 6 Units 800 SF 4,800 SF $835.00 $1.04 SF $5,010 $850.00 $1.06 SF $5,100 $1,150.00 $1.44 SF $6,900
2BR/1BA - 5615-5577 Beechmont 11 Units 850 SF 9,350 SF $809.44 $0.95 SF $8,904 $810.00 $0.95 SF $8,910 $1,150.00 $1.35 SF $12,650
2BR/1BA - 5653-5659 Beechmont 6 Units 850 SF 5,100 SF $810.00 $0.95 SF $4,860 $810.00 $0.95 SF $4,860 $1,150.00 $1.35 SF $6,900
2BR/1BA - Large - 5623 Beechmont 8 Units 980 SF 7,840 SF $1,000.71 $1.02 SF $8,006 $1,030.00 $1.05 SF $8,240 $1,175.00 $1.20 SF $9,400
Totals / Wtd. Averages 31 Units 874 SF 27,090 SF $863.86 $0.99 SF $26,780 $874.52 $1.00 SF $27,110 $1,156.45 $1.32 SF $35,850
AVERAGE EFFECTIVE MARKET PROJECTED
TYPE NO. OF UNITS RENTABLE SF TOTAL SF RENT/UNIT RENT/SF TOTAL RENT POTENTIAL RENT/UNIT
TOTAL
POTENTIAL RENT/UNIT RENT/SF TOTAL RENT POTENTIAL
UNIT
RENT/SF
RENT
- Small - 5615-5577 13 Units 575 SF 7,475 SF $720.38 $1.25 SF $9,365 $750.00 $1.30 SF $9,750 $950.00 $1.65 SF $12,350
- Small - 5653-5659 5 Units 575 SF 2,875 SF $715.00 $1.24 SF $3,575 $750.00 $1.30 SF $3,750 $950.00 $1.65 SF $4,750
-
Beechmont 18 Units 660 SF 11,880 SF $768.53 $1.16 SF $13,834 $775.00 $1.17 SF $13,950 $950.00 $1.44 SF $17,100
- Large - 5615-5577 9 Units 685 SF 6,165 SF $735.63 $1.07 SF $6,621 $745.00 $1.09 SF $6,705 $950.00 $1.39
RIVERSTONE - FINANCIALS
GROSS POTENTIAL RENT
CURRENT (RENT ROLL/T3 INCOME; ADJUSTED TRAILING EXPENSES)
% of GPR Per Unit
YEAR 1 60% ARE BEING RENOVATED
% of GPR Per Unit
All Units at Market Rent $824,160 T3 9,473 $1,068,600 12,283
Gain (Loss) to Lease ($10,713) T3 1.30% (123) ($96,174) 9.00% (1,105)
GROSS SCHEDULED RENT $813,447 9,350 $972,426 11,177
OTHER INCOME
Water Reimb
$35,630 T3 4.38% 410 $36,699 3.77% 422
MTM Fee $12,800 T3 1.57% 147 $13,184 1.36% 152
Pet Fees $7,923 T3 0.97% 91 $8,161 0.84% 94
Late Rent Fees $6,600 T3 0.81% 76 $6,798 0.70% 78
Waste Disposal Reimb $6,013 T3 0.74% 69 $6,193 0.64% 71
Laundry Income $4,536 T3 0.56% 52 $4,672 0.48% 54
Utility Read Income from Tenants $2,976 T3 0.37% 34 $3,065 0.32% 35
Collections $2,750 T3 0.34% 32 $2,833 0.29% 33
Collections- Eviction Filing Fees $2,080 T3 0.26% 24 $2,142 0.22% 25
Total Other Income $90,419 11.12% 1,039 $93,131 9.58% 1,070
GROSS POTENTIAL INCOME
$903,866 10,389 $1,065,557 12,248
Physical Vacancy ($29,339) T3 3.61% (337) ($48,621) 5.00% (559)

Bad Debt ($38,014) T3 4.67% (437) ($9,724) 1.00% (112)
Concessions Allowance ($400) T3 0.05% (5) $0 0.00% 0
EFFECTIVE GROSS INCOME $836,113 90.37% 9,610 $909,969 75.00% 10,459
NON-CONTROLLABLE
Real Estate Taxes % of EGI Per Unit % of EGI Per Unit
2021 Taxes Paid $68,146 Auditor 8.15% 783 $68,146 7.49% 783 Adjustment for Sale $89,968 10.76% 1,034 $89,968 9.89% 1,034
Total Real Estate Taxes $158,114 18.91% 1,817 $158,114 17.38% 1,817
Insurance $15,124 T12 1.81% 174 $26,100 2.87% 300
Utilities
Gas & Electric $40,027 T12 4.79% 460 $40,827 4.49% 469
Gas & Electric Vacant $1,421 T12 0.17% 16 $1,449 0.16% 17 Water & Sewage $42,804 T12 5.12% 492 $43,660 4.80% 502 Trash Removal $9,093 T12 1.09% 105 $9,275 1.02% 107
Utility Meter Fee $2,746 T12 0.33% 32 $2,801 0.31% 32 Total Utilities $96,091 11.49% 1,104 $98,012 10.77% 1,127 Total Non-Controllable $269,329 32.21% 3,096 $282,227 31.01% 3,244
CONTROLLABLE Contract Services Snow Removal $5,654
Landscaping/Grounds $20,082
Pest Control
Total Contract Services $26,423
Repairs & Maintenance $42,849
Marketing & Promotion $4,579 T12 0.55% 53 $6,525 0.72% 75 On-Site Payroll $106,777 T12 12.77% 1,227 $87,000 9.56% 1,000 Payroll Taxes & Benefits $10,056 T12 1.20% 116 $13,050 1.43% 150 General & Administrative $22,407 T12 2.68% 258 $13,050 1.43% 150 Management Fee $32,138 T12 3.84% 369 $36,399 4.00% 418 Telephone & Cable $1,026 T12 0.12% 12 $1,305 0.14% 15 Replacement & Reserves $22,185 Note 1 2.65% 255 $22,629 2.49% 260 Total Controllable $268,439 32.11% 3,086 $258,692 28.43% 2,973 TOTAL EXPENSES $537,768 64.32% 6,181 $540,919 59.44% 6,217 NET OPERATING INCOME $298,345 35.68% 3,429 $369,050 40.56% 4,242 INCOME & EXPENSES RIVERSTONEFINANCIALS INCOME EXPENSE
T12 0.68% 65 $6,090 0.67% 70
T12 2.40% 231 $17,400 1.91% 200
$687 T12 0.08% 8 $3,045 0.33% 35
3.16% 304 $26,535 2.92% 305
T12 5.12% 493 $52,200 5.74% 600
YEAR 2
(Projected Rent Increase after Stabilization, Reno)
% of GPR Per Unit
YEAR 3
(Projected Rent/ Expense Increase after Stabilization)
% of GPR Per Unit
$1,111,344 12,774 $1,155,798 13,285 ($44,454) 4.00% (511) ($23,116) 2.00% (266) $1,066,890 12,263 $1,132,682 13,019
$37,800 3.54% 434 $38,934 3.44% 448 $13,580 1.27% 156 $13,987 1.23% 161 $8,406 0.79% 97 $8,658 0.76% 100 $7,002 0.66% 80 $7,212 0.64% 83 $6,379 0.60% 73 $6,571 0.58% 76 $4,812 0.45% 55 $4,956 0.44% 57 $3,157 0.30% 36 $3,252 0.29% 37 $2,918 0.27% 34 $3,005 0.27% 35 $2,206 0.21% 25 $2,272 0.20% 26 $95,922 8.99% 1,103 $98,796 8.72% 1,136
$1,162,812 13,366 $1,231,478 14,155 ($53,345) 5.00% (613) ($56,634) 5.00% (651) ($10,669) 1.00% (123) ($11,327) 1.00% (130) $0 0.00% 0 $0 0.00% 0
$1,098,799 90.00% 12,630 $1,163,517 92.00% 13,374
% of EGI Per Unit
% of EGI Per Unit $68,146 6.20% 783 $68,146 6.20% 783 $89,968 8.19% 1,034 $89,968 8.19% 1,034 $158,114 14.39% 1,817 $158,114 14.39% 1,817 $26,622 2.42% 306 $27,154 2.47% 312
$41,644 3.79% 479 $42,477 3.87% 488 $1,478 0.13% 17 $1,507 0.14% 17 $44,533 4.05% 512 $45,424 4.13% 522 $9,460 0.86% 109 $9,650 0.88% 111 $2,857 0.26% 33 $2,915 0.27% 34 $99,973 9.10% 1,149 $101,972 9.28% 1,172 $284,709 25.91% 3,273 $287,241 26.14% 3,302
$6,212 0.57% 71 $6,336 0.58% 73 $17,748 1.62% 204 $18,103 1.65% 208 $3,106 0.28% 36 $3,168 0.29% 36 $27,066 2.46% 311 $27,607 2.51% 317 $53,244 4.85% 612 $54,309 4.94% 624 $6,656 0.61% 77 $6,789 0.62% 78 $88,740 8.08% 1,020 $90,515 8.24% 1,040 $13,311 1.21% 153 $13,577 1.24% 156 $13,311 1.21% 153 $13,577 1.24% 156 $43,952 4.00% 505 $46,541 4.00% 505 $1,331 0.12% 15 $1,358 0.12% 16 $23,081 2.10% 265 $23,543 2.14% 271 $270,692 24.64% 3,111 $277,815 25.05% 3,164 $555,401 50.55% 6,384 $565,056 51.42% 6,495 $543,398 49.45% 6,246 $598,461 54.47% 6,879
GROSS
POTENTIAL RENT
All Units at Market Rent
$824,160 $1,068,600 $1,111,344 $1,155,798 $1,202,030 $1,250,111 $1,300,115 $1,352,120 $1,406,205 $1,462,453 $1,520,951
Gain (Loss) to Lease ($10,713) ($96,174) ($44,454) ($23,116) ($24,041) ($25,002) ($26,002) ($27,042) ($28,124) ($29,249) ($30,419)
GROSS SCHEDULED RENT
$813,447 $972,426 $1,066,890 $1,132,682 $1,177,989 $1,225,109 $1,274,113 $1,325,078 $1,378,081 $1,433,204 $1,490,532
Total Other Income $90,419 $93,131 $95,922 $98,796 $100,772 $102,787 $104,843 $106,940 $109,079 $111,260 $113,486
GROSS POTENTIAL INCOME
$903,866 $1,065,557 $1,162,812 $1,231,478 $1,278,761 $1,327,896 $1,378,956 $1,432,018 $1,487,159 $1,544,464 $1,604,018
Physical Vacancy ($29,339) ($48,621) ($53,345) ($56,634) ($58,899) ($61,255) ($63,706) ($66,254) ($68,904) ($71,660) ($74,527)
Bad Debt ($38,014) ($9,724) ($10,669) ($11,327) ($11,780) ($12,251) ($12,741) ($13,251) ($13,781) ($14,332) ($14,905)
Concessions Allowance ($400) $0 $0 $0 $0 $0 $0 $0 $0 $0 $0
EFFECTIVE GROSS INCOME
$836,113 $909,969 $1,098,799 $1,163,517 $1,208,082 $1,254,390 $1,302,509 $1,352,513 $1,404,475 $1,458,472 $1,514,586
Real Estate Taxes $158,114 $158,114 $158,114 $158,114 $161,277 $164,502 $167,792 $171,148 $174,571 $178,063 $181,624
Insurance $15,124 $26,100 $26,622 $27,154 $27,698 $28,251 $28,817 $29,393 $29,981 $30,580 $31,192
Utilities $96,091 $98,012 $99,973 $101,972 $104,012 $106,092 $108,214 $110,378 $112,585 $114,837 $117,134
Contract Services $26,423 $26,535 $27,066 $27,607 $28,159 $28,722 $29,297 $29,883 $30,480 $31,090 $31,712
Repairs & Maintenance $42,849 $52,200 $53,244 $54,309 $55,395 $56,503 $57,633 $58,786 $59,961 $61,161 $62,384
Marketing & Promotion $4,579 $6,525 $6,656 $6,789 $6,924 $7,063 $7,204 $7,348 $7,495 $7,645 $7,798
On-Site Payroll $106,777 $87,000 $88,740 $90,515 $92,325 $94,172 $96,055 $97,976 $99,936 $101,934 $103,973
Payroll Taxes & Benefits $10,056 $13,050 $13,311 $13,577 $13,849 $14,126 $14,408 $14,696 $14,990 $15,290 $15,596
General & Administrative $22,407 $13,050 $13,311 $13,577 $13,849 $14,126 $14,408 $14,696 $14,990 $15,290 $15,596
Management Fee $32,138 $36,399 $43,952 $46,541 $48,323 $50,176 $52,100 $54,101 $56,179 $58,339 $60,583
Telephone & Cable $1,026 $1,305 $1,331 $1,358 $1,385 $1,413 $1,441 $1,470 $1,499 $1,529 $1,560
Replacement & Reserves $22,185 $22,629 $23,081 $23,543 $24,014 $24,494 $24,984 $25,484 $25,993 $26,513 $27,043
TOTAL EXPENSES $537,768 $540,919 $555,401 $565,056 $577,209 $589,639 $602,353 $615,358 $628,662 $642,271 $656,195
NET OPERATING INCOME $298,345 $369,050 $543,398 $598,461 $630,873 $664,751 $700,156 $737,155 $775,813 $816,201 $858,391
CURRENT YR 1 YR 2 YR 3 YR 4 YR 5 YR 6 YR 7 YR 8 YR 9 YR 10 YE OCT-2023 YE SEP-2024 YE SEP-2025 YE SEP-2026 YE SEP-2027 YE SEP-2028 YE SEP-2029 YE SEP-2030 YE SEP-2031 YE SEP-2032
CASH FLOW RIVERSTONEFINANCIALS INCOME EXPENSE
CASH FLOW PROJECTION GROWTH RATE ASSUMPTIONS
Income
Gross Potential Rent 29.66% 4.00% 4.00% 4.00% 4.00% 4.00% 4.00% 4.00% 4.00% 4.00%
(Loss) / Gain to Lease* 9.00% 4.00% 2.00% 2.00% 2.00% 2.00% 2.00% 2.00% 2.00% 2.00%
Other Income 3.00% 3.00% 3.00% 3.00% 3.00% 3.00% 3.00% 3.00% 3.00% 3.00%
Expenses
Expenses 2.00% 2.00% 2.00% 2.00% 2.00% 2.00% 2.00% 2.00% 2.00%
Management Fee** 4.00% 4.00% 4.00% 4.00% 4.00% 4.00% 4.00% 4.00% 4.00% 4.00%
CASH FLOW PROJECTION GROWTH RATE ASSUMPTIONS
Physical Vacancy 5.00% 5.00% 5.00% 5.00% 5.00% 5.00% 5.00% 5.00% 5.00% 5.00%
Non-Revenue Units 10.00% 0.00% 0.00% 0.00% 0.00% 0.00% 0.00% 0.00% 0.00% 0.00%
Bad Debt 1.00% 1.00% 1.00% 1.00% 1.00% 1.00% 1.00% 1.00% 1.00% 1.00% Concessions Allowance 0.00% 0.00% 0.00% 0.00% 0.00% 0.00% 0.00% 0.00% 0.00% 0.00%
Total Economic Loss 16.00% 6.00% 6.00% 6.00% 6.00% 6.00% 6.00% 6.00% 6.00% 6.00%
*Calculated as a percentage of Gross Potential Rent | **Calculated as a percentage of Effective Gross Income
YR 1 YR 2 YR 3 YR 4 YR 5 YR 6 YR 7 YR 8 YR 9 YR 10
1 YR 2 YR 3 YR 4 YR 5 YR 6 YR 7 YR 8 YR
YR
YR
9
10

04 SECTION LOCAL


 Brittany Campbell-Koch Director of Operations
Liz
Brittany Campbell-Koch Director of Operations
Liz